


Introduction
The pharynx and middle ear are connected by the Eustachian tube (ET), which plays an important role in the ventilation, protection, and cleaning of the middle ear [1]. ET dysfunction is associated with a variety of middle ear diseases. The structure of the ET is very complicated, consisting of various tissues, such as cartilage, muscle, and fat. The ET lumen is encircled by the ET cartilage (ETC), tensor, and levator veli palatini muscle. The ETC is an important contributor of ET function. Therefore, the morphology of the ETC can affect ET function [1-3]. Near the pharyngeal orifice, the ETC is a dome-shaped or hook-shaped structure with short lateral and long medial laminae [1,4]. Elasticity of the ETC is similar to that of the auricle or nose cartilage [1]. The ETC is a major surgical landmark; however, transnasal endoscopy does not provide data about the ETC, submucosal, or deep structures [5-7]; thus, magnetic resonance (MR) is used to visualise the ET in detail, including the surrounding muscles and the Ostmann fat pad [4]. The purpose of this study was to prospectively assess the ETC using 3 Tesla (3T) magnetic resonance imaging (MRI) and compare the results between healthy ears and those with a middle ear disease.
Material and methods
The study was conducted in our university hospital between January 2014 and May 2015, and included 56 ears of volunteers with a middle ear disease as the patient group and 100 ears of volunteers without a disease as the control group. The population consisted of adults between the ages of 18 and 65 years. The patient and control groups were randomly selected. The ETC of the patient and control groups were prospectively visualised using 3T MRI. A middle ear disease diagnosis was made based on the temporal computed tomography (CT) and/or MR image findings. Patients with syndromic and craniofacial anomalies were excluded from the study. The study protocol complied with the ethical guidelines of the Declaration of Helsinki, and approval for the study was obtained from the Ethics Committee. Before performing MR procedures, written informed consent was obtained from all volunteers. During MR scanning, no oral or intravenous contrast agent was used. MR imaging was performed using a 3 Tesla system (General Electric Healthcare, Milwaukee, WI) in a supine position with a conventional quadrature head coil (GEM suite, GE Healthcare, USA). An axial 3D multiple echo recombined gradient echo (MERGE) sequence in the oblique parasagittal plane was obtained unilaterally or bilaterally in each patient to visualise the ETC. Before the MERGE sequence, standard temporal MR sequences were acquired for each patient. The axial 3D MERGE sequence parameters are shown in table 1. The MR images were assessed by a head and neck radiologist with 10 years’ experience using a workstation (GE Medical Systems). The oblique parasagittal images were obtained perpendicularly to the mid-portion of the ETC long axis on the axial images using median price ratio (MPR). Visualisation of the ETC in the oblique parasagittal plane of the MERGE scans was evaluated according to a three-point numerical rating score (Table 2). Heterogeneity of the MR signal intensity of the ETC was noted as degenerative changes and graded (Table 3). The medial laminal thickness of the ETC was measured in the oblique parasagittal planes. In addition, the diameter of the ET lumen was measured unilaterally or bilaterally at the mid-level of the cartilage in the axial plane. Craniofacial anomalies were excluded. After the specimens were grouped by scoring and grading system, 156 ears were assessed in terms of presence/absence of a middle ear disease according to the temporal MRI and/or prior temporal CT results obtained from the picture archiving and communication system. The patient group with a middle ear disease and the control group without a middle ear disease were compared according to the scoring and grading system, and measurements. ETC scoring was based on the system described by Oshima et al. [4] with a slight modification. We excluded Score 0 (impossible to determine the outline) because we did not have any patient with this score. The degenerative changes of ETC were graded according to the meniscal tear grading system [8], excluding Grade 3 (tear extending freely over the meniscal surface) (Figures 1-3).
Table 1
Axial 3D MERGE sequence parameters
| Parameters | Axial 3D MERGE |
|---|---|
| TR | 73.7 |
| TE | 12.3 |
| FOV (field of view) | 22 |
| Matrix size | 256 × 256 |
| Slice thickness | 0.8 |
| Flip angle | 5 |
| Band width | 50 |
Table 2
Numeric rating score of Eustachian tube cartilage
| Score | Visualisation of Eustachian tube cartilage | |
|---|---|---|
| 1 | Vague outline | |
| 2 | Intermediate definition | |
| 3 | Sharply defined | |
Table 3
Degeneration grade
| Grade | Cartilage degeneration |
|---|---|
| 0 | No degeneration |
| 1 | Punctuate degeneration |
| 2 | Linear degeneration |
Figure 1
Example of grade 0 degeneration. Eustachian tube cartilage (arrow) is shown in oblique parasagittal image
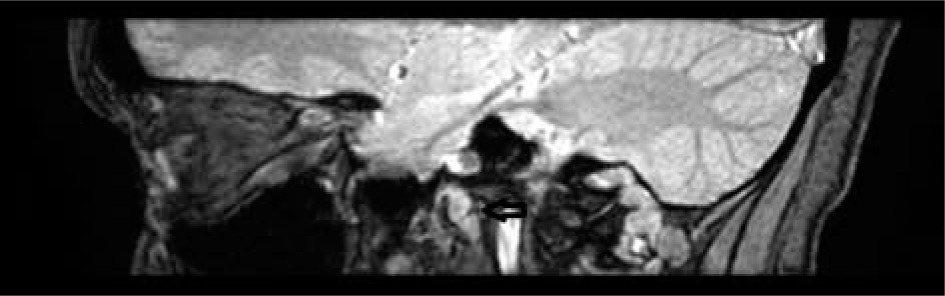
Figure 2
Example of grade 1 degeneration. Eustachian tube cartilage (arrow) is shown in oblique parasagittal image
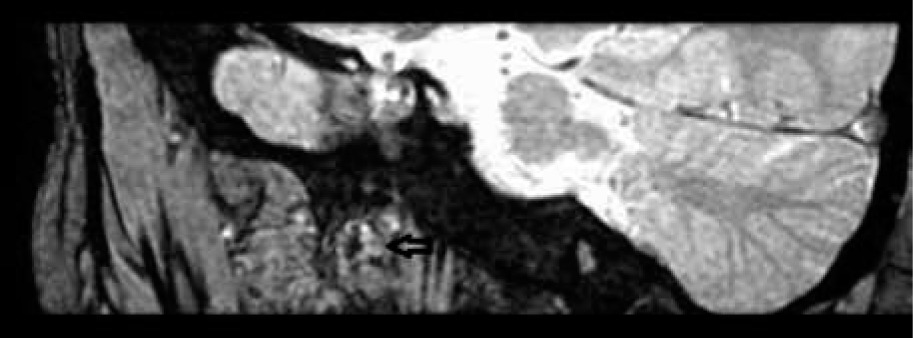
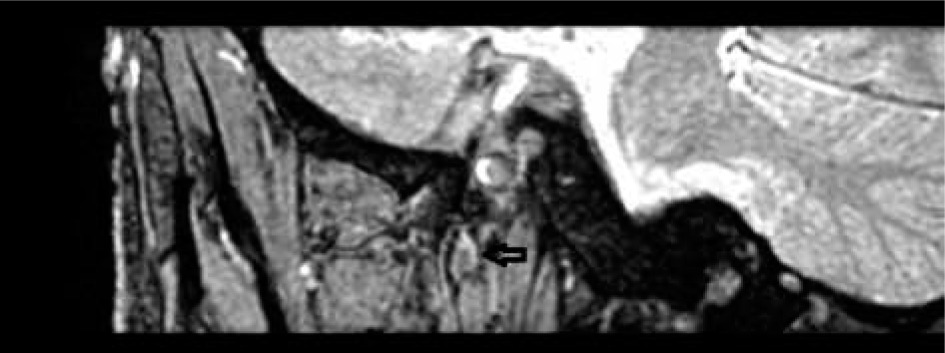
Figure 3
Example of grade 2 degeneration. Eustachian tube cartilage (arrow) is shown in oblique parasagittal image
Student’s t-test, Mann-Whitney U test, and Pearson’s c2 test were utilised, and the results were analysed using IBM SPSS Statistics vs. 20.0 (SPSS Inc., Chicago, IL, USA), and a p value of < 0.05 was considered to indicate statistically significant differences.
Results
The ETCs of 156 ears were first assessed using the axial 3D MERGE sequence, and then the temporal MRI and/or prior temporal CT results were obtained from picture archiving and communication system to determine the presence/absence of a middle ear disease. The population consisted of adults between the ages of 18 and 65 years. There was no significant difference between the patient and control groups according to age and gender (Tables 4 and 5). The mean medial laminal thickness of the ETC was 3.42 ± 0.90 mm in the patient group and 3.67 ± 0.73 mm in the control group, with no significant difference between the two groups. In the axial plane at the mid-level of ETC, the median value of the ET lumen diameter was 0.90 mm in the patient group and 1.20 mm in the control group. The ET lumen diameter was significantly smaller in the patient group than in the control group (Table 6). Among the patients with a middle ear disease, the median value of the ET lumen diameter was 0.85 mm for the Score 1 subgroup, 0.90 mm for the Score 2 subgroup, and 0.80 mm for the Score 3 subgroup. In the control group, the median value of the ET lumen diameter was 1.15 mm for Score 1, 1.25 mm for Score 2, and 1.20 mm for the Score 3 subgroup. The ET lumen diameter was significantly smaller in the patient group than in the control group for each score (Table 7). According to the degeneration grades, the mean age of the patients was 42.00 ± 6.92 years for the Grade 0 subgroup, 43.27 ± 11.67 years for the Grade 1 subgroup, and 44.88 ± 8.33 years for the Grade 2 subgroup. In the control group, the mean age was 43.72 ± 10.54, 44.44 ± 11.06, and 43.90 ± 11.29 years for Grade 0 to 2, respectively. There was no significant difference between degeneration grade and mean age in the patient and control groups (Table 8).
Table 4
Mean age in patient and control groups
| Patient group | Control group | Statistical analysis | |
|---|---|---|---|
| Age | 44.21 ± 9.36 | 44.08 ± 10.96 | t= 0.08, p= 0.93 |
Table 5
Gender distribution in patient and control groups
| Gender | Patient group | Control group | Total | Statistical analysis |
|---|---|---|---|---|
| Female | 30 (34.9%) | 56 (65.1%) | 86 (100%) | χ2 = 0.08 p= 0.77 |
| Male | 26 (37.1%) | 44 (62.9%) | 70 (100%) | |
| Total | 56 (35.9%) | 100 (64.1%) | 156 (100%) |
Table 6
Mean values of Eustachian tube cartilage medial laminal thickness and median values of Eustachian tube lumen diameter in patient and control groups
| Patient group | Control group | Statistical analysis | |
|---|---|---|---|
| X ± SD | |||
| Thickness | 3.42 ± 0.90 | 3.67 ± 0.73 | t= 1.73, p= 0.08 |
| Median (min-max) | |||
| Lumen diameter | 0.90 (0.40-2.60) | 1.20 (0.70-3.10) | Z= 8.10, p= 0.000 |
Table 7
Comparison of Eustachian tube cartilage score and median value of Eustachian tube lumen diameter in patient and control groups
Table 8
Comparison of Eustachian tube cartilage degeneration and mean age in patient and control groups
Discussion
In this study, we used the axial 3D MERGE sequence on 3T MR to visualise ETC. We believed that visualisation of ETC was very important because of the new techniques of ET surgery, such as balloon dilation [9]. ETC imaging will shed light on new surgical techniques related to ET. Assessment of the function and the anatomy of the ET are the main reason for imaging [10,11]. The ETC is one of the main structures of the ET. Having knowledge about the ETC and saving changes about it will guide new techniques.
In our study, the oblique parasagittal images were obtained perpendicularly to the mid-portion of the ETC long axis from the axial images using MPR. These images were acquired from the mid-portion to be closer to the isthmus level. Oshima et al. visualised the ETC from the pharyngeal orifice [4]. Studies suggest that fat-suppressed spoiled gradient echo and fast spin echo sequences are more successful in evaluating cartilage pathologies in musculoskeletal imaging, and in vivo and in vitro studies using the former sequence provide more accurate results [12-14]. Proton density imaging has also been reported to be helpful in visualising the meniscus, ligaments, and tendons, as well as cartilage [15]. Oshima et al. visualised ETC with proton and STIR sequences in 1.5T MR [4]. In our study, we used volumetric images in contrast to Oshima et al. [4], and because our aim was only to clearly visualise ET, we chose to use the MERGE sequence. We excluded Score 0 (impossible to determine the outline) from the evaluation because there was no patient with this score. We detected no significant difference between the patient and control groups according to age and gender. In the literature, there are studies investigating the ET length and angle [16-18], ETC amount according to age groups [16], cartilage cell density in relation to age [19], and cartilage elastin amount and volume [20-22]. Most similar to our work related to the measurement of the ET medial laminal thickness is the study undertaken by Amoodi et al. [23]. In their retrospective study, the authors evaluated 25 patients without ET dysfunction, and in addition to the ETC medial laminal thickness, they also measured the ETC medial laminal length, the thickness of the Ostmann fat pad, and the thickness of the tensor veli palatini muscle [23]. The results revealed that the medial laminal thickness did not change with age. In our study, the ET medial laminal thickness and its relationship with middle ear diseases was evaluated; however, no significant difference was found between the patient and control groups in terms of the ET cartilage medial laminal thickness. This result might be related to the age range of the two groups being 18 to 65 years. In the current study, the median value of the ET lumen diameter was calculated in the axial plane at the mid-level of ETC. The ET lumen diameter was significantly smaller in the patient group than in the control group. To the best of our knowledge, the narrowest and most functional part of the tubal lumen is the isthmus. Narrowing of the isthmus is one of the causes of otitis media [24]. It is considered that the ET surgical procedures that are currently performed on ETC will move to the isthmus level in the future as the main part showing ET patency [4]. In recent years, balloon dilation of cartilaginous ET has been shown to have potential clinical benefits in cadaveric studies, especially in cases with chronic otitis media disease, in which no significant side effects have been observed [25,26]. Balloon dilation is most effective at the level of the ET valve or isthmus. One of the reasons for this is that the isthmus cartilage is more rigid [25,27]. Evaluation of the isthmus level is very important because it will guide future studies. Miura et al. evaluated the ET lumen, measuring the volume of the narrowest part [22]. In our study, we measured the ET lumen diameter at the isthmus level, and, as expected, we found it to be significantly smaller in patients with a middle ear disease than in those with healthy ears. However, one of the limitations of the current study was that the area measured was very narrow. In this study, the lumen diameter was also evaluated according to the ETC score. The ET lumen diameter was significantly smaller in the patient group than in the control group for each subgroup of ETC score. While assessing the ETC morphology, we detected heterogeneity in intensity, which we attributed to degenerative changes. However, the lack of a pathological diagnosis for the findings accepted as degeneration can be considered as another limitation of the study. We also graded these degenerative changes. Oshima et al. [4] also detected heterogeneity, but they did not further evaluate it. In contrast, Takasaki et al. associated these structures with partial calcification or fragmentation. Calcification is a common change in the ETC that can affect ET function [28]. In the current study, no significant difference was found between degeneration grade and mean age in the patient and control groups. These degenerative changes might be associated with environmental and genetic factors.
The structure of ET is very complicated, consisting of various tissues, including cartilage, muscle, and fat. The ETC is an important contributor of ET function. Therefore, the morphology of ETC can affect ET function and patency. 3T MRI allows evaluation of ETC and the isthmus level, which are small but important anatomical localisations and surgical landmarks. MR imaging has the potential of providing essential information on ET prior to new surgical treatment of middle ear diseases. As the number of studies on ET cartilage increases, the morphological and functional relationship will be further elucidated. The changes in cartilage resulting in heterogeneity, which we interpreted as the presence of degeneration, should be confirmed by future studies.
Conclusions
In this study, we measured the ET lumen diameter at the isthmus level, and, as expected, we found it to be significantly smaller in patients with a middle ear disease than in those with healthy ears.
While assessing the ETC, we detected heterogeneity in intensity, which we attributed to degenerative changes.
3T MRI allows evaluation of ETC and the isthmus level, which are small but important anatomical localisations.