


Introduction
Thyroid nodules are the most common thyroid disease, and 4-7% of the adult population have palpable thyroid nodules [1]. Moreover, 5% of thyroid nodules are malignant, and thyroid malignancies constitute about 1% of all cancers annually [2]. The clinical presentation differs between incidental and solitary nodules, in which cancer is a concern and should be ruled out [3]. The key point in the evaluation of a thyroid nodule is the discrimination between the benign and malignant forms of the thyroid nodules.
There are many modalities that are used to assess the pathology of thyroid nodules, which include palpation, imaging, and biopsy. Ultrasonography is a simple, non-invasive, easily accessible, and cheap modality that is potentially useful to evaluate thyroid nodules. Several ultrasonographic characteristics such as taller-than-wide shape, marked hypoechogenicity, microcalcifications, irregular or microlobulate margins [4], and increased nodular flow visualised by Doppler ultrasound are shown to be associated with an increased risk of malignancy in nodular thyroid disease [3,5-9].
To date, ultrasound has had a limited specificity in the diagnosis and prognostication of thyroid malignancies [3,5-8]. Some authors have suggested a change in the approach of using individual ultrasonographic characteristics, suggesting new pattern recognition methods in the diagnosis of thyroid nodules. The purpose of this study was to evaluate the diagnostic accuracy of an ultrasound-driven diagnostic index for the identification of benign or malignant thyroid nodules.
Material and methods
Participants
From April 2010 to April 2013, 71 thyroid nodules from 71 consecutive patients were evaluated in the Radiology Department with both ultrasonography (US) and US-assisted fine needle aspiration biopsy (FNAB). Each patient signed an informed consent form prior to participation in the study, and they were free to withdraw at any step. The study was approved by the institutional review board of the Urmia University of Medical Sciences, Urmia, Iran. A single radiologist with nine years of experience performed all the studies.
All the patients were followed up for one year, and they were re-evaluated at the end of 12 months by both ultrasound and FNAB methods. Only those patients with definitive diagnosis according to the FNAB report were included in the final analysis. Nodules were considered as benign if they showed no change in the one-year follow-up or repeated FNAB showed no change in cytological findings. The exclusion criteria (according to cytological report) were: indeterminate cytological changes, suspicious for malignancy or inadequate cytological findings.
Ultrasonography
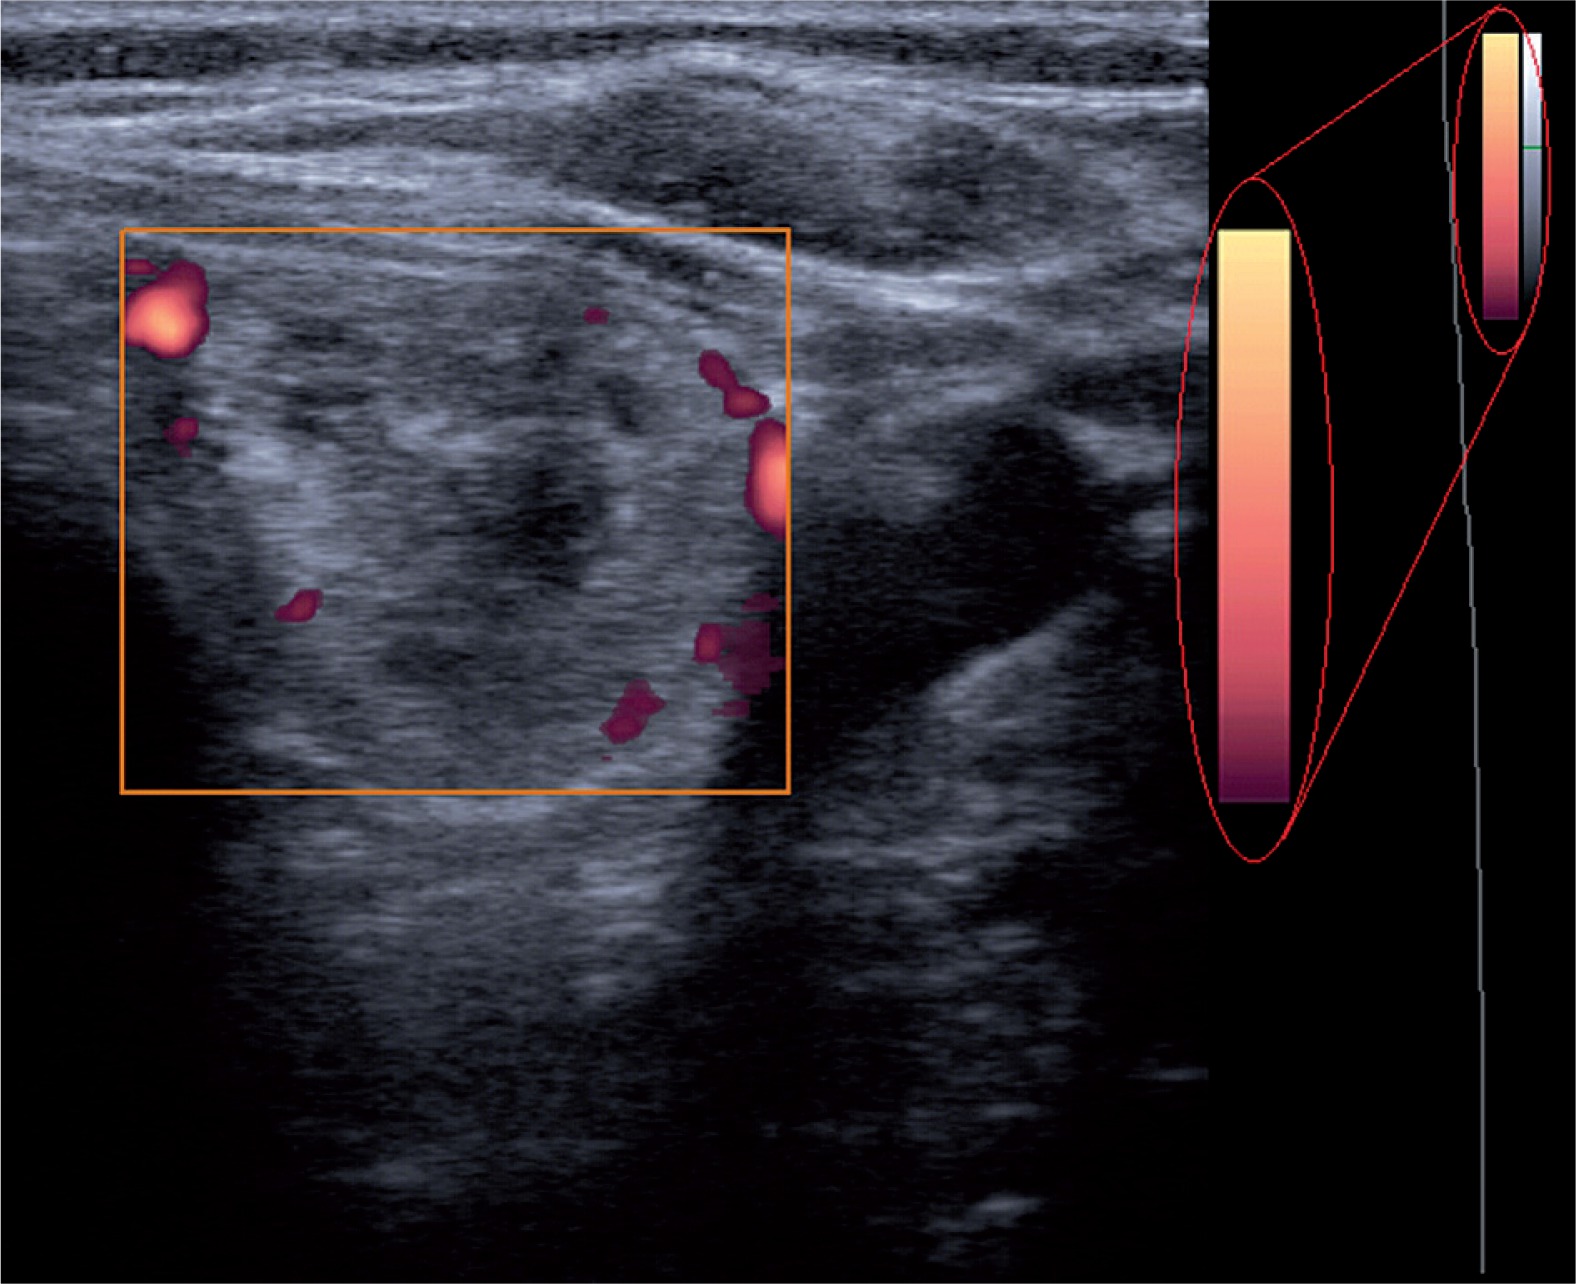
Thyroid grey-scale and power Doppler US were performed using a Medison Accuvix V20 machine (Medison, South Korea) with a 7-12-MHz broadband width transducer. The colour map of this device consists of 128 colours, each representing a different velocity (Figure 1).
Power Doppler ultrasonography (PDUS) was performed for all of the subjects before undergoing FNAB. We assessed the arteriole blood flow within the thyroid nodules. Power Doppler sonographies were used (pulse repetition frequency at minimum – 0.4-0.6 kHz) to obtain even the low blood flows. Specific settings included Doppler depth of 3 cm; overall gain equal to 60 dB; time gain compensation vertical and centred; power Doppler gain of 15-20 dB; and wall filter set at minimum.
Fine needle aspiration biopsy
An experienced radiologist performed ultrasound-guided FNAB in all patients with extended neck and supine position. In the first stage, after preparing a sterile field on the neck, the lesion was localised. Under ultrasound observation, until it was visible as a bright spot on the monitor, a 23-gauge needle attached to a 20-ml syringe was inserted perpendicularly to the neck until the needle was introduced to the target thyroid nodule. This procedure was performed without local anaesthesia. On real-time monitoring, aspiration and suction were performed with to-and-from movements, and suction was released before withdrawing the needle. At least four suction attempts were made. Subsequently, needle aspiration staining with Papanicolaou and Giemsa was performed on glass slides.
The results of the thyroid cytopathology, which were assessed by an experienced thyroid pathologist, were reported at the first step as diagnostic (satisfactory: at least six groups of benign follicles, each group composed of at least 10 cells in aspirated samples) or non-diagnostic (or unsatisfactory).
Cytopathology was reported as benign (colloid nodules, adenomatous nodules, lymphocytic thyroiditis, and other), indeterminate (follicular or Hurthle cell neoplasm), suspicious for malignancy, or malignant (papillary, follicular, medullary, and undifferentiated thyroid carcinoma), according to the Bethesda System for reporting thyroid cytopathology. Cytologic results were considered malignant when the specimen showed abundant cells with cytological features of cancer. Only those patients with a definitive pathological diagnosis such as benign or malignant disease were included in the study.
Malignancy Index
We designed a Windows-based software to process power Doppler US images that were recorded directly by the US device in Bitmap [BMP] format. In order to process the images, they were transferred from the US device to a desktop computer. All images had the same characteristics: width, 1024 pixels; height, 768 pixels; vertical and horizontal resolution, 72 dpi; and bit depth, 24. The processing of images in this software consists of the four following steps (Figure 2):
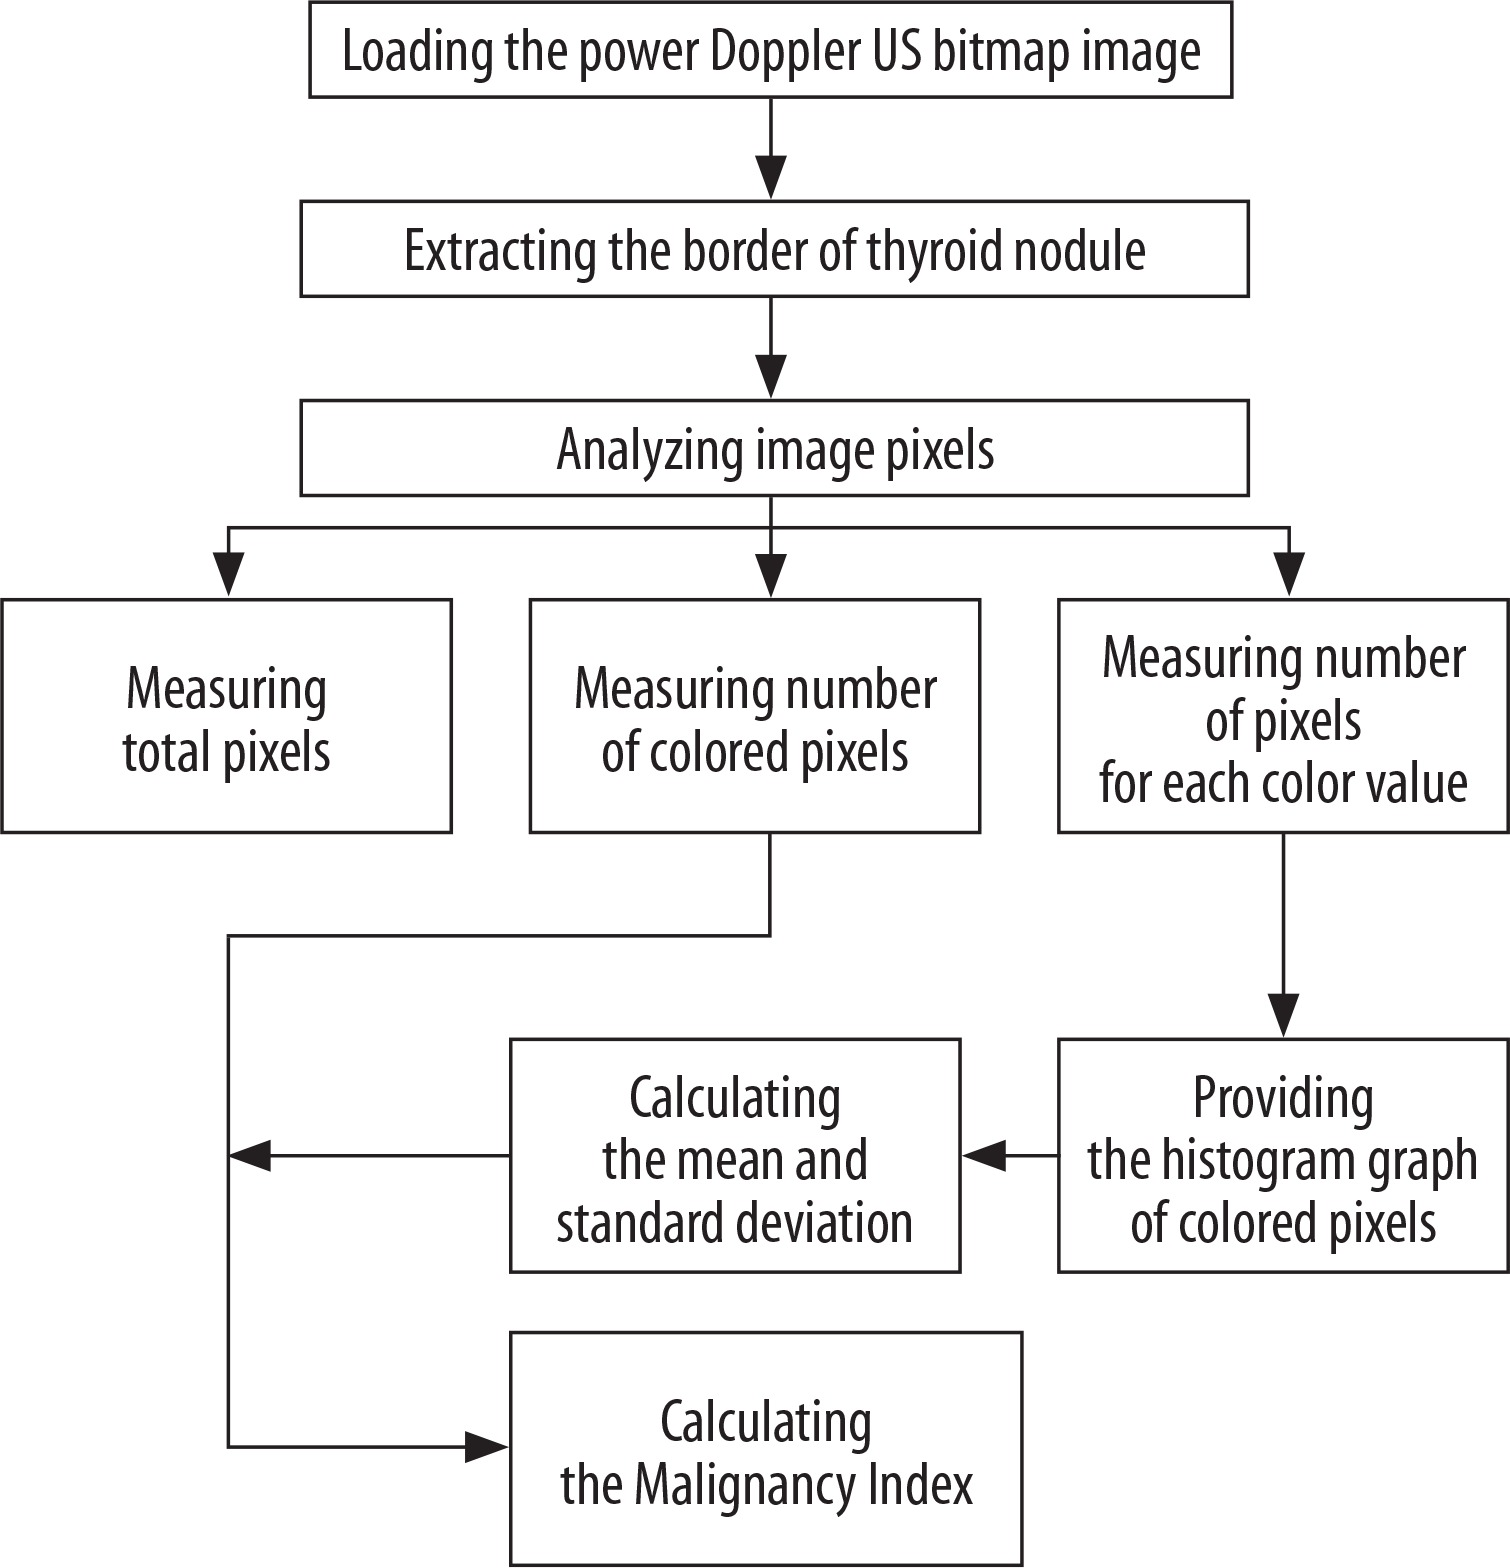
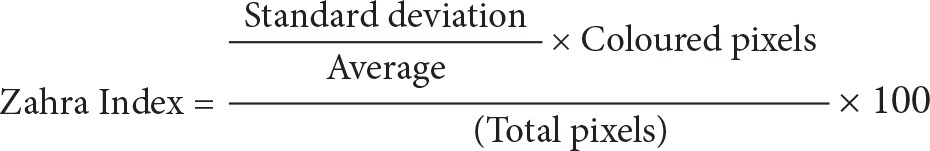
Step one: Loading the power Doppler US bitmap image and extracting the border of thyroid nodule by manually drawing a region of interest; Step two: measuring total pixels, number of coloured pixels, and number of pixels for each colour in the thyroid nodule; Step three: providing the histogram graph of the coloured pixels (Figure 3) and calculating the mean and standard deviation; Step four: calculating the Malignancy Index to identify the probability of malignancy for each thyroid nodule as defined below:
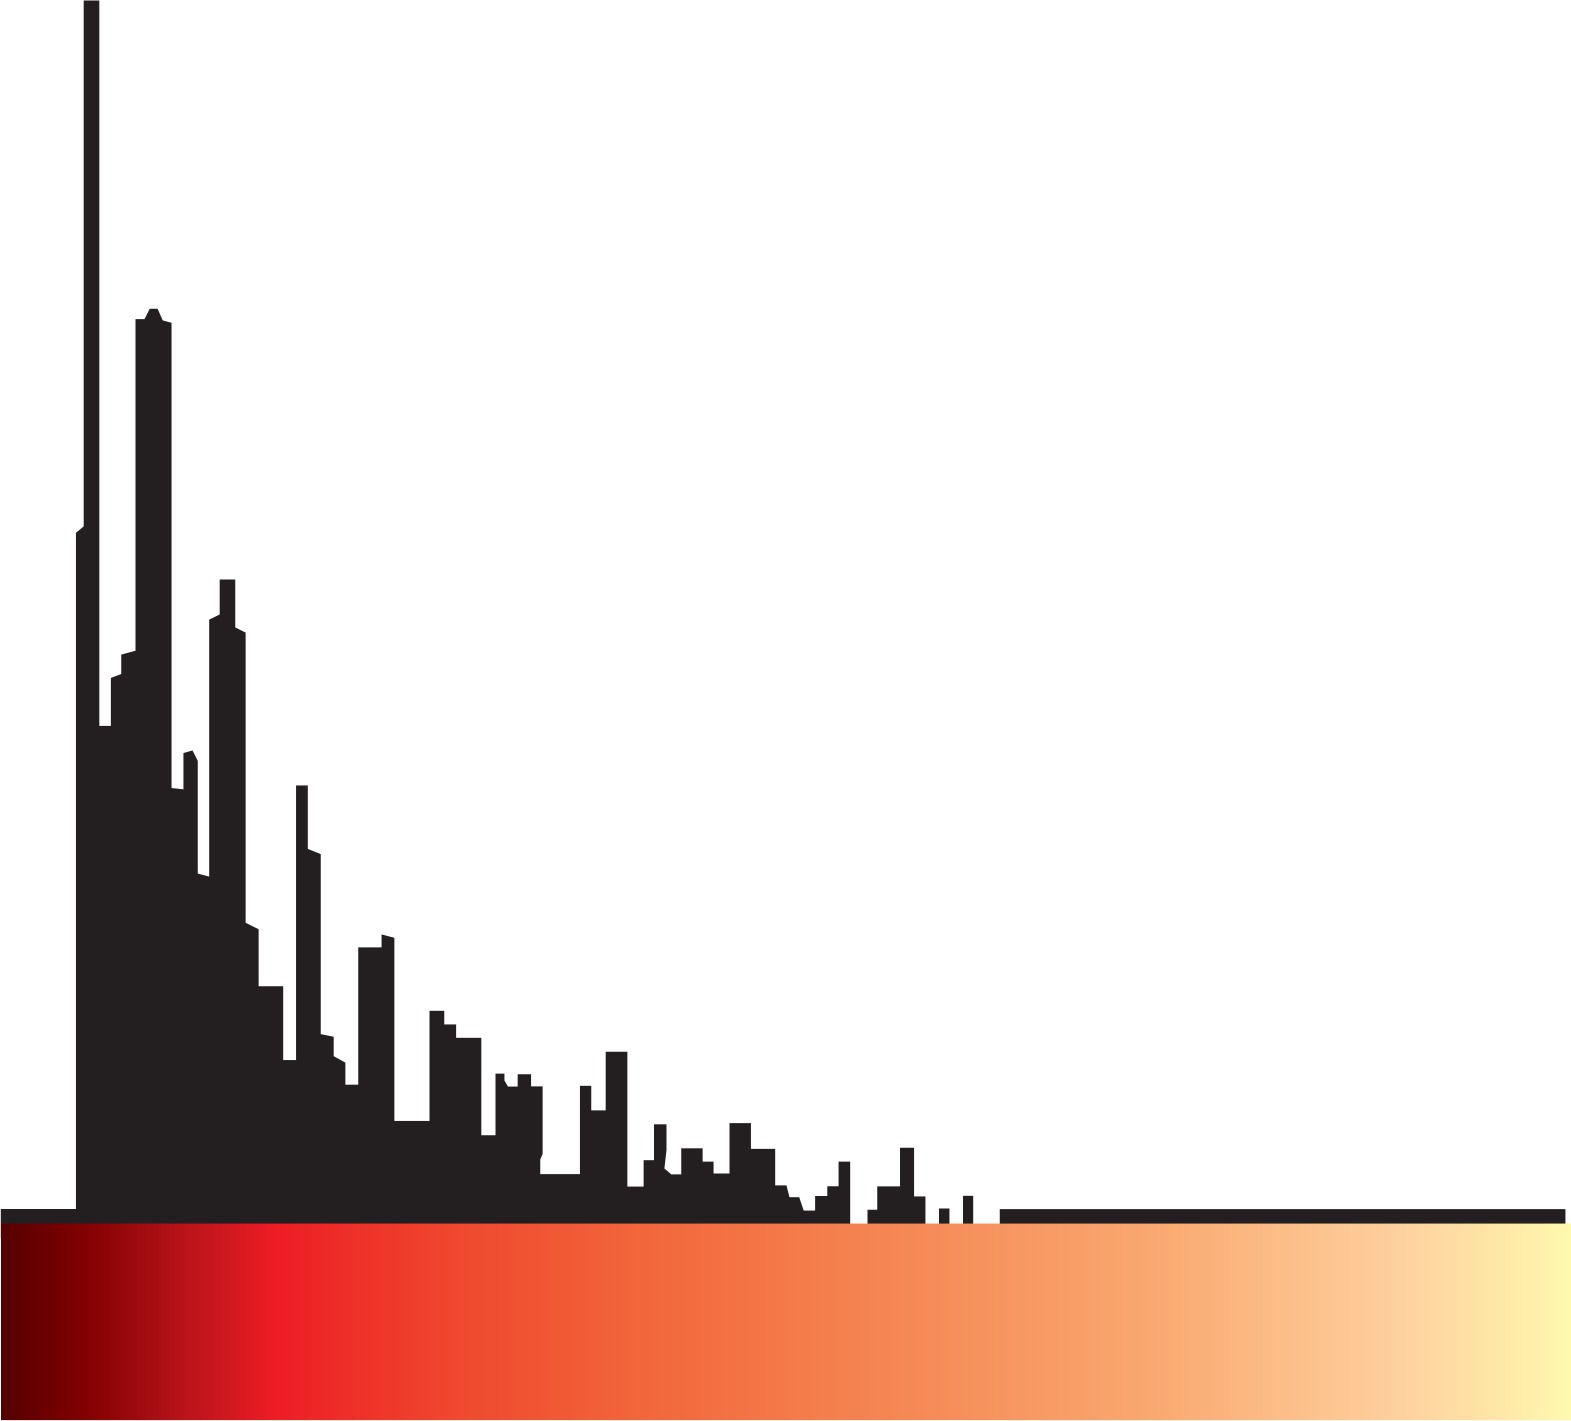
The flow speed in power Doppler images is shown as colour dots (pixels). The colour spectrum consisted of 128 different colours, and each speed was designated as one colour. We then drew a histogram for each nodule, with the horizontal axis showing the speed of the flow in the nodule as showed in the power Doppler image, and the vertical axis showing the number of coloured dots or pixels corresponding to that speed. By having the histogram for each nodule, we determined the mean and standard deviation of the flow speed and calculated the malignancy index (Zahra Index) based on these numbers and other parameters that we extracted from the power Doppler images.
Statistical analysis
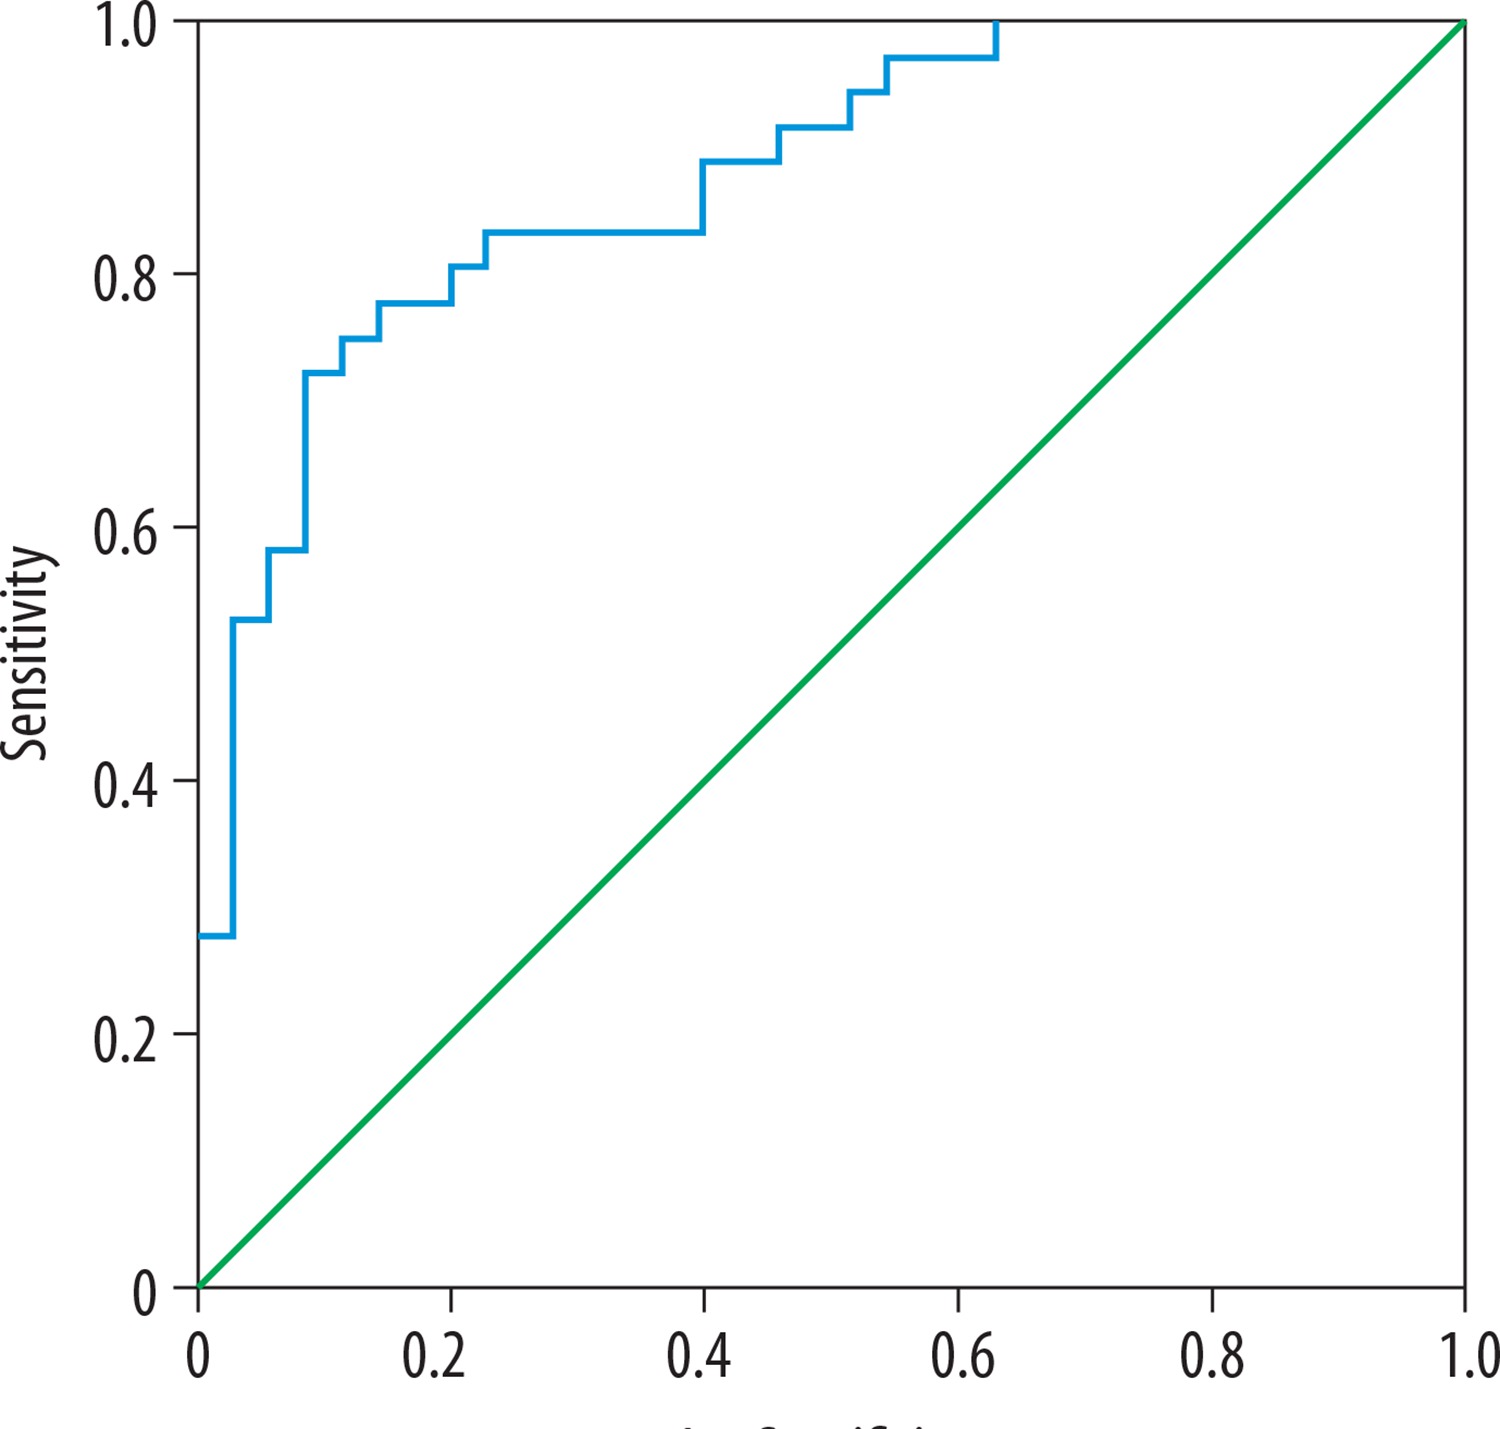
Receiver operating characteristic (ROC) plots were used to illustrate the sensitivity versus specificity for all possible cut-off values. The area under the curve (AUC) was calculated as a measure of test accuracy to distinguish malignant tumours from benign nodules. All data analyses were performed using SPSS (Version 21.0; IBM SPSS Corporation, Chicago, IL).
Results
Thirty-six nodules (50.7%) were determined to be malignant via FNAB, and 35 nodules (49.3%) were diagnosed to be benign (Table 1). ROC curve analysis found an AUC of 0.91 (95% CI: 0.85-0.98) for PDUS-based malignancy index in distinguishing malignant tumours from the benign ones. All possible cut-off values were assessed in the ROC curve analysis (Figure 4). The best trade-off point between sensitivity and specificity was a malignancy index of 0.092, showing a sensitivity of 86.1% (95% CI: 70.5-95.3%) and specificity of 80.0% (95% CI: 63.0-91.5%). The positive predictive value, negative predictive value, and diagnostic accuracy were 81.5% (95% CI: 69.2-89.7%), 84.8% (95% CI: 71.0-92.8%), and 83.1% (95% CI: 72.3-90.9%), respectively.
Discussion
Because of the high prevalence of thyroid nodules, especially in iodine-deficient areas, it is essential to find accurate and cost-effective ways of identifying high-risk thyroid nodules according to ultrasound features. By using advanced ultrasonographic devices, ultrasonography is now highly sensitive in determining the size and the number of the thyroid nodules. However, it still cannot reliably distinguish a malignant nodule from a benign one.
Ultrasonographic features such as hypoechogenicity, microcalcifications, intranodular vascularity, and the lack of halo margins are shown to be associated with the presence of malignancy in thyroid nodules [10-13]. However, these ultrasonographic features had relatively low sensitivity in identifying patients that indicate an invasive procedure such as FNAB [14-17].
Studies have shown that the nodules with a predominantly peri-nodular vascular pattern have a lower risk of malignancy than nodules with an exclusively central vascular pattern. Moon et al. [17] demonstrated that among ultrasonographic features of thyroid nodules, intra-nodular vascularity can predict the risk of malignancy more accurately than other ultrasonographic criteria. Ultrasound criteria, consisting of “taller than wide” shape, spiculated margin, marked hypoechogenicity, microcalcification, and macrocalcification, were reported to have a diagnostic accuracy of 77% in identifying malignant nodules when at least one US feature of malignancy was present [18]. The low accuracy observed in that study may be attributed to the absence of intra-nodular vascularity in the diagnostic criteria.
The PDUS-driven index of vascularity, a.k.a. malignancy index, had high performance in this study in differentiating malignant and benign thyroid nodules. Using a cut-off point of 0.092, the malignancy index had a diagnostic accuracy of 83%, and both the sensitivity and specificity were higher than the rates reported before in the literature for ultrasonographic parameters [18].
FNAB has been accepted as the gold standard test in the diagnosis of nodular thyroid disease, and FNAB under ultrasound guidance has a sensitivity rate of up to 100% in identifying malignant nodules [19]. Despite the high accuracy, the procedure is invasive and painful. PDUS-driven malignancy index can identify those with a higher risk of malignancy in thyroid nodules and can minimise the number of patients who require further testing with invasive FNAB.
There are a few limitations to mention here. A twodimensional PDUS approach was applied in this study because we wanted the diagnostic test to be feasible in almost every setting. Several studies have shown the advantages of using a 3D system because it visualises the whole lesion instead of applying limited transverse and longitudinal planes with two-dimensional ultrasound [20,21]. Testing this index in future in 3-D PDUS is recommended. Further prospective studies with larger sample sizes are warranted for external validation of this index.
Conclusions
The PDUS-driven malignancy index using contour-finding algorithm software was accurate and reliable in differentiating malignant and benign thyroid nodules. This method may be reliably applied as a pre-FNAB risk stratification tool to minimise the number of invasive procedures in nodular thyroid disease.