


Introductions
Adrenal incidentalomas (AI) are adrenal masses detected on imaging for diseases other than adrenal diseases. AI is detected in 5% of patients undergoing radiological imaging. The incidence of AI is increasing with the further use of radiological imaging in the clinic [1]. The almost guidelines suggest that AIs should be investigated for malign or benign nodules because the most common cause of adrenal masses is metastasis of malignant tumours [2]. This distinction can be made highly accurately with clinical history and conventional radiological imaging. The second most common cause of AIs is adrenal adenomas. If AI exhibits lower density on unenhanced computed tomography (CT) than 10 Hounsfield units (HU), it can be diagnosed with confidence (sensitivity of 71% and specificity of 98%) and is referred to as a fat-rich adenoma. In addition, the adrenal adenoma can be distinguished from malign adrenal masses by showing wash-out on enhanced CT and chemical shift in dual-echo sequences on magnetic resonance imaging (MRI) [3].
The guidelines recommend that adrenal adenoma should be analysed in terms of functionality on the second step duration at diagnosis [2,4]. Adrenal adenomas are divided into subgroups as non-functional AI (NFAI), auto-nomous mild cortisol-secreting AI (ACSAI), aldosteroneproducing adenoma (APA), pheochromocytoma, and adrenal Cushing’s syndrome (ACS) [5]. With conventional radiological imaging, adrenal adenomas are not tested for functionality and cannot be distinguished into subgroups. For this distinction, clinical evaluation and detailed endocrine tests such as 1 mg dexamethasone and 24-hour urine cortisol are required. Due to these laborious tests, the majority of patients refuse further examinations, and the AIs remain indeterminate [2].
Radiomics is the texture analysis of conventional radiological images with specific software and obtaining properties that cannot be detected by the human eye. Virtual tissue analysis can be performed on tumours by using radiomics. Recent studies indicate that distinguishing between malign or benign adrenal nodules is feasible with texture analysis. It has also been established in a few studies that APAs can be detected with high accuracy using radiomics analysis [5-7]. As far as we know, there are no radiomics studies investigating ACS in AIs.
Therefore, the aim of this study was to develop a radiomics signature-based MRI to determine ACS in AIs.
Material and methods
Patient population
All consecutive patients diagnosed with AI on MRI between 2015 and 2021 were included in the study. The inclusion criteria were determined as NFAI or AI compatible with ACS by the endocrinological evaluation, and solid and unilateral features of the adrenal mass. The adrenal lesion was not suitable for segmentation due to respiratory artifacts on MRI, known ACSAI, pheochromocytoma, or APA as exclusion criteria.
The Institutional Clinical Research Ethical Committee approved this single-centre retrospective study. Informed consent was obtained from all patients before all diagnostic procedures according to the 1964 Helsinki Declaration principles.
Endocrinological evaluation
The diagnosis of ACS was made on the basis of biochemical tests including serum cortisol and plasma adrenocorticotrophic hormone (ACTH) levels, urinary free cortisol, and overnight low-dose dexamethasone suppression testing. ACS was diagnosed in the presence of classical clinical signs and symptoms. All patients underwent baseline cortisol, ACTH measurement, and 1 mg overnight dexamethasone suppression test (DST). Patients with NFAI whose cortisol levels were suppressed (≤ 1.8 µg/dl) following the midnight 1 mg DST, with normal 24-hour metanephrine-normetanephrine levels in urine, and plasma aldosterone (ng/dl)/renin (ng/ml/h) ratio < 20 were considered “non-functional”. Interpretation of the 1 mg overnight DST results is based on the guidelines [2].
Magnetic resonance imaging
All MRI scanning was acquired using a 3.0-T MRI (Ingenia, Philips Medical Systems, Netherlands). MRI protocol included T1-weighted (T1W) chemical shift (CS), in-phase (Ip) and pposed-phase (Op) imaging, and turbo spin-echo T2-weighted (T2W) on the axial plane. The specific parameters of MRI were as follows: T1-W chemical shift spoiled gradient echo sequence on the axial plane (TR/ TE = 1500/1.37 and 2.27 ms; slice thickness = 3 mm; interslice gap = 0.6 mm; matrix = 320 × 182; field of view = 400 × 400), half Fourier single-shot turbo spin-echo T2W sequence on the axial plane (TR/TE = 2000/90 ms; slice thickness = 3 mm; interslice gap = 0.6 mm; matrix = 256 × 179; field of view = 400 × 400).
Segmentation and texture analysis
DICOM data was transferred to dedicated software (Olea sphere v.3 SP2, Olea Medical, France) for segmentation and texture analysis of adrenal lesions. The boundaries of the adrenal lesion were manually drawn slice-by-slice on T1W-Ip and T1W-Op imaging and T2-weighted (T2W) images. A volume of interest (VOI) covering the entire lesion was created. The images were normalized using the Z score to eliminate the possible effects of protocol and scan parameters. A total of 111 grey level properties (first and second-order) of the generated VOI were extracted.
Radiomics feature selection
The least absolute shrinkage and selection operator (LASSO) method, proposed by Tibshirani (1996), is a widely used algorithm for the reduction of high-dimensional data and variable selection, especially in radiomics studies in recent years. Basically, LASSO minimizes the regression coefficients of redundant features to determine the best subset of radiomics features.
In this study, a total of 111 features were extracted for each patient based on MRI, and the radiomics feature selection process was carried out using the LASSO method. The LASSO method was combined with logistic regression to select the features most associated with Cushing’s syndrome from 111 candidate radiomics features. The “glmnet” package was used in R software for LASSO logistic regression. First, the LASSO tuning parameter (λ), which gives the maximum area under the curve (AUC) and the minimum cross-validation error, is determined. Using the minimum criteria in 5-fold cross-validation with 100 replications, the value of the optimal tuning parameter that the model best fitted to the data was determined as λ = 0.09749558 in T1W-Op, λ = 0.07921766 in T1W-Ip, and λ = 0.02147446 in T2W. Non-zero radiomics features were selected with the tuning parameter determined in each phase, and the radiomics score was calculated for each patient by a linear combination of the selected radiomics features with their respective coefficients.
Statistical analysis
Categorical variables were expressed as numbers and percentages, whereas continuous variables were summarized as mean and standard deviation and as median and minimum-maximum where appropriate. The chi-square test was used to compare sexes between the groups. The normality of distribution for continuous variables (age, radiomics scores) was confirmed with the Shapiro-Wilk test. For comparison of continuous variables between 2 groups, Student’s t-test or the Mann-Whitney U test was used depending on whether the statistical hypotheses were fulfilled. The distribution of radiomics scores in the study groups is shown with the violin (violin) graph. The „ggplot2” package was used for violin plots. The performance of radiomics scores was evaluated by receiver operating characteristic (ROC) curve analysis and performance measures (area under the curve-AUC, sensitivity, specificity, accuracy) were obtained. The best cut-off point was determined according to the IU method [8].
The resulting AUCs were compared using DeLong’s test. The statistical level of significance for all tests was 0.05. The statistical analysis was performed using R software version 3.3.2 and IBM SPSS Statistics version 20.0.
Results
A total of 50 patients with AI were included in this study. There were 16 patients in the ACS group, including 15 (93.8%) males and one (6.2%) female, with mean age 59.7 ± 10.7 years (median, 61.0 years). There were 34 patients in the NFAI group, including 19 (55.9%) males and 15 (44.1%) females, with mean age 47.8 ± 14.1 years (median, 58.0 years). There were no significant differences in age (p = 0.325) between the 2 groups but a significant difference in sex (p = 0.019).
According to 5-fold cross-validation, 111 extracted features were reduced to 5, 5, and 12 potential predictors for T1W-Op, T1W-Ip, and T2W radiomics score construction, respectively, using the LASSO logistic regression model. Details of the selected features are shown in Table 1, and the distribution of the radiomics scores is given in Figure 1.
Figure 1
Distribution of radiomics scores, Waterfall plot. Grey bars show radiomics scores for patients with adrenal cushing syndrome (ACS); green bars show radiomics scores for patients with non-functional adrenal incidentaloma (NFAI). T1W –T1-weighted, Op –opposed-phase, Ip – in-phase, T2W – T2-weighted
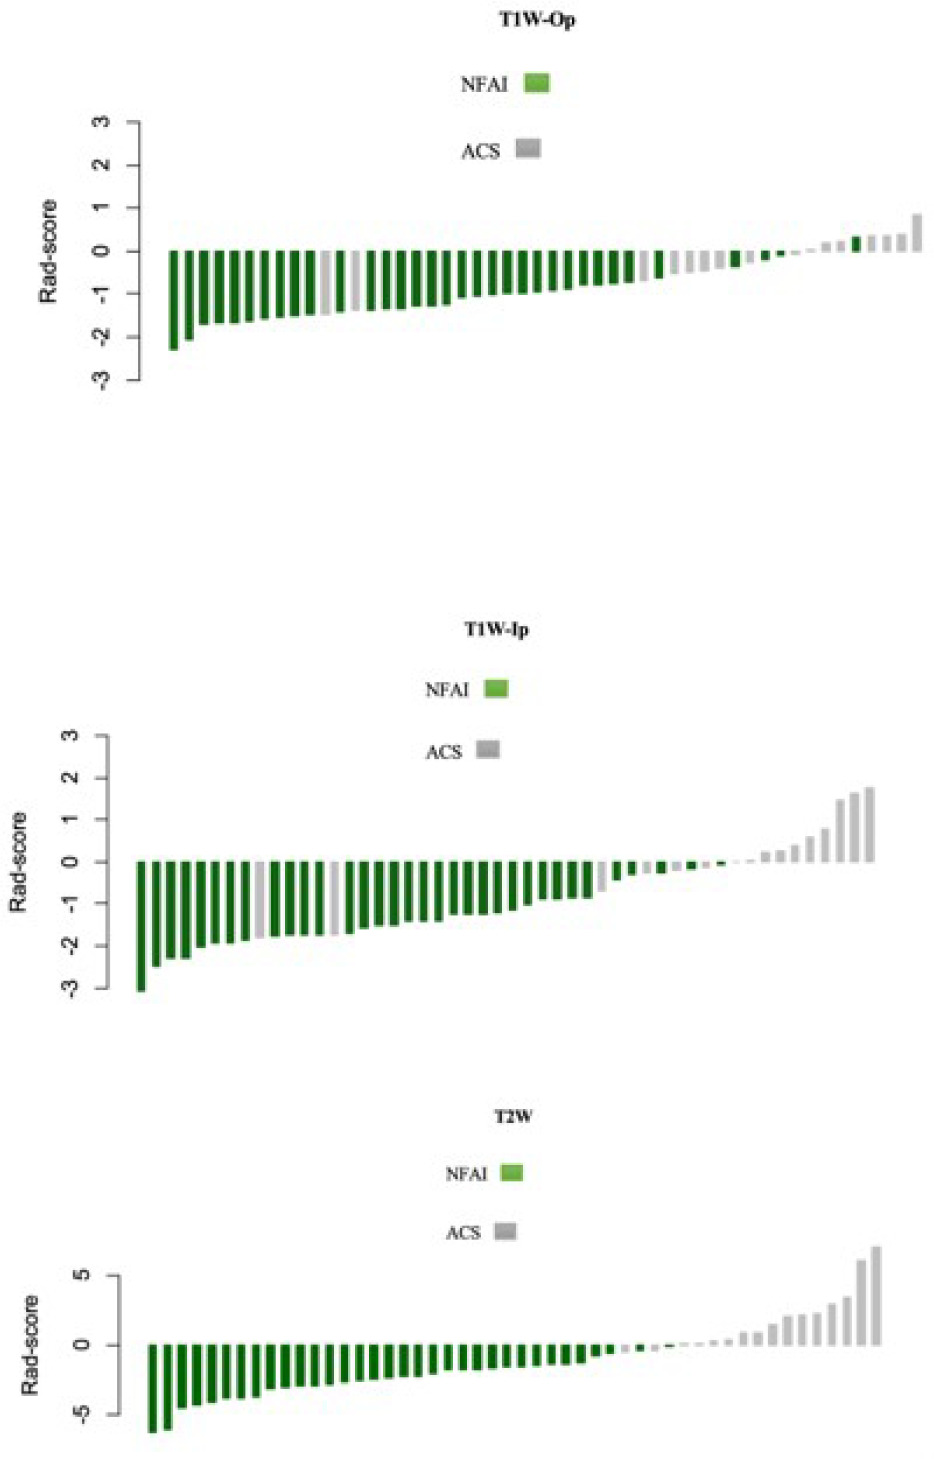
Table 1
Selected features for the T1-weighted opposed-phase (T1W-Op), T1-weighted in-phase (T1W-Ip), and T2-weighted (T2W) phase
The median radiomics scores in T1W-Op for the NFAI and ACS were –1.17 and –0.17, respectively (p <0.001). Patients with ACS had significantly higher radiomics scores than NFAI patients in all phases (p < 0.001 for all) (Table 2).
Table 2
Radiomics score distributions between the groups
Table 3, Figure 2, and Figure 3 show the diagnostic performance of the radiomics score in discrimination between NFAI and ACS. The AUCs for radiomics scores in T1W-Op, T1W-Ip, and T2W were 0.862 (95% CI: 0.742-0.983), 0.892 (95% CI: 0.774-0.999), and 0.994 (95% CI: 0.982-0.999), respectively. The performance of the radiomics score in T2W was significantly higher than in T1W-Op (p = 0.028). In addition, the radiomics score in T1W-Ip showed similar discrimination performance as the radiomics scores in T1W-Op and T2W (p = 0.195, p = 0.086, respectively). Although the AUC values of T1W-Ip and T2W were similar, the sensitivity and specificity were higher in T2W (Figure 3).
Figure 2
The receiving operating characteristics curves of the radiomics score on T1-weighted opposed-phase (T1W-Op), T1-weighted in-phase (T1W-Ip), and T2-weighted (T2W). ACS – adrenal Cushing syndrome, NFAI – non-functional adrenal incidentaloma
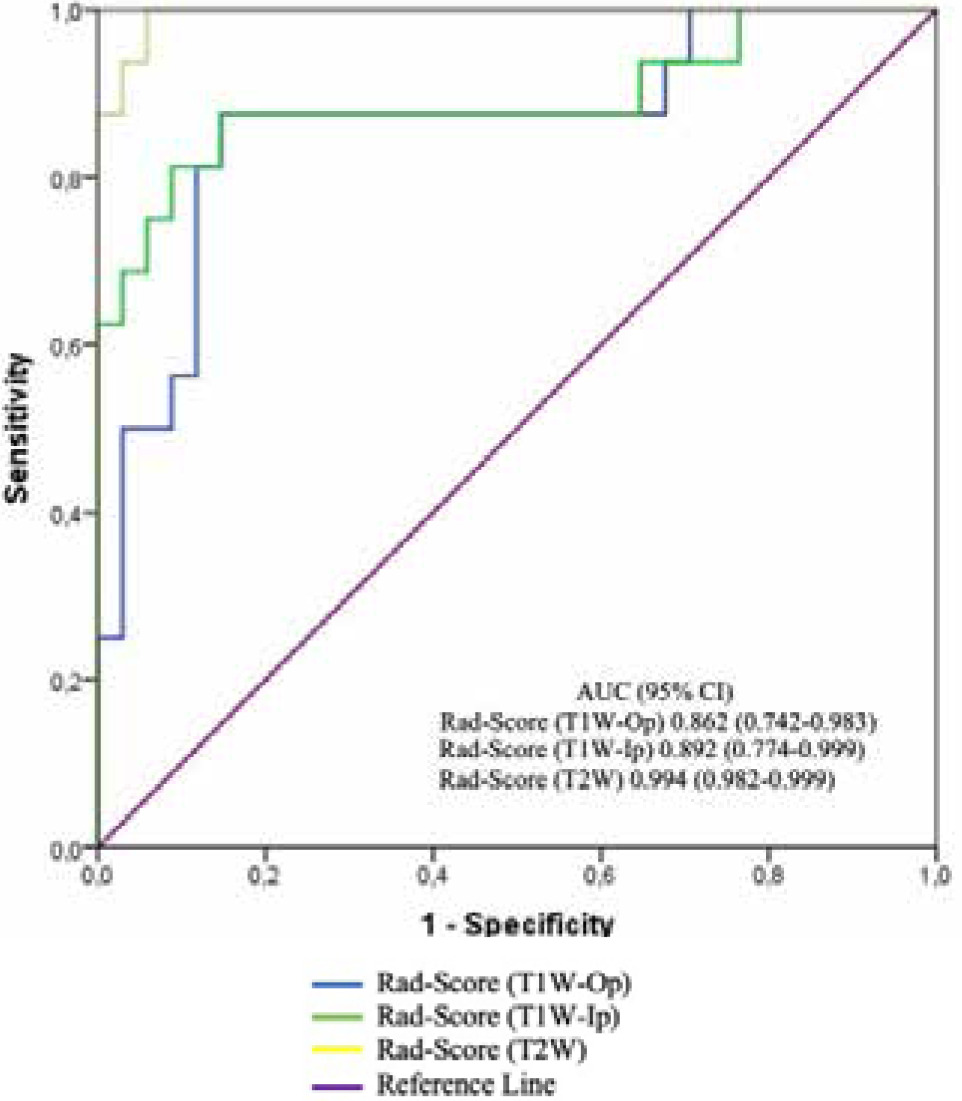
Figure 3
A-C. Performance of radiomics score in discriminating adrenal Cushing syndrome (ACS) for 3 phases. Grey circles represent patients. The dashed lines indicate the cut-off value of the radiomics score. Patients above the threshold line were classified as ACS, while patients below the threshold line were classified as non-functional adrenal incidentaloma (NFAI). T1W – T1-weighted, Op – opposed-phase, Ip – in-phase, T2W – T2-weighted
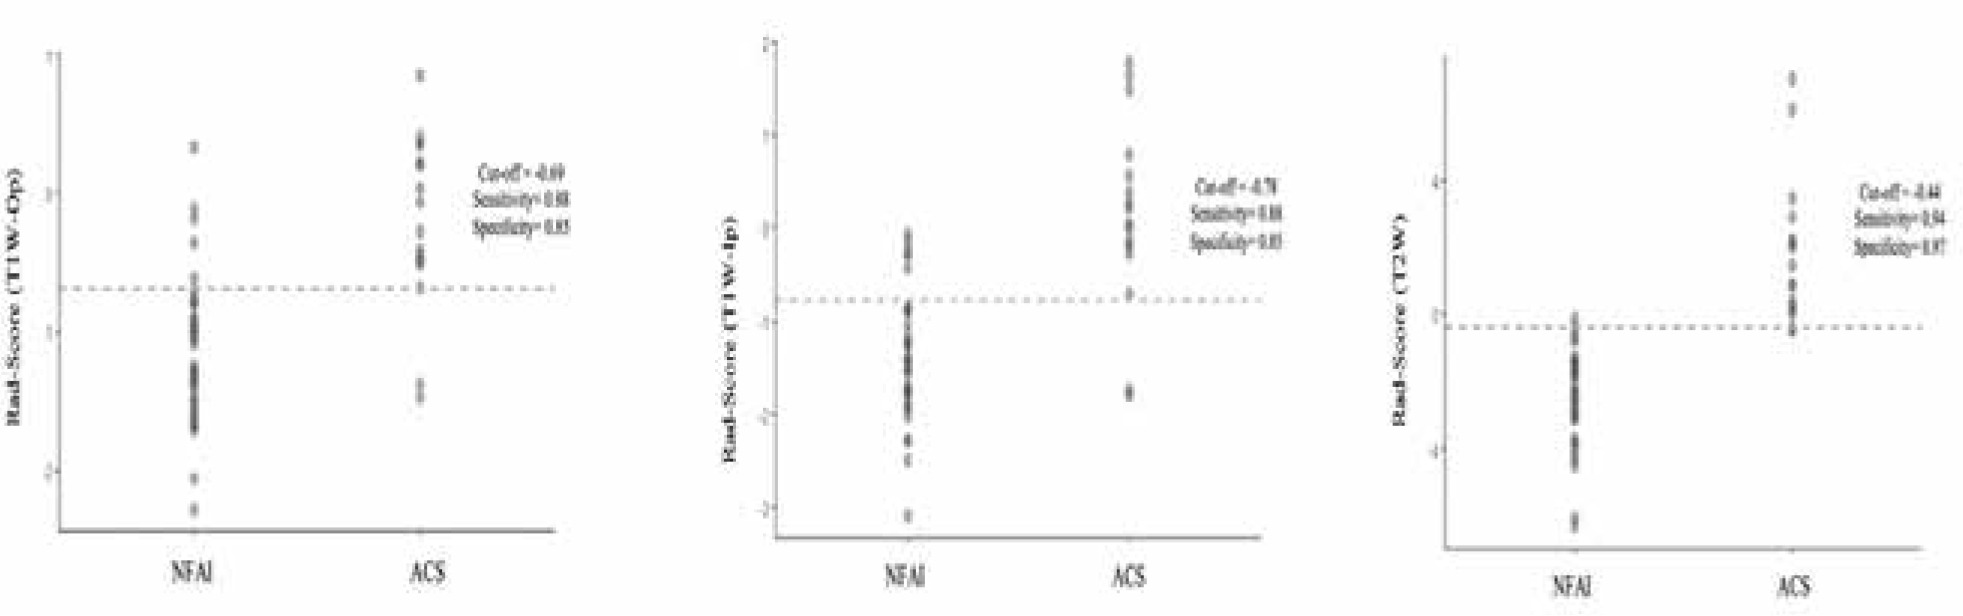
Table 3
Predictive performance of the radiomics scores
Discussion
ACS is associated with poor quality of life, morbidity, and 5-fold higher mortality. The patients may present with central obesity, thinned skin with wide purple striae, fatigue, proximal muscle weakness, hypertension, glucose intolerance, acne, and hirsutism [9]. Because manifestations of ACS are variable, the diagnosis may be challenging when signs and symptoms are subtle. And symptoms may overlap other systemic diseases such as diabetes mellitus or hypertension. When ACS is clinically suspected in AI, biochemical tests are needed to establish the presence of cortisol excess. The screening tests include 24-hour urinary-free cortisol, 1 mg overnight dexamethasone suppression, and late-night salivary cortisol level, which refer to excessive cortisol secretion in a 24-hour period. These tests are the high sensitivity and specificity gold standard for diagnosis [2]. However, due to the long duration and cost, patients can leave the process halfway through without a diagnosis [1,10]. In conventional radiological evaluation, the separation of adenoma and non-adenoma is performed with high sensitivity and specificity with signal intensity measurement and calculations in MRI. However, it cannot be ascertained whether there is hormone secretion [11]. There is a need for cheaper and simpler tests of applicability in this area. The presented study shows that ACS could be well predicted using the radiomics score approach in AIs. In other words, the radiomics signature alone performed powerfully in classifying AIs.
Radiomics has developed rapidly in endocrine neoplasm practice in the past decade. In endocrine tumours such as pituitary adenoma, thyroid nodules, and pancreatic neuroendocrine tumours, radiomics has been tested in many areas such as diagnosis, prognosis determination, and recurrence [12,13]. The application of radiomics in the adrenal gland is rarely reported [5,7].
Yu et al. evaluated the use of texture analysis for diffe-rentiation between benign and malignant adrenal lesions on contrast-enhanced abdominal CT. When analysing the texture, they only tested the parameters of the first order. They found that entropy and standard deviation demonstrated AUCs ranging from 0.91 to 0.97 for discriminating tumours, with sensitivities and specificities ranging from 73% to 95%, respectively [7]. In the presented study, a more complex texture analysis including first and second order was performed. Although the first order is a simpler texture analysis application, we think that more detailed information about texture can be obtained with second-order and high-order analyses.
Romeo et al. assessed the diagnostic efficacy of texture analysis extracted from MRI including T2W, T1W-Op, and T1W-Ip for characterizing AI (adrenal adenoma vs. non-adenoma). They obtained a diagnostic accuracy of 80% [14]. Similarly to Romeo et al., the unenhanced MRI sequences (T1W and T2W) were used in the presented study. This is especially important for patients with impaired renal function due to the effects of hypercortisolism. Moreover, it provides an advantage in terms of cost. These sequences are traditional images, which can be achieved in a short time. The AUC of the radiomics score in T2W was increased to 0.994 compared to other phases of the study. However, to reach a definite conclusion, the most suitable sequences for texture analyses should be tested in future studies.
He et al. developed a clinical-radiomics on CT nomogram for the preoperative prediction of the APA risk in patients with unilateral adrenal adenoma. The nomogram showed good discrimination (AUC: 0.912) between NFA and APA [15]. In the presented study, the AUC of radiomics score to predict ACS was 0.994 (95% CI: 0.982-0.999), with a sensitivity of 0.94 and a specificity of 0.97. The clinical features did not use for the radiomics model, the use of additional clinical and laboratory parameters along with radiomic features may lead to better classification.
Zheng et al. explored the application value of multiparametric CT radiomics in differentiation between APA and cortisol-producing functional adrenocortical adenomas. ACSAI and ACS were placed in the same group [16]. A radiomics model yielded a sensitivity of 0.935, a speci-ficity of 0.823, and an accuracy of 0.887 (AUC: 0.882, 95% CI: 0.819-0.945). They constructed a nomogram that achieved good discrimination performances, yielding a sensitivity of 0.915, a specificity of 0.928, and an accuracy of 0.922 (AUC = 0.902, 95% CI = 0.822-0.982). The nomogram included morphological radiologic features such as contralateral adrenal size [16]. In the presented study, morphological radiologic features were not used, to reduce subjectivity.
The limitations of this study are the small sample size (especially the number of Cushing syndrome cases was limited) and the single-centre nature of the study. Therefore, validation by multicentre prospective studies is required prior to its wide use in clinical practice. Another limitation is that interobserver reproducibility in feature extraction could not be evaluated because only one radiologist was used to evaluate the images.