


Introduction
Hepatocellular carcinoma (HCC) is the most common primary liver malignancy and a leading cause of cancer-related death [1]. HCC is an extremely heterogeneous disease, and intratumour heterogeneity is a recognised fact within each specific tumour. Heterogeneity could involve molecular, morphological, and immunohistochemical characteristics.
The pathologic classification of HCC is based on the degree of cellular difference. The cancer tissue of two different histological grades may be present in the same tumour. Intratumor heterogeneity of HCC has a prognostic value [2].
It is hard to survey intra-tumoural heterogeneity with conventional testing or biopsy because it is difficult to cover the full degree of phenotypic or hereditary variety inside a tumour. Imaging modalities such as X-ray, ultrasound (US), computed tomography (CT), magnetic resonance imaging (MRI), and positron emission tomography (PET) show a good and non-intrusive technique for evaluating the heterogeneity inside a tumour. A limitation that applies to all imaging modalities is that the image interpretation is based on a visual process. However, there are features within each image that may not be appreciated readily by the naked eye [3].
Recently, there has been extensive effort in the medical imaging community to obtain correlations between imaging features and tumour heterogeneity; an approximation for this concern is radiomics, which is a new technique that depends on the extraction of more data from biomedical images that cannot be investigated by the naked eye. This term was used for first time by Lambin et al., who investigated quantitative image analysis such as texture analysis to assess tumour heterogeneity [4]. Several studies demonstrated a promising role for radiomics in cancer diagnosis, staging, and treatment assessment [5,6].
No standardisation has yet been developed for radiomics. Radiomics features are variable through many factors such as scanners, test-retest, observers, segmentation methods, and image reconstruction [7-9]. In addition, the mode of imaging may have an influence on radiomics. Texture analysis was performed in 2D mode. However, the advancements in 3D information acquisition and the high spatial resolution allow better capture of tissue properties [10]. Few studies have looked at the differences between radiomics or textural features in 3D and 2D modes utilising MRI or CT [11,12]. Ortiz-Ramón et al. introduced a radiomics approach on MRI of cancer lesions including lung cancer and melanoma [13].
The aim of our work was to evaluate the correlation of 2D and 3D radiomics and metabolic features of hepatocellular carcinoma with tumour diameter, staging, and metabolic tumour volume.
Material and methods
Patients
This retrospective study included 33 consecutive patients with HCC proven by histopathology (29 males and 4 females) between November 2016 and April 2018. Patients were referred to our department primarily to investigate the extra-hepatic disease before starting an appropriate management plan. The average age was 57.7 years (range 39-77). Disease stage was assigned by a tumour board committee and based on the American Joint Committee on Cancer (AJCC) cancer staging manual 2017 [14]. The primary HCC was diagnosed by histopathology, the nodal and metastatic disease was established with reference to dedicated imaging, histopathology/histocytology of suspicious lesions when indicated to change line of management as well as the clinical assessment and follow-up. After staging, patients were referred to a multidisciplinary HCC panel including an oncologist, surgeon, hepatologist, and interventional radiologist. The management plan was implemented based on the Barcelona Clinic Liver Cancer (BCLC) system and its updates, which incorporates tumour morphology, liver function, and health performance status along with treatment-dependent variables [15,16].
The study was approved by the institutional review board (IRB), and informed consent was waved.
Imaging techniques
The study was performed using a PET/CT scanner (Siemens Biograph 128-mCT). The patients were positioned in the PET/CT scanner approximately after injection of FDG intravenously the patients injected according to their weight by 0.1 mCi or 3.7 MBq for each kg. A non-contrast CT scan was acquired from the base of the skull to the upper high region and used for attenuation correction. Images size was 200 × 200 pixels; slice thickness = 1 mm.
Image processing and analysis
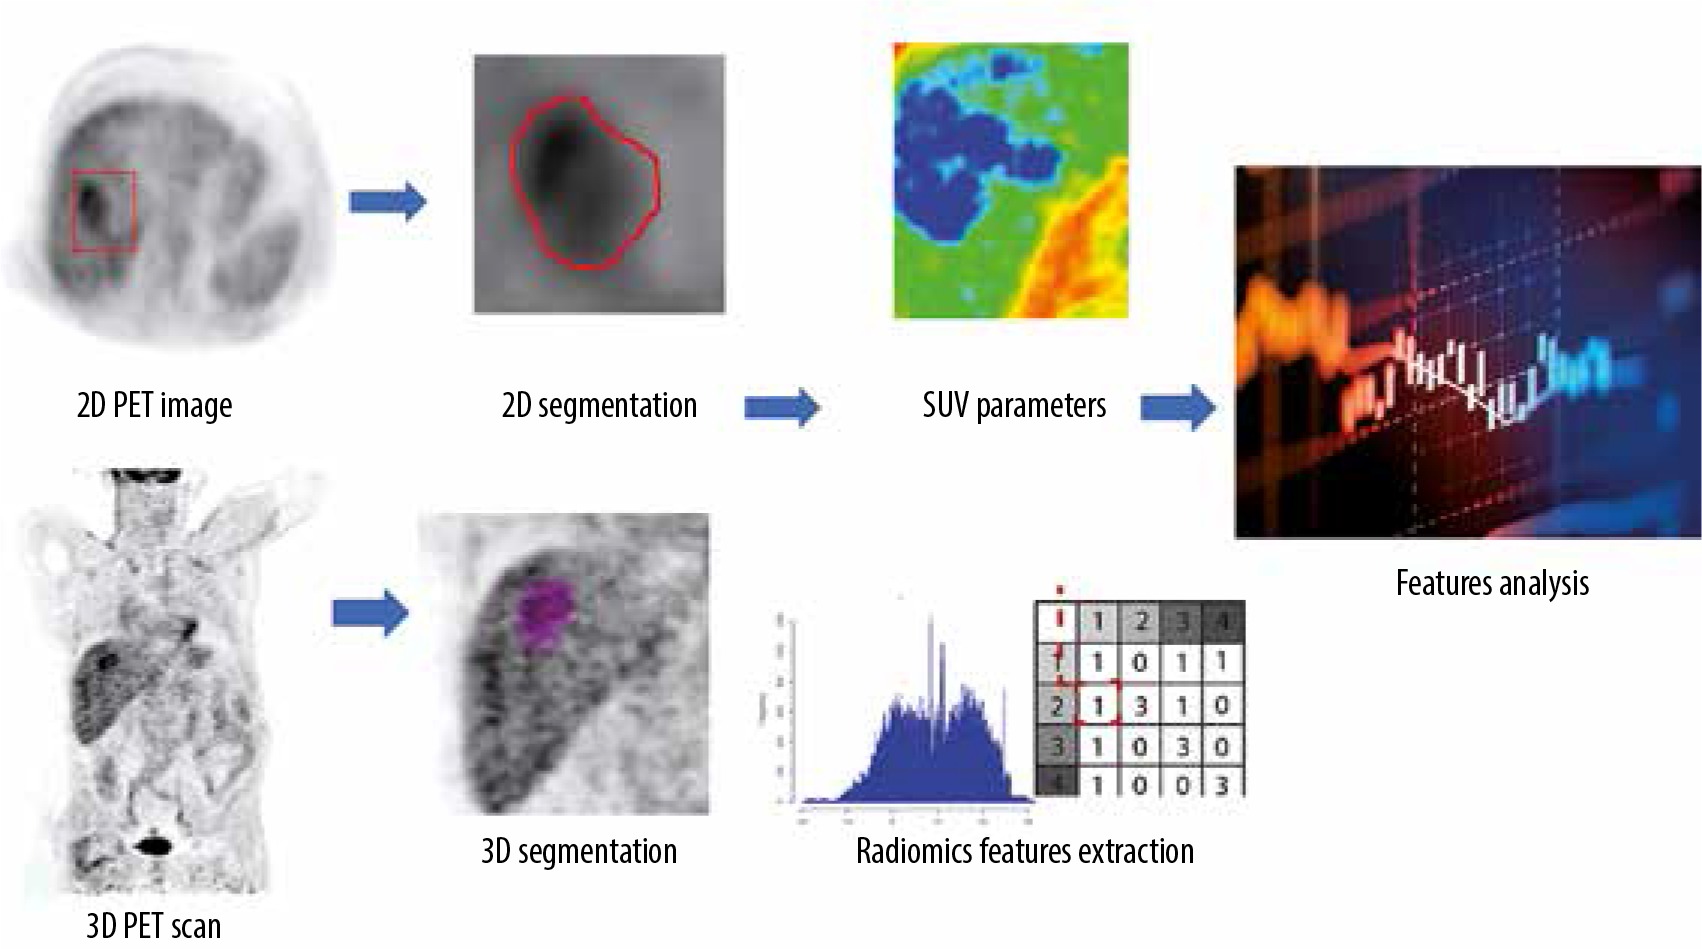
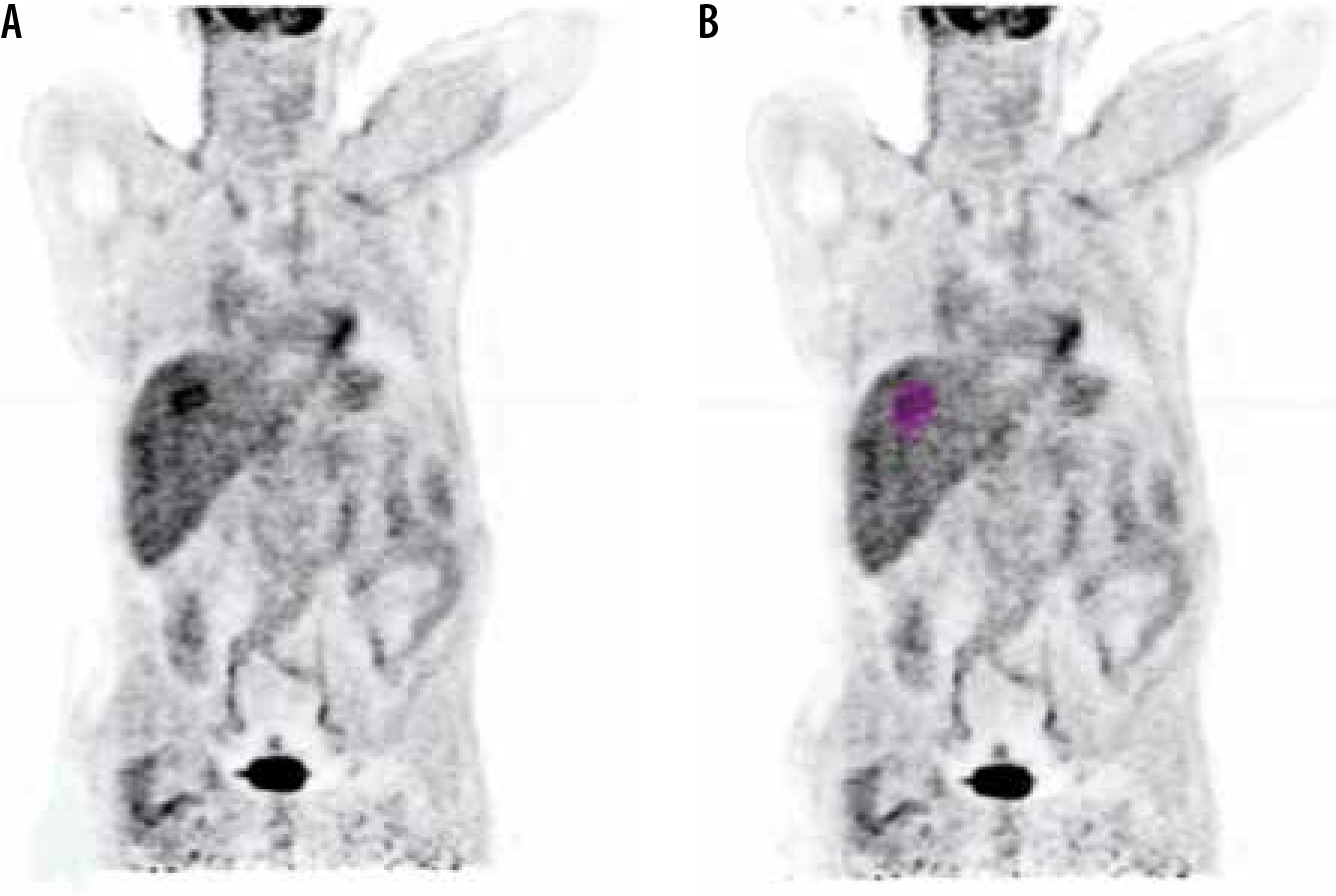
Imaging interpretation and analysis were performed and revised by a qualified radiologist with 15 years’ experience in reading PET/CT. The tumours were segmented from the PET images after CT correction, using a semiautomatic method by ITK-snap software version 3.6.0 in 2D mode. In 3D mode the Pet scan segmented directly using a semiautomatic method in LIFEx package version 4.0.0 (https://www.lifexsoft.org/) [17]. The metabolic parameters and texture features were extracted using the LIFEx package. Figure 1 shows a diagram of the workflow of radiomics extraction, and Figure 2 shows a PET scan before and after delineation in the LIFEx package.
Metabolic parameters
The standardised uptake value (SUV) is defined as the tissue concentration of tracer, as measured by a PET scanner, divided by the activity injected divided by body weight [18]. There are many parameters related to SUV that can be useful for cancer diagnosis and staging.
SUVmax: The maximum SUV value at the region of interest, which is the commonly used SUV clinically; however, some works show that another SUV factor can give a global view for tumours, such as metabolic tumour volume (MTV) and TLG.
SUVmean: The average SUV value at the region of in-terest.
SUVmin: The minimum SUV value at the region of interest.
Metabolic tumour volume (MTV): Measures the active volume in ml.
Total lesion glycolysis (TLG): Is defined as the product of SUVmean and MTV [19].
Intra-tumour heterogeneity
The 18F-FDG uptake heterogeneity was estimated using the coefficient of variation (COV), defined as the ratio between the standard deviation of SUV values and the mean SUV value within the delineated MTV [20].
SUV parameters are referred to as usual metabolic parameters; MTV and TLG are referred to as global metabolic parameters [21].
Texture features
Thirty-five radiomics features are studied. Histogram indices derived after determination of bin width; the grey level co-occurrence matrix (GLCM) takes into consideration the arrangements of pairs of voxels to calculate textural indices, and the neighbourhood grey-level different matrix (NGLDM) corresponds to the distinction of grey-level between one voxel and its 26 neighbours in 3 dimensions. The grey-level run length matrix (GLRLM) provides the scale of consistent runs for every grey-level. The grey-level zone length matrix (GLZLM) provides data on the scale of consistent zones for every grey-level in 3 dimensions.
Table 1 summarises all of the different features included in this study. More details about the radiomics features used in this study can be found at: https://lifexsoft.org/index.php/resources/19-texture/radiomicfeatures?filter_tag[0]=.
Table 1
Summary of the features included in this study
Statistical analysis
A paired t-test was used to obtain the differences between the metabolic and radiomics features in 3D and 2D mode, and then the Spearman correlation coefficient was calculated to study the relationship between metabolic and radiomics features and the tumour staging, diameter, and metabolic volume. All statistical tests were calculated using Origin lab software version 6 and IBM-SPSS version 19.
Results
SUV values (SUVmax, SUVmean, and MTV) were compared between the LIFEx package and an approved software: Siemens Syngo trueD. An independent t-test for the values in both software calculated to measure the differences between the values. SUVmean was the most stable feature between the two software packages, with a significance level (ρ) = 0.91, where MTV and SUVmax gave (ρ) = 0.87 and 0.61, respectively. There was no significant difference between the two software packages, as shown in Figure 3.
Figure 3
Show a box plot of metabolic parameters in Siemens vs. LIFEx software. A) Metabolic tumour volume (MTV) in both software. B) A SUVmax and SUVmean in each software

The variations between SUV parameters, except SUVmin, and 20 radiomics features were statistically stable in 3D and 2D modes, as shown in Table 2. Most features had ρ-values higher than 0.05; the most stable in the SUV feature was SUVmean, with ρ = 0.588, while in radiomics features the most stable were GLCM_Contrast and GLZLM_LGZE, with ρ = 0.89 and 0.82, respectively. Around 15 features were significantly different between the 2 modes; the most significant was GLZLM_ZP, with ρ ≤ 0.001.
Table 2
The results of paired t-test for metabolic and radiomics features in both 2D and 3D modes; the cells signed with (*) show the significant difference in features between 3D and 2D
Spearman correlation coefficients for both 3D and 2D features with tumour maximum diameter, tumour staging, and tumour metabolic volume are shown in Tables 3 and 4, respectively. Most of 3D mode features showed high correlation with metabolic tumour volume, as shown in Table 3; the strongest correlation of metabolic parameters was found with TLG, with rs = 0.98, and from radiomics features it was GLRLM_RLNU, with rs = 0.97. Considering the 2D mode features, there was no significant correlation between the SUV as well as radiomics features and MTV, AJCC staging, or tumour maximum diameter, where all spearman correlation coefficients were less than 0.3, as shown in Table 4.
Table 3
Spearman correlation coefficient rs and ρ-values for metabolic and radiomics features in 3D mode with tumour metabolic volume, tumour staging, and maximum diameter; cells signed with (*) are medium correlation where cells signed with (**) are high correlation
Table 4
Spearman correlation coefficient (rs) and p-values for metabolic and radiomics features in 2D mode with tumour metabolic volume, tumour staging, and maximum diameter
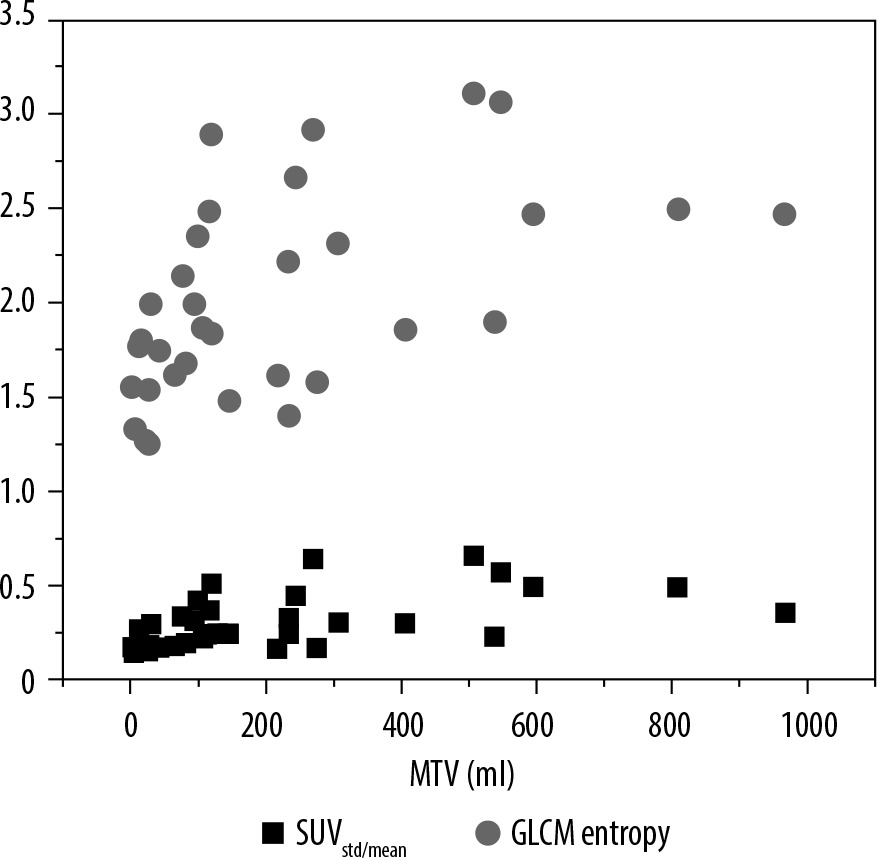
To compare HCC tumour heterogeneity through uptake heterogeneity and radiomics features, the relationship between SUV(std/mean) and GLCM entropy with metabolic tumour volume is shown in Figure 4. The18F-FDG uptake heterogeneity coefficient SUV(std/mean) mean value = 0.304 ± 0.14, and GLCM-entropy radiomics feature mean = 2.016 ± 0.523.
Discussion
Several studies have demonstrated agreement on the usefulness of 18F[FDG]-PET/CT in defining HCC, staging, and treatment assessment; furthermore, some authors reported a high correlation with histopathology results [22-25]. Our study showed that the addition of radiomics features to PET images can provide more information about cancer structure and intratumour heterogeneity.
Comparing the SUV parameters generated by LIFEx, which is an open-source software, with Siemens Syngovia TrueD (commercial software), there was no significant difference between the two software programs. Arian et al. reported differences in SUV parameters through four platforms [26]. On the other hand, Kenny et al. compared SUV parameters through 14 software programs using three phantoms calibrated on 3 PET/CT scanners, and agreement found in some software included Siemens TrueD [27].
In the current work we found that SUVmean and SUV(std/mean) were smaller in 3D than in 2D mode, whereas, SUVmax was little higher in 2D mode than in 3D mode. Kocabaş et al. reported that SUVmax was variable between 3D and 2D modes and the values were smaller in 3D mode [28]. In the current work we found that SUVmean and SUV(std/mean) were smaller in 3D than in 2D mode, whereas SUVmax was a little larger in 2D mode than in 3D mode.
Our study showed a strong correlation of 3D mode features, especially TLG and GLRLM_RLNU with MTV. This strong correlation could be explained by the fact that TLG and GLRLM_RLNU voxel values are not absolute SUV values and depend on the lesion volume. Therefore, it showed a strong correlation with MTV. The lowest correlation of MTV was found with GLRLM_LRLGE. A similar correlation between the same feature and MTV was found by Vicente et al. in the case of breast cancer dual time acquisition PET [29]. GLRLM_LRLGE measures the roughness of the images, which increases when the texture is dominated by long runs that have low grey levels; hence, it may not correlate with volume.
In this study, TLG from metabolic parameters and GLRLM_RLNU from radiomics features demonstrated a strong correlation with maximum diameter of the lesion, with rs = 0.75 and 0.71, respectively. Hatt et al. reported that MTV has a close correlation with tumour diameter in lung cancer [20]. So, the same correlation can be found in the case of TLG because it depends on MTV, and as we mentioned before: RLNU is correlated to MTV and to the diameter. Regarding AJCC staging, some features showed a medium correlation with metabolic and radiomics features; the strongest was GLZLM_GLNU, with rs = 0.4915. Van Go et al. reported a similar correlation between some radiomics features of [18F] (FDG-PET) images and AJCC staging for non-small cell lung carcinoma (NSCLC) [21].
Considering the 2D mode features, there was no significant correlation between the SUV as well as radiomics features and MTV, AJCC staging, or tumour maximum diameter. This may be because the spatial resolution of PET images is low, which does not give strong texture information in small areas [18].
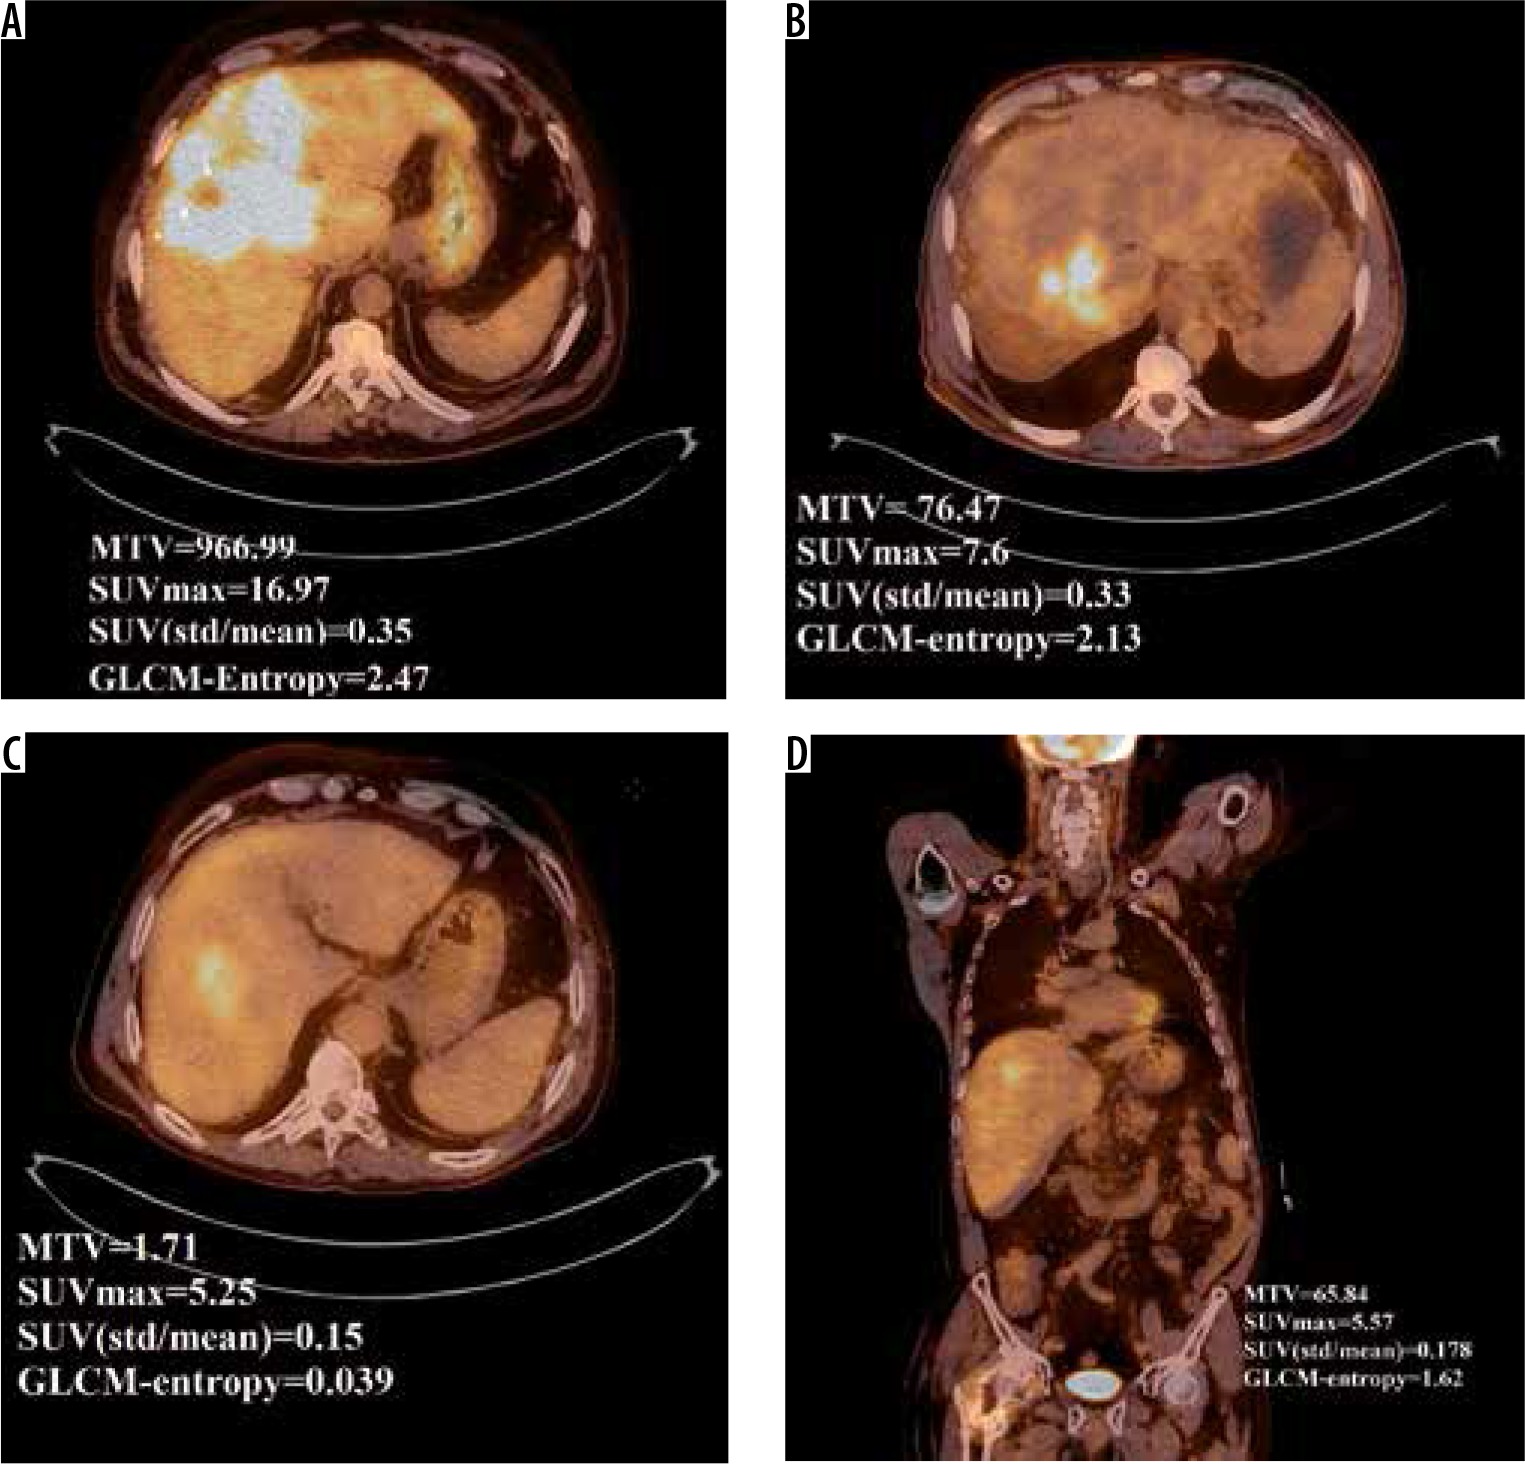
It has been shown that tumour heterogeneity increases with larger tumour volume, as reported by Hatt et al. and Brooks and Grigsby [20,30]. In our cohort we found that some HCC tumours may be more heterogeneous in both uptake and radiomics value without being large in volume, as shown in Figure 5. SUVmax is the commonest parameter used for follow-up; however, it suffers from the fact that it is not correlated to tumour volume and tumour heterogeneity. Figure 5 demonstrates a tumour with high SUVmax, but its textural analysis is less heterogeneous than another tumour with lower SUVmax value. Hatt et al. suggested that GLCM entropy with MTV is lower in the volume range less than 50 cm3 [31]; this finding is in agreement with our study.
Limitations of our study include the relatively small sample size, restricted number of radiomics features, and lack of comparison of the findings with other clinical information such histopathology results. The clinical course of the disease and liver functions have not been compared with radiomics. However, the main focus of this investigation was to improve the performance of FDG-PET/CT in the diagnosis and characterisation of HCC, which will be extended in our future works to incorporate radiomics in clinical practice. Furthermore, there was medical value to our finding: we discovered the best mode for HCC radiomics for use in our future studies.
Figure 5
Comparison between two hepatocellular carcinoma (HCC) tumour parameters. (A) and (B) compare uptake heterogeneity coefficient and GLCM- entropy of two HCC tumours. Although (B) have a higher metabolic tumour volume, it is more homogenous than tumour (A). (C) and (D) compare the parameters for the same patient in 2D and 3D, respectively
Conclusions
The metabolic parameters and radiomics features are variable between 3D and 2D modes. Some SUV parameters and radiomics features are statically stable through 3D and 2D modes. Image analysis in 3D radiomics features is significantly correlated with tumour volume, maximum diameter, and staging, whereas all features in 2D exhibit no correlation. Therefore, in comprehensive studies of intra-tumoral structure, 3D mode features can accurately evaluate tumour heterogeneity.