


Introduction
The 2016 World Health Organization (WHO) classification of central nervous system (CNS) tumors has redrawn the glioma classification on a genetic and morphological basis [1]. Within the same histological subtype of gliomas, the management differs based more on immunohistochemical (IHC) markers than on the WHO grade. Maximal safe resection in the initial surgery continues to be the gold standard for the management of gliomas across all grades, due to a direct correlation of the extent of surgical resection with the overall survival [2]. Because the molecular profile can be revealed only after invasive surgery or biopsy, its preoperative imaging-based prediction plays a vital role in planning the surgical approach [3].
IDH mutation status, one of the earliest molecular markers in gliomagenesis, is probably the most prudent breakthrough in the research and clinical management of gliomas. IDH mutation, a result of missense genetic substitution of histidine over arginine sites, is found in almost all the cell lines of adult gliomas except ependymomas [4]. Multiple studies have demonstrated better survival statistics for patients with IDH-mutated gliomas than their IDH-wild counterparts across all grades and histology. Thus, the IDH mutation is the most critical survival prognosticator, followed by others, like age, tumor grade, etc. The median overall survival is approximately 31 months for IDH-mutated glioblastomas compared to 15 months for IDH-wt [5]. Moreover, the natural history of IDH-wt Grade 2 and Grade 3 gliomas is more analogous to that of IDH-wt glioblastomas [6]. Thus, IDH mutation forms the core component of any optimally working protocol for glioma diagnosis, even in resource-limited settings [7,8].
Conventional computed tomography (CT)- and magnetic resonance imaging (MRI)-based structural imaging methods have been complemented by the advanced MRI sequences in glioma characterization. While the apparent diffusion coefficient (ADC) correlates well with the tumoral cellular density, diffusion tensor imaging (DTI) parameters indicate glioma proliferation with respect to the adjacent nerve fibres, aiding in prognostication in parlance with that of the molecular markers [9]. Multiple perfusion-weighted MRI-based variables denote the flow dynamics and capillary network status and help predict tumor differentiation and genetics [10]. Magnetic resonance spectroscopy (MRS)-based 2-hydroxyglutarate (2-HG) is shown to be an in vivo imaging correlate of the IDH mutation status [11].
We hypothesize that the complementing information from the conventional imaging and the advanced multiparametric MRI, homogenized by numerical scoring, could yield a reliable preoperative diagnostic tool. In this study, we evolved a novel preoperative imaging-based scoring system using both the topographic and quantitative parameters for the prediction of IDH mutation status.
Material and methods
Patients
This prospective observational study was conducted over a 12-month duration in a tertiary care hospital. After obtaining institutional Ethics Committee clearance, we enrolled 58 consecutive consenting patients suspected of having gliomas, who were scheduled for surgery/biopsy, based on their clinicoradiological (prior head CT or MR images) assessment. The patients who had undergone any previous head surgery, biopsy, or chemo/radiotherapy, and those with contraindications to the gadolinium-based MRI contrasts or MRI acquisition were strictly excluded.
Imaging protocol
All the patients were scanned using a DiscoveryTM MR750w 3-Tesla MRI, GE Healthcare (Waukesha, Wisconsin, United States of America) and a 16-channel head coil. The gadolinium-based contrast agent used was gadoterate meglumine (Dotarem, Guerbet GmbH, Sulzbach, Germany) with a dose of 0.1 mmol/kg. The standardized brain MRI protocol consisted of pre-contrast axial-T2WI, FLAIR, DTI, 3D-ASL perfusion, SWI, 3D-T1WI, post-contrast axial-DSC perfusion, 3D-T1WI, and MRS (Table 1). Conscious sedation (intravenous midazolam up to 2 mg) was used to ensure optimal image quality on an as-needed basis.
Table 1
Advanced multiparametric MRI protocol
Image analysis
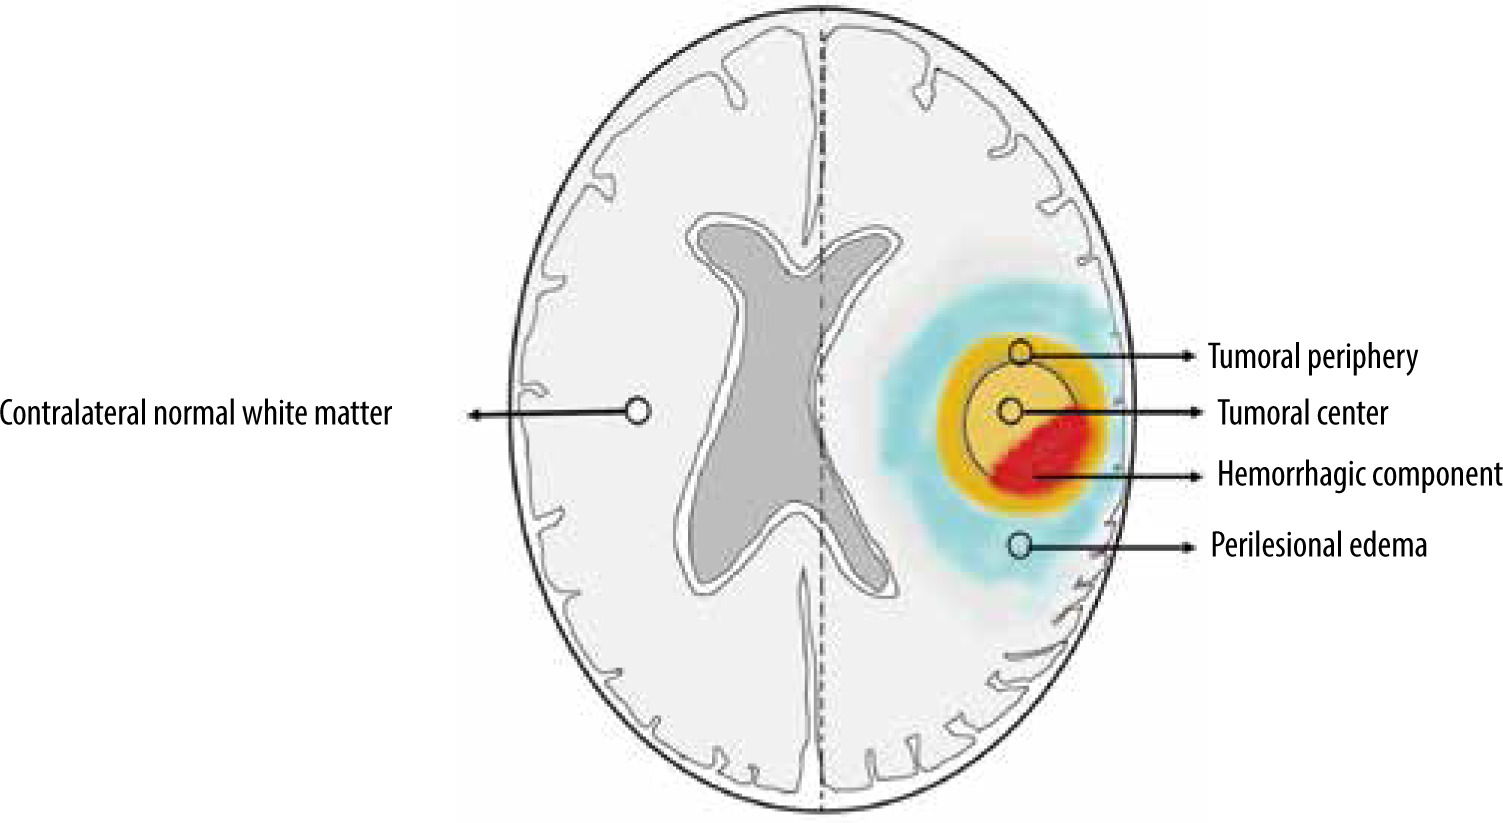
ADC and FA maps from DTI and perfusion maps from ASL and DSC perfusion-weighted imaging were derived using Functool software in the Advantage Workstation 5.0 from GE Medical systems. ROI-based interrogation was performed from the tumoral centre, periphery, and peritumoral oedema (3 ROIs for each) followed by normalization using the ROI over the contralateral normal white matter (Figure 1). The imaging features of the gliomas, such as contrast enhancement, diffusion restriction, susceptibility changes, and T2/FLAIR-mismatch, were utilized to determine the tumoral margins on a case-by-case basis. ROIs were preferably placed on the non-necrotic, non-cystic, and non-haemorrhagic solid portions of gliomas. Initial ROI of ~0.5 cm2 area was copied to plant the same at these sites to maintain uniformity. Care was exercised to avoid placement of the ROIs along the CSF-spaces/calvarium. ROIs were drawn to calculate ADC and FA from DTI, rCBF from 3D-ASL perfusion, and rCBV from DSC perfusion maps.
Statistical analysis
All data analyses were done using SPSS (Statistical Packages for the Social Sciences, Version 20.0; IBM Corporation, Armonk, NY, USA). Student’s t-tests were used to compare the ROI-based continuous variables and chi-square tests were used for the analysis of categorical parameters in the multiparametric MRI with the immunohistochemistry (gold standard) of the resected tumor. The 4 continuous (normalized-ADCmean, normalised FAmax, normalized-DSC CBVmax, and normalized-ASL CBFmax) and 3 categorical parameters (T2/FLAIR mismatch, intra-tumoral susceptibility signal, and contrast enhancement) were selected by backward elimination for further analysis. ROC-curves were drawn for these variables to yield respective cut-off values for each of the continuous variables. One point each was assigned for presence of ≥ 50%T2/FLAIR mismatch, > 15 intra-tumoral susceptibility signals, and contrast enhancement as well as for each of the 4 continuous variables measuring above the derived cut-off values. The 7-point glioma-score was evolved by adding the individual scores of each of the parameters, and further ROC analysis of the glioma score was performed (Figure 2). Sensitivity, specificity, and negative and positive predictability were calculated for the glioma score as well as for each of the parameters.
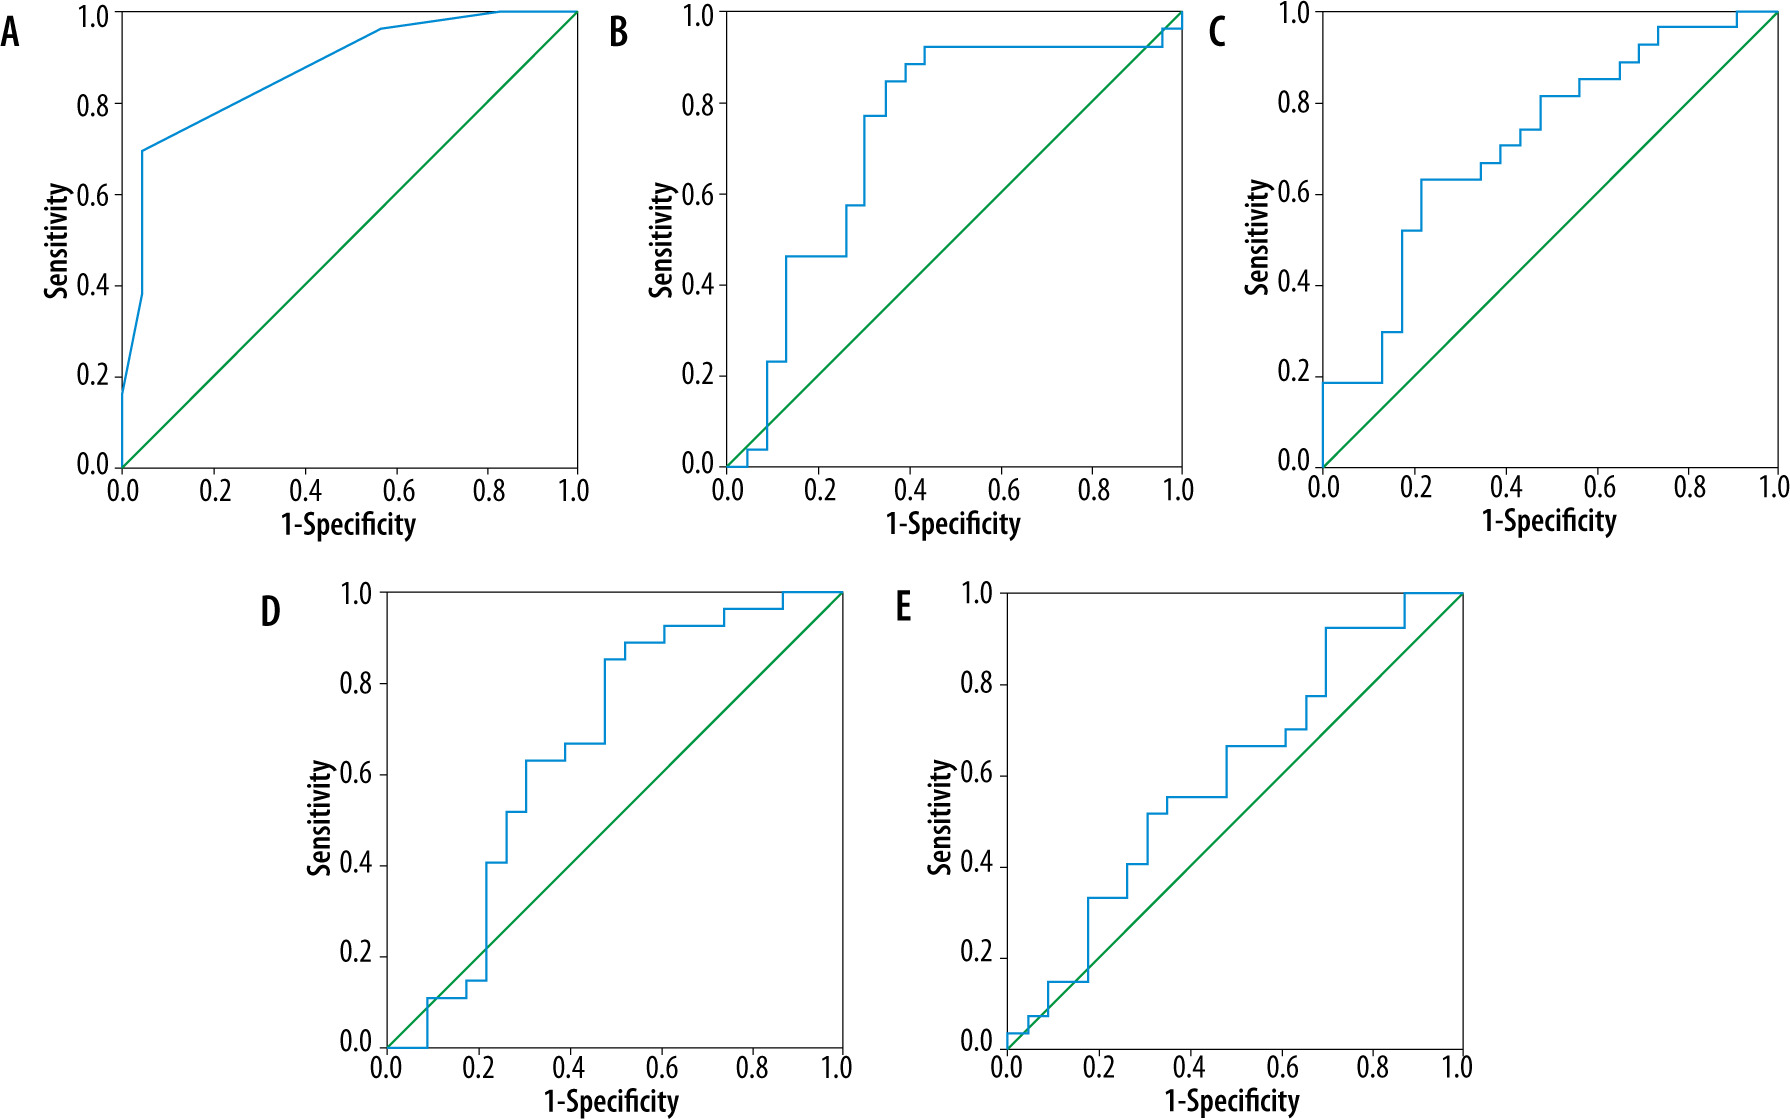
Figure 2
ROC curves of Glioma-Score (A), normalized ADCmean (B), normalized FAmax (C), normalized DSC-CBVmax (D), normalized ASL CBFmax (E) with area under curves for these being 0.872, 0.729, 0.712, 0.660, and 0.602, respectively. The correlation of glioma score with IDH mutation status is higher than the other variables
Results
Out of the 58 enrolled patients, 4 were excluded due to suboptimal image quality, 3 did not complete IHC analysis, and one was proven to be metastasis on histopathology. There were 50 patients in the study conforming to the inclusion and exclusion criteria, consisting of 18 (36%) females and 32 (64%) males. The mean age was 43.48 years, which was lower in the LGG group (36.48 years) than in the HGG group (48.55 years). 69.56% (16/23) of the IDH-wt gliomas were in males while a slightly lower 59.25% (16/27) of IDH-mutated tumors were also found in males. 21 (42%) of the patients had LGGs (WHO grade-II) while 29 (58%) were harbouring HGGs (WHO grades III and IV). The mean age for IDH-mutated gliomas was 41.7 years, while IDH-wt was found in slightly older patients (mean age 45.6 years). Amongst the patients over 40 years old, 51.9% (14/27) had IDH-wt tumors while in those younger than 40 years of age, a lower 40.9% (9/22) were wild type and more (59.1%) were IDH mutated.
Topographically, 58.6% (17/29) of the HGGs were in the left hemisphere, and 41.4% (12/29) were on the right side, similar to the distribution of LGGs (57.1% right and 42.9% left). Topographic distribution of glioma genotypes showed IDH-mutated tumors to be commoner in the right hemisphere (17/27, 63%), whereas the wild-type tumors were more common on the left side (13/20, 65%). The frontal lobe was overall the commonest location across all WHO grades (27.7% of HGG and 32.9% of LGGs) and genotypes (34.87% of IDH-wild and 40.74% of IDH-mutated). 57.9% of the frontal lobe lesions, 66.7% of the temporal lobe masses, and all 6 of the insular gliomas showed IDH-mutated status, while 67% of parietal tumors were IDH-wt. Glioblastoma was overall the commonest tumor, found in 36% (18/50) of the patients, and the oligodendroglioma was next, at 34% (17/50).
IDH-mutated gliomas (54%) were slightly more common than the IDH-wt (46%) in our cohort. The commonest histologic phenotype of the IDH-wt tumors was glioblastoma (13/23), and that of the mutant group was oligodendroglioma (14/27). 66% of the gliomas showed T2/FLAIR mismatch across all the WHO grades. How-ever, a significant T2/FLAIR mismatch was found in 59.25%(16/27) of IDH-mutated gliomas while it was in 34.8% (8/23) of the wild genotype. The presence of intra-tumoral susceptibility signal (ITSS)>15 among IDH-wt and mutant types was 42.4% and 22.2%, respectively. 69.56% (16/23) of the wild-type exhibited contrast-enhancement with 8.7% (2/23) remaining unenhanced, while the mutated group had 44.4% (12/27) with non-enhancing and 22.2% with eccentric enhancement. The mean glioma scores of IDH mutant and wild lesions were 2.29 and 4.56, respectively. A glioma score of more than 4.5 reliably predicted the IDH-wt with higher specificity and sensitivity compared to each of the individual variables used to generate it (Table 2).
Table 2
Statistical correlation with IDH mutation
[ii] ADC – apparent diffusion coefficient, ASL – arterial spin labelling, AUC – area under curve, CBF – cerebral blood flow, CBV – cerebral blood volume, FA – fractional anisotropy, FLAIR – fluid attenuation inversion recovery, ITSS – intratumoral susceptibility signal, NPV – negative predictive value, PPV – positive predictive value)
Discussion
Conventional MRI correlates of glioma genotypes
The frontal lobe predilection, unilateral and focal growth pattern, well-demarcated sharp margins, relatively homogeneous T2 signal, and lower contrast enhancement in the IDH-mutated gliomas in our cohort were in keeping with the existing literature [12-15]. Because of uncertain genotype-prediction improvement, we did not include all previously well-refuted structural correlates in the scoring criteria [10,16]. The T2-FLAIR mismatch sign serves as one of the simplest tools available for preoperative genotype prediction by its absence among the IDH-mutated and 1p19q-codeleted gliomas [17]. A significant T2/FLAIR mismatch was found in only 18.5% (5/27) of IDH-mutated gliomas, but it was also absent in 34.8% (8/23) of wild type gliomas. However, its correlation with IDH-mutation & 1p19q codeletion among the oligodendrogliomas (17/50) remained high (Figure 3). False positives of T2/FLAIR mismatch sign have also been reported recently [18].
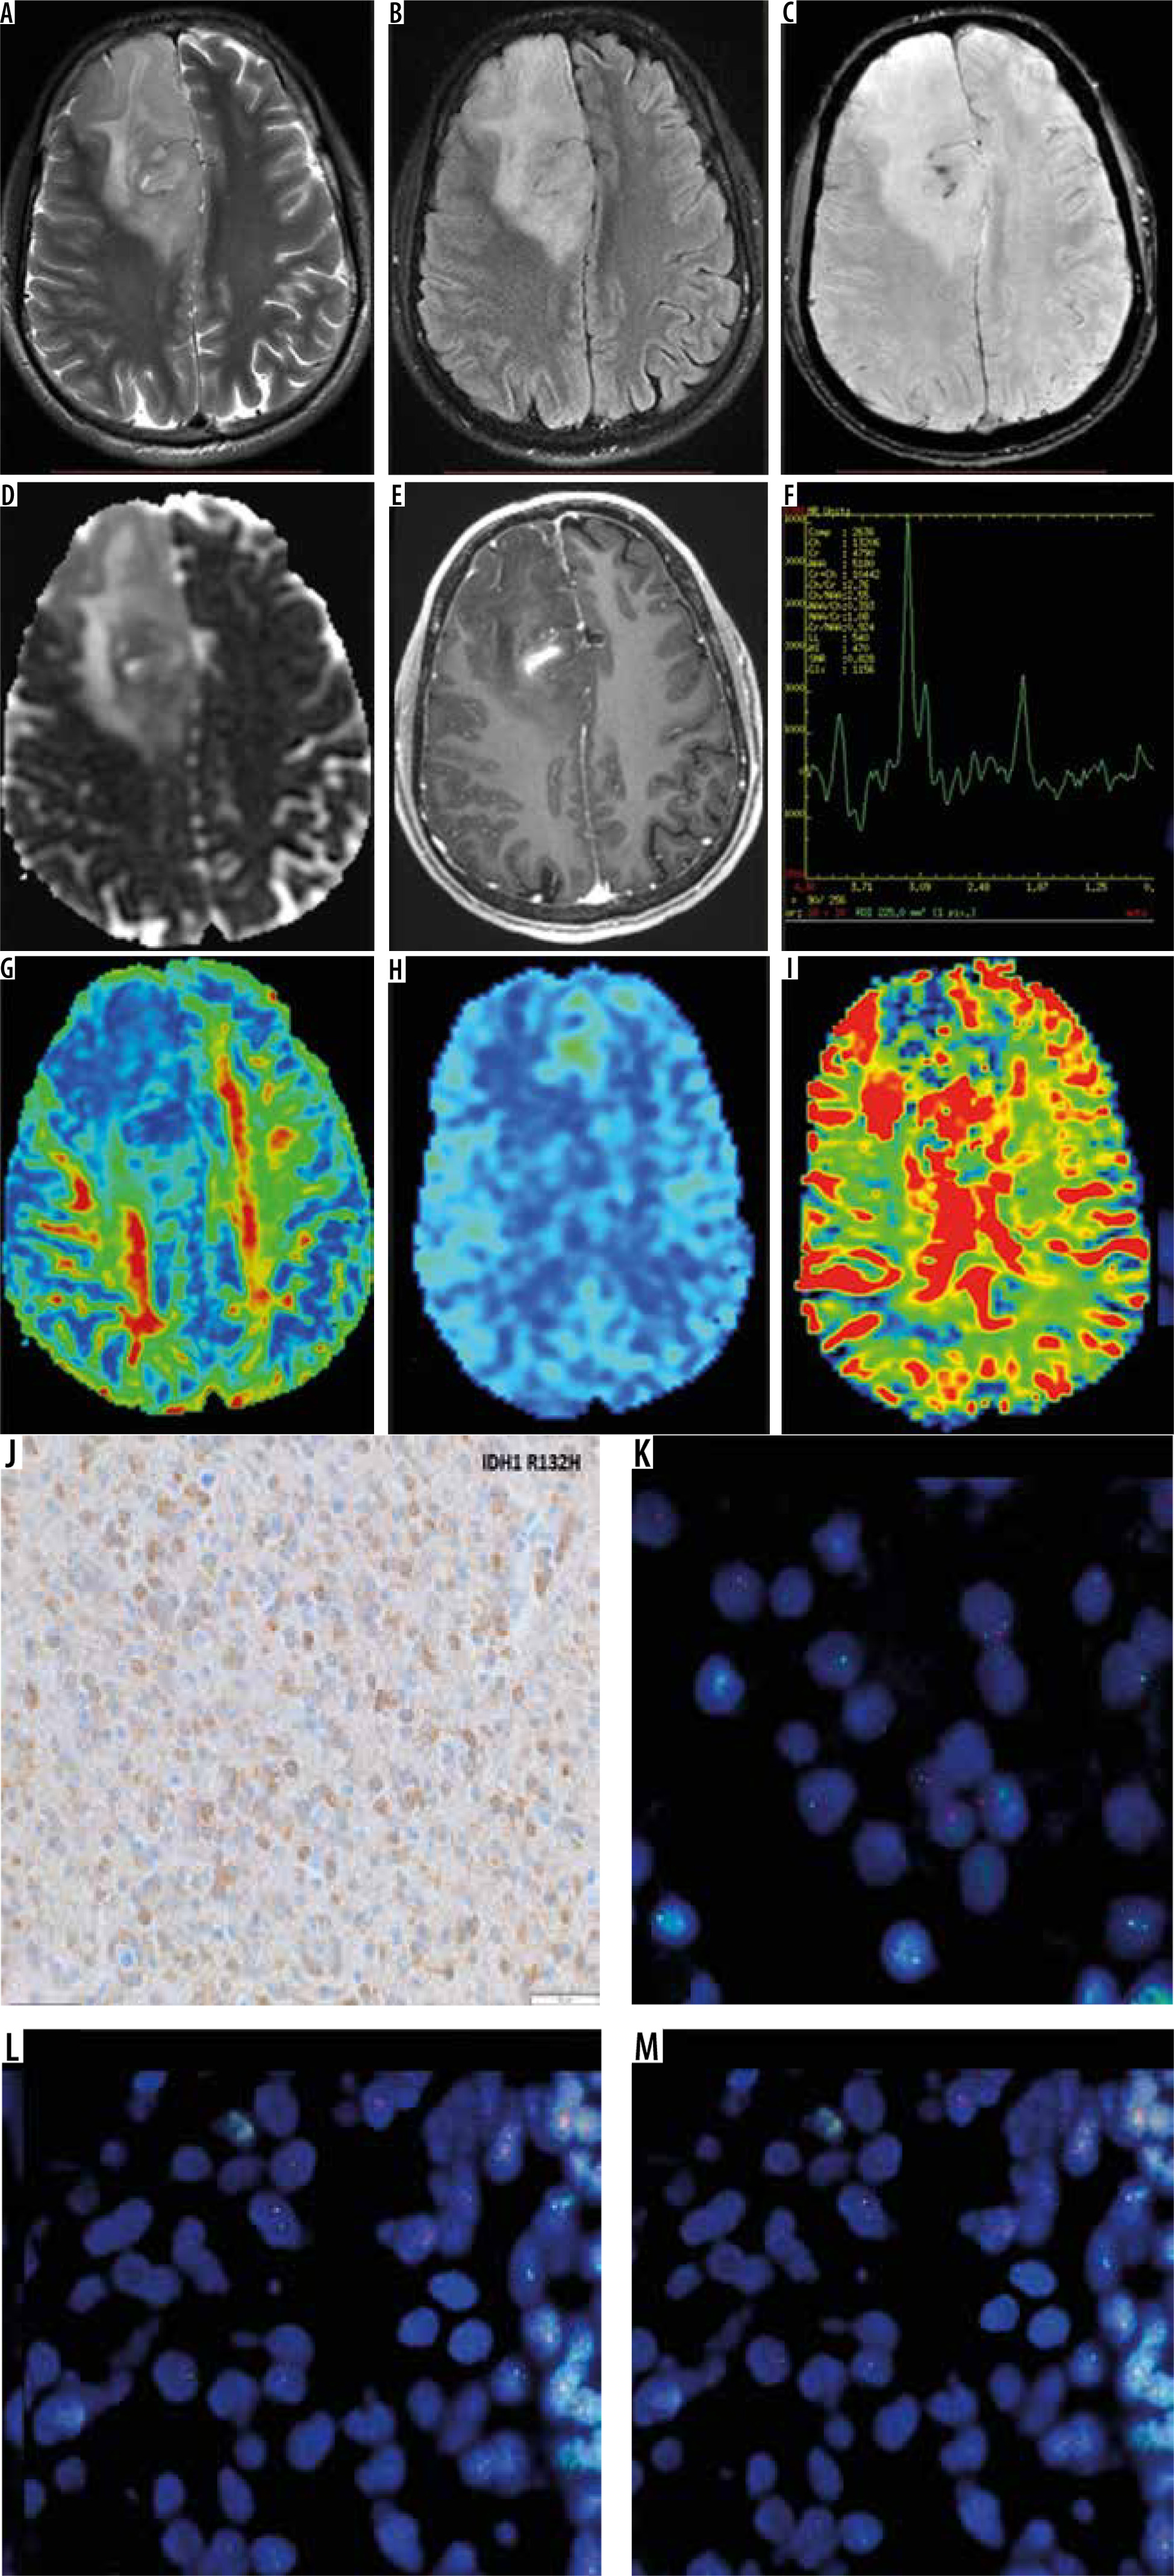
Figure 3
MRI of a 28-year-old male with a right frontal tumor, showing absence of T2/FLAIR mismatch on axial T2WI (A) and FLAIR (B) images, presence of < 5 intra-tumoral susceptibility changes on SWI (C), focal diffusion restriction in apparent diffusion coefficient maps (D), eccentric focal enhancement on post-contrast T1WI (E), prominent choline peak on MR spectroscopy (F), reduced FA on DTI (G), focally raised CBF on ASL-CBF map (H), and corresponding hyperperfusion on DSC-CBV map (I). This tumor corresponds to glioma score = 2, suggestive of an IDH-mutated low-grade glioma On histopathology, round to oval cells with a fine arborizing network of ‘chicken-wire’ calcification is seen (J). Immunohistochemistry is showing neoplastic cells with immunoreactivity for IDH R132H mutant protein (K), deletion of chromosome 1p (red) as inferred from 2 green signals for CEP-1 and only one red signal for 1p in more than 40% of cells (L) and deletion of chromosome 19q (red) as inferred from 2 green signals for CEP-1 and only one red signal for 19q in more than 40% of the cells (M), consistent with the diagnosis of oligodendroglioma, WHO grade-II with IDH-mutant and 1p19q co-deleted genotype
Advanced MRI correlates of glioma genotypes
In this study, HGGs demonstrated significantly higher ITSS (17 [58.6%] had > 15 ITSS, 23 [79.3%] and 7 [24.1%] had < 5 ITSS) as compared to LGGs (3 [14%] had > 15 ITSS and 12 [57.1%] had < 5% ITSS). The distribution of linear and dot-like susceptibility foci involving the solid tumor component was commonly found in grade-IV gliomas (Figure 4). This reliable WHO grade differentiation is in line with the recent data [19,20]. We found > 15 ITSS in 59.1% of IDH-wt and 23.1% of IDH-mutated tumors (70.2% of these showing < 10 ITSS). The normalized-ADCmean derived from DTI-maps differentiated the WHO grades and IDH status probably due to better resolution of anomalous diffusion anisotropy than conventional DWI-based ADC maps [21]. The normalized FAmax in our tumors significantly correlated with the IDH status (0.96 for wild-type and 0.6 for mutated). Although the distribution of Cho/Cr ratio in MR spectroscopy above 2.8 was greater in our HGGs compared to the LGGs, no statistical significance could be deduced for the IDH status, in contradistinction to other studies [22]. The statistically significant correlation of both ASL- and DSC-based perfusion markers (DSC-CBVmax had a higher area under curve [0.66 vs. 0.602] with IDH) of the status of glioma was similar to a recent study [23].
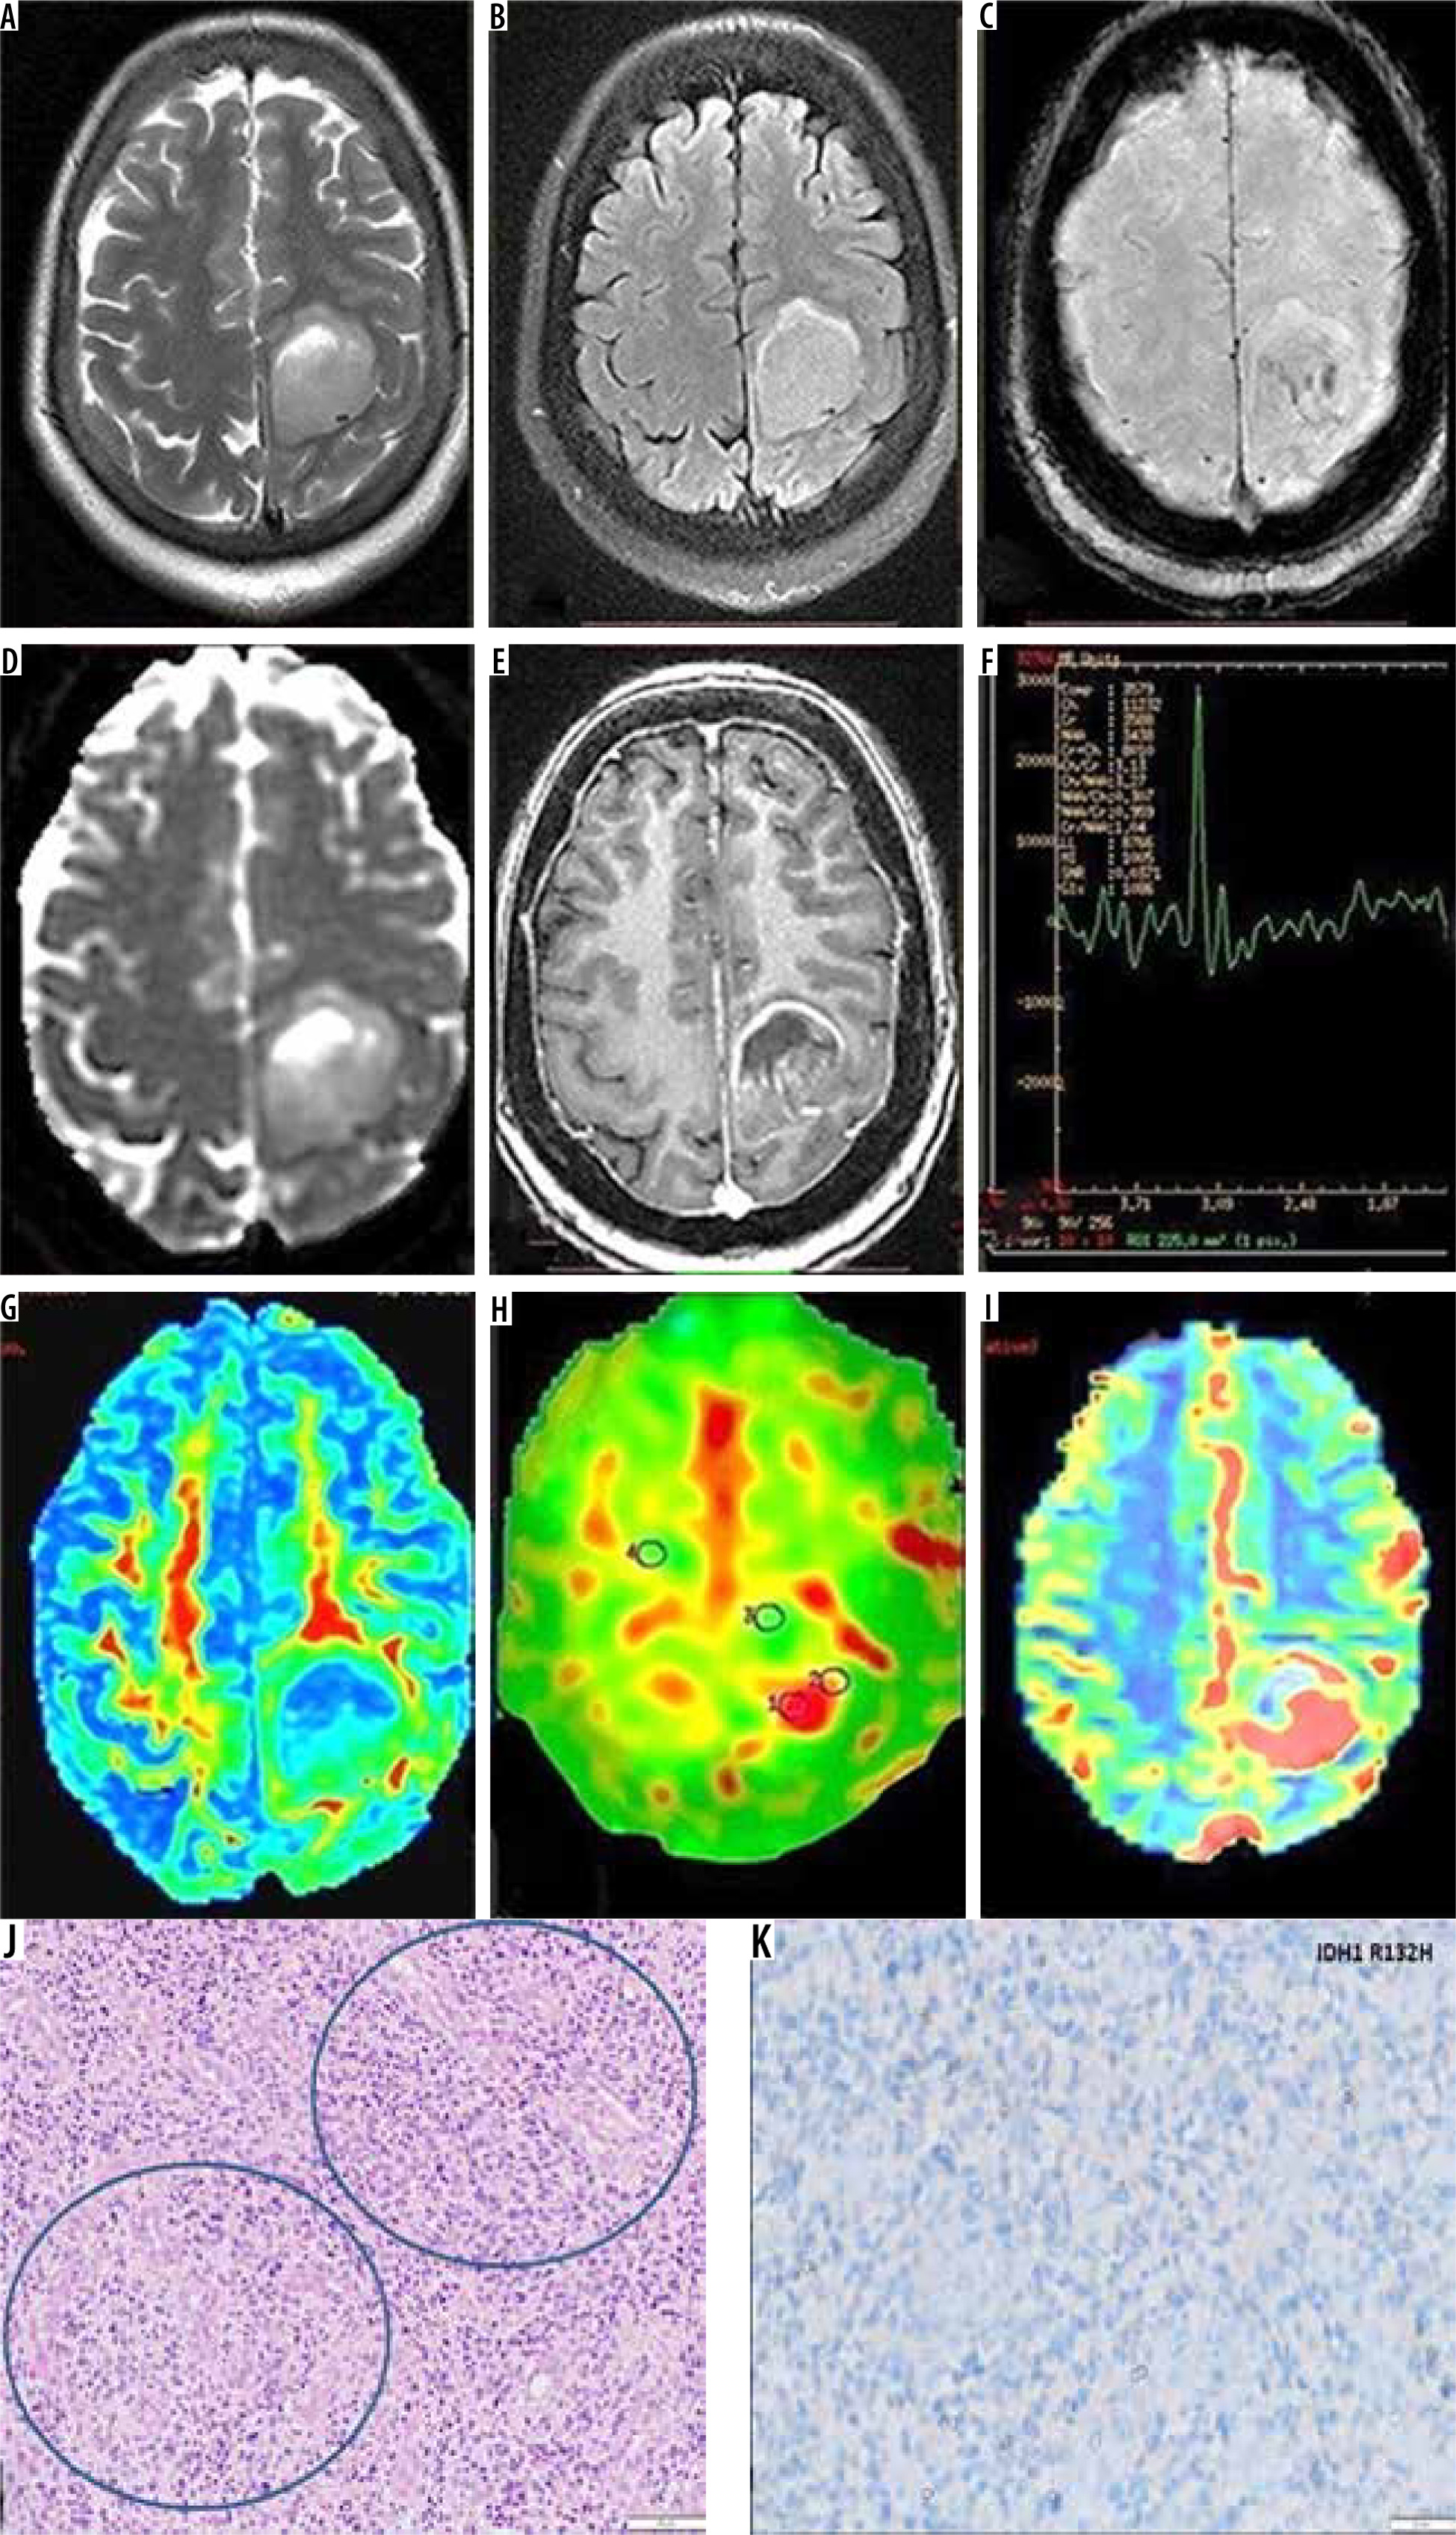
Figure 4
MRI of a 47-year-old female with left frontal tumor showing no T2/FLAIR mismatch in axial T2WI (A) and FLAIR (B) images, 5-10 of intra-tumoral susceptibility signals on SWI (C), focal diffusion restriction in ADC (D), peripheral and eccentric enhancement on post-contrast T1WI (E), prominent choline peak on MRS (F), raised FA on DTI (G), raised CBF on ASL-CBF map (H), and high CBV on DSC-CBV map in its posterior aspect (I). This glioma score = 6, consistent with IDH-wild type-high grade glioma. On histopathology, the neoplastic cells with nuclear atypia and endovascular proliferation (encircled, H&E × 200) are seen (J), which are immunonegative for IDH R132H mutant protein (IDH-wild phenotype) on immunohistochemistry (K). The final diagnosis is glioblastoma, WHO grade-IV, IDH wild type
Multiparametric MRI-based glioma scoring
Unlike some previous studies in which predominantly conventional imaging parameters were used for WHO grade segregation of gliomas [24], we attempted to predict the glioma genotype. By preserving the relevant conventional MRI-based parameters, our scoring system builds onto the structural imaging correlates. The ROI-based parameters in this study complement to increase predictability and reduce subjectivity. The higher accuracy of the normalized variables in ROC-based analysis in our study was similar to a recent study on tumoral multiparametric diffusion and perfusion metrics [25]. We selected only the significantly correlating variables (p < 0.05) for inclusion in the scoring. Unlike the multiple molecular scoring in a previous study, our scoring provides better statistical predictability because we deduced cut-off values for the final score as well [26]. The sensitivity and specificity of the glioma score is comparable to the summary values from the pooled data analysis of the recent metanalysis [27].
This study may have certain limitations. Since only the patients awaiting glioma-resection were included, selection bias may have crept in unexpectedly because of a higher probability that the HGGs, especially those causing worse symptoms, will be operated on. During the MR acquisition of the non-cooperative patients, sedation with intravenous midazolam injection was used to avoid motion artifacts. Its pharmacological effects on glioma perfusion might not have been accounted for in the results. Although an average of 3 ROIs each from the centre, periphery, and perilesional regions was taken for every parameter, an observer bias in the manual placement of the ROIs cannot be negated entirely. Only the immunohistochemistry is used for the IDH mutation of the operated tumors and not the sequencing methods, which may underestimate the number of IDH-mutated tumors.
In conclusion, the novel advanced multiparametric MRI-based glioma score can reliably predict the IDH mutation status with high statistical significance in addition to the WHO grade differentiation across all the grades and histological variants. Further research with large, randomized trials is needed to validate our methods and possibly evolve a glioma reporting lexicon. Our study also opens the scope for artificial intelligence-based preoperative validation of radiogenomics in gliomas.