


Introduction
Tumour size is the main component of cancer staging, which guides correct therapeutic decision making. A precise assessment of maximum tumour size is essential for choosing the surgery plan for breast conservation or mastectomy. Complete excision of the tumour foci is the primary goal because it prevents tumour recurrence [1,2]. Furthermore, it is important for oncologists to determine tumour size because it relates to primary systemic therapy [3]. It might also be related to the cosmetic outcome [4].
Dynamic contrast-enhanced magnetic resonance imaging (DCE-MRI) is shown to be more precise than ultrasound (US) or mammography (MG) for estimating tumour size, local extent, and additional foci of breast carcinoma [5]. Also, accuracy in estimating preoperative tumour size with the use of clinical breast examination (CBE), US, MG, and DCE-MRI, has been studied in the literature, and CBE, MG, and DCE-MRI are more likely to overestimate the size, whereas US mostly underestimates it [6-8]. Whichever of the aforementioned modalities were used, the Breast Imaging-Reporting and Data System (BI-RADS) of the American College of Radiology (ACR) is essential for patient analysis. BI-RADS includes imaging findings, assessments, and recommendations for radiologists and physicians. The first edition of the BI-RADS atlas published in 1992 was limited to mammography. Since the fourth edition of BI-RADS, MRI descriptives were added to score the likelihood of malignancy [9]. It depends on morphologic and dynamic findings, which include moderate to substantial agreement in interobserver assessments [10].
The factors affecting discordance between DCE-MRI and histopathologic tumour size measurements have been investigated previously [2,4-8,11-14]. Although the presence of ductal carcinoma in situ (DCIS), non-mass enhancement in DCE-MRI, and oestrogen receptor positivity have been found to be related with overestimation, the BI-RADS descriptives have not found the right place, in our opinion. Our aim was to evaluate MRI-pathology concordance of tumour size measurements in patients with invasive breast carcinoma with emphasis on BI-RADS descriptors of DCE-MRI.
Material and methods
Methods
This retrospective study was approved by the Institutional Review Board at our university hospital. All procedures were conducted in accordance with the Declaration of Helsinki. The requirement for informed consent was waived because of the study design.
Patient cohort
A retrospective analysis of the medical records of patients with surgically confirmed breast carcinoma, who were treated at our institution between January 2017 and August 2018, was conducted. We excluded those who underwent neoadjuvant chemotherapy, those who underwent excisional biopsy before breast MRI, and those who did not have pathologic data such as the nuclear grade, histologic grade, or HER2 status. Also, patients with DCIS, an invasive cancer with an extensive intraductal component, whose tumours were re-excised were excluded because of the potentially problematic nature of determining an accurate pathologic size [15,16]. A total of 94 patients were enrolled in the study.
Breast DCE-MRI protocol
Written, informed consent was obtained from all patients before DCE-MRI. All breast DCE-MRIs were performed using a 3T scanner (Verio, Siemens Healthcare, Erlangen, Germany) with a phase-array eight-channel bilateral breast receive coil (Breastmatrix, Siemens Healthcare, Erlangen, Germany). An intravenous catheter was inserted into the antecubital vein of the left or right arm before the examination. Each study included unenhanced non–fat-saturated T1-weighted and fat-saturated T2-weighted sequences. Axial turbo-spin echo inversion recovery fat-saturated T2-weighted sequences were performed using the following parameters: TR = 3000-3500 ms, TE = 79 ms, field of view (FOV) = 20-24 cm, matrix = 288 x 192, slice thickness = 4 mm with no gap, flip angle = 90 degrees, and number of excitations (NEX) = 2. Then, dynamic contrast-enhanced sequences containing axial T1-weighted three-dimensional (3D) fast spoiled gradient recall echo sequences (TR = 5.3, TE = 2.5, FOV = 20-24 cm, matrix = 256 x 256, slice thickness = 4 mm) were performed. DCE-MRI included one precontrast acquisition and five postcontrast acquisitions after the injection of gadolinium-diethylene triamine pentacetate acid (Magnevist; Bayer HealthCare, Wayne, NJ). Contrast was injected at a dose of 0.1 mmol/kg body weight using an automated pump (Nemoto; Nemoto Kyorindo, Tokyo, Japan) followed by a 20 ml saline flush, both at a rate of 2 ml/s. Standard subtraction images and time-resolved transversal maximum intensity projection (MIP) of the subtraction images of both breasts were created. All MRI examinations were performed between seven and 14 days of the menstrual cycle to minimise enhancement of normal glandular tissue.
Image analysis
All images were assessed retrospectively by two radiologists with experience in breast MRI interpretation (A.A.G: two years’ experience, E.I: five years’ experience). The greatest dimension was measured using an electronic digital calliper. Concordance between MRI and the final pathology results were defined as a difference in tumour size of ≤ 5 mm.
Early-subtracted DCE T1W sequence was used for tumour size measurements. Tumour morphology, DCE kinetics, and multiplicity were analysed based on the second edition of BI-RADS [17]. Lesions were classified as mass or non-mass enhancement lesions. Mass is a three-dimensional lesion that occupies a space within the breast. Non-mass enhancements are areas of enhancement without a detectable three-dimensional margin. The shape (oval, round, or irregular), margin (circumscribed, irregular, or spiculated), and internal enhancement characteristics (homogeneous, heterogeneous, rim enhancement, or dark internal septations) of a mass lesion were evaluated. MR Syngo Station (Siemens Healthcare, Erlangen, Germany) was used to generate colour-coded information on lesion kinetics. The time-intensity curves were assessed based on delayed phases. The delayed phase was categorised into three types: type 1, persistent; type 2, plateau; or type 3, washout. Multiplicity was defined as the presence of more than one unconnected breast lesion. When there were multiple lesions in a breast, the largest lesion alone was analysed.
The level of background parenchymal enhancement (BPE) was visually and subjectively assessed across the entire breast parenchyma. Maximum-intensity projection images were used to evaluate BPE, which is classified as minimal, mild, moderate, or marked according to the percentage of enhanced glandular tissue (< 25%, 25-50%, 50-75%, and > 75%, respectively). Women were then assigned to two different groups, depending on the degree of BPE. Group 1 consisted of women with minimal or mild BPE, and group 2 consisted of women with moderate or marked BPE. Also, fibroglandular volume (FGV) was analysed qualitatively by evaluating T1-weighted images, and categorisations were done by using the fourth edition of ACR BI-RADS according to the percentage of glandular tissue. We categorised the breast density as dens or non-dense. The dense category was defined for VDG 3 and 4, and non-dense breasts were classified as VDG 1 and 2.
Pathologic analysis
All patients’ medical records were compiled. Pathological reports of breast-conserving surgery or mastectomy specimens were reviewed to determine the tumour type, maximum diameter of the invasive tumour, histological grade, lymphovascular invasion, and perineural invasion. Consistent with the common practice of the pathology service of our institution, all histological examinations were performed according to generally accepted standards [18]. Palpable tumours were sliced in the long axis of the tumour. Tumour size was measured at the level of the largest diameter. Specimens with nonpalpable tumours or mastectomies were sliced either from the nipple towards the pectoral wall or from medial to lateral. Tumour size was measured as the sum of slices containing tumour.
For the immunohistochemical (IHC) evaluation of ER, PR, HER2, and Ki-67 status, formalin-fixed, paraffin-embedded tissue sections obtained from surgical specimens were stained with appropriate antibodies for ER (Novocastra, Newcastle upon Tyne, UK), PR (Novocastra), HER2 (Ventana Medical Systems, Tucson, AZ), and Ki-67 (MIB-1; Dako, Glostrup, Denmark). ER and PR were determined using nuclear staining, which was graded from 0 to 8 using the Allred score [19]. The results were categorised as positive when the total score, expressed as the sum of the proportion score and immunointensity score, was at least 3. For HER2 evaluation, membranous staining was graded as follows: scores of 0, 1, 2, and 3 [20]. HER2 status was deemed to be positive with a score of 3 and negative with a score of 0 or 1. Tumours with a score of 2 were sent for fluorescence in situ hybridisation testing, which was performed using the PathVysion HER2 DNA Probe Kit (Abbott-Vysis, Des Plaines, IL). This test determines the HER2 amplification in the event that the ratio of the HER2 gene signal to chromosome 17 signal is more than 2, which is classified as positive. Ki-67 was reported as the percentage of immunoreactive cells among 2000 tumour cells in randomly selected, high-power fields at the periphery of the tumour. Histological diagnoses were made by two pathologists with 10 and 15 years of experience in histological breast evaluation.
Based on IHC or fluorescence in situ hybridisation findings of ER, PR, HER2, and Ki-67 expressions, the tumours were divided into four subtypes as per the recommendations of the 13th International Breast Cancer Conference held at St. Gallen, Switzerland in 2013 [21] as luminal A (ER and/or PR positive, Ki-67 ≤ 20%, HER2 negative), luminal B (ER and/or PR positive, as well as Ki- 67 > 20% or HER2 positive), HER2 positive (ER negative, PR negative, HER2 positive), and triple negative (ER negative, PR negative, HER2 negative). Tumours were divided into three histologic groups: invasive ductal carcinoma (IDC), invasive lobular carcinoma (ILC), and “other” (mucinous, tubular, microinvasive ductal carcinoma, and mixed cancers).
Statistical analysis
All statistical analyses were conducted using SPSS 20.0 software (SPSS, Chicago, IL). We conducted a descriptive analysis of all variables. Tumour sizes were compared using a paired t-test and Spearman’s Rho correlation analysis. Concordance rates between MRI and pathology according to histological subtype, molecular subtype, lymphovascular invasion, perineural invasion, histological grade, multiplicity, DCE-MRI characteristics, and ER, PR, and HER2 status were compared using the chi-squared test. After a positive chi-squared test (p < 0.05), multivariate logistic regression analysis was performed, and the effects of factors were analysed using a backward stepwise logistic regression analysis. Dummy variables were used performing multiple comparisons of subgroups. P-values < 0.05 were considered statistically significant.
Results
A total of 94 patients were included. The mean patient age was 52.2 years (age range, 30-78 years). The molecular subtype distribution was luminal A, 51.1% (48/94); luminal B, 34% (32/94); HER2 positive 2.1% (2/94); and triple negative, 12.8% (12/94). Histopathological results revealed invasive ductal carcinoma (n = 82), invasive lobular carcinoma (n = 5), mucinous carcinoma (n = 3), tubular carcinoma (n = 1), mixed invasive ductal and lobular carcinoma (n = 2), and microinvasive ductal carcinoma (n = 1). Table 1 shows all descriptives for discordant and concordant groups.
Table 1
Descriptives for discordant and concordant groups
The mean tumour size on MRI was 2.75 ± 1.22 cm. Tumour measurements determined by MRI were not significantly different to those recorded in the pathological reports (2.64 ± 1.16 cm, Wilcoxon Z = –1.853, p = 0.064). Pearson correlation was 91.9% (Figure 1).
Figure 1
Tumour size measurements at pathology and dynamic contrast-enhanced magnetic resonance imaging (cm)
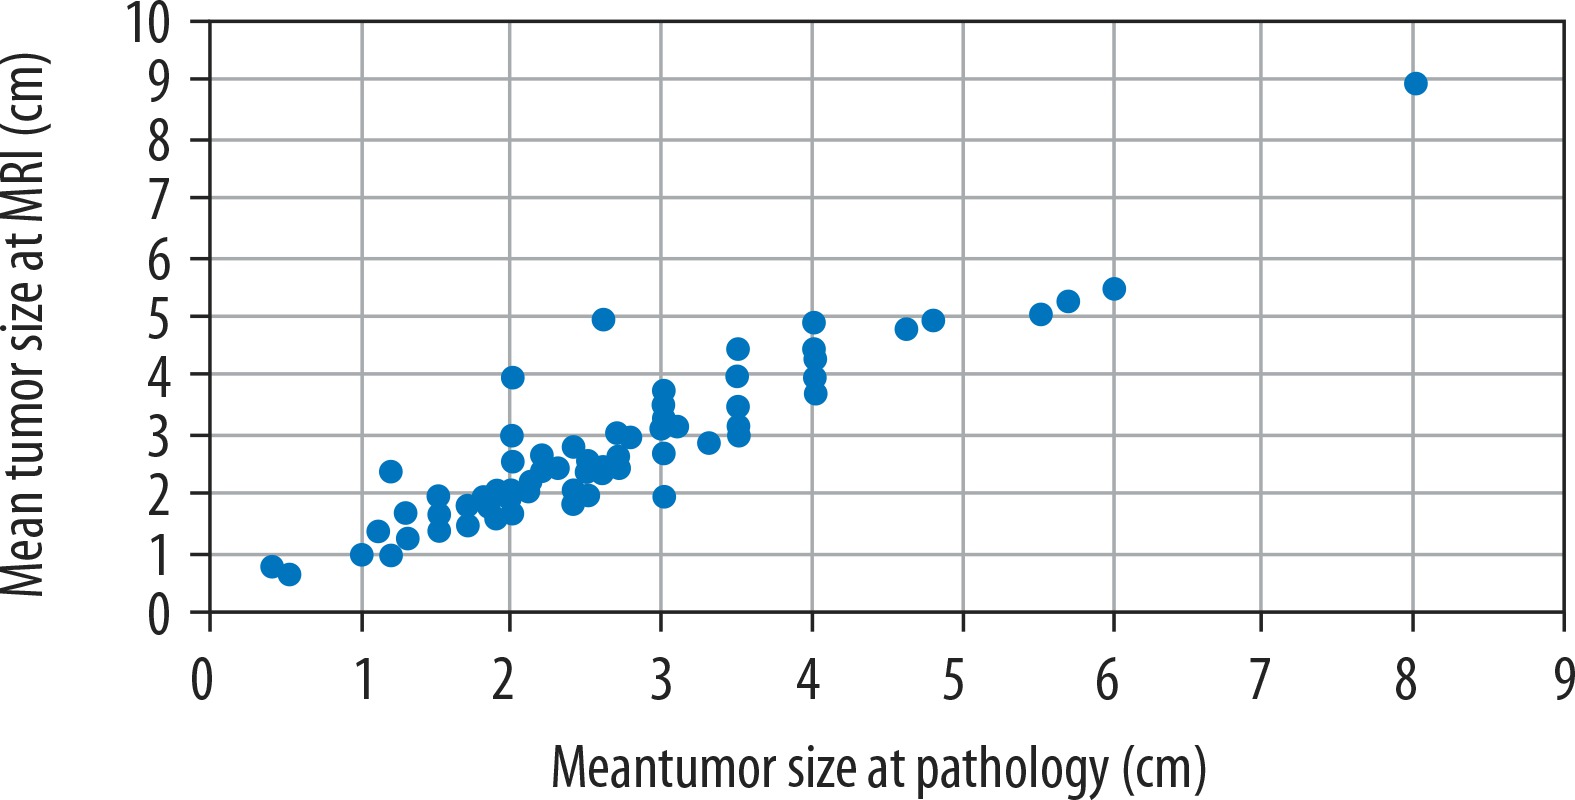
Tumour sizes were concordant in 72/94 patients (76.6%). MRI overestimated the size of 17/94 tumours (18.1%) with a mean overestimation of 0.47 ± 0.47 cm. MRI underestimated the size of 5/94 tumours (5.3%) with a mean underestimation of –0.29 ± 0.18 cm. The mean difference between the pathologic and MRI tumour sizes (Dm = pathology tumour size – MR size) was –0.1 cm, and this value ranged from –1 to 2.4 cm.
There was no difference in tumour stage by MRI and pathological assessment in 84 of the 94 tumours (89.4%). The T stages of 10 patients were changed. The changes were seen at T1-T2. Of the 10 patients whose T stages changed, seven (7.4%) upstaged and three (3.2%) understaged with MRI. A comparison of the clinicohistologic characteristics affecting MRI-pathology concordance of tumour size and MRI-pathology discordance of tumour size are shown in Table 1.
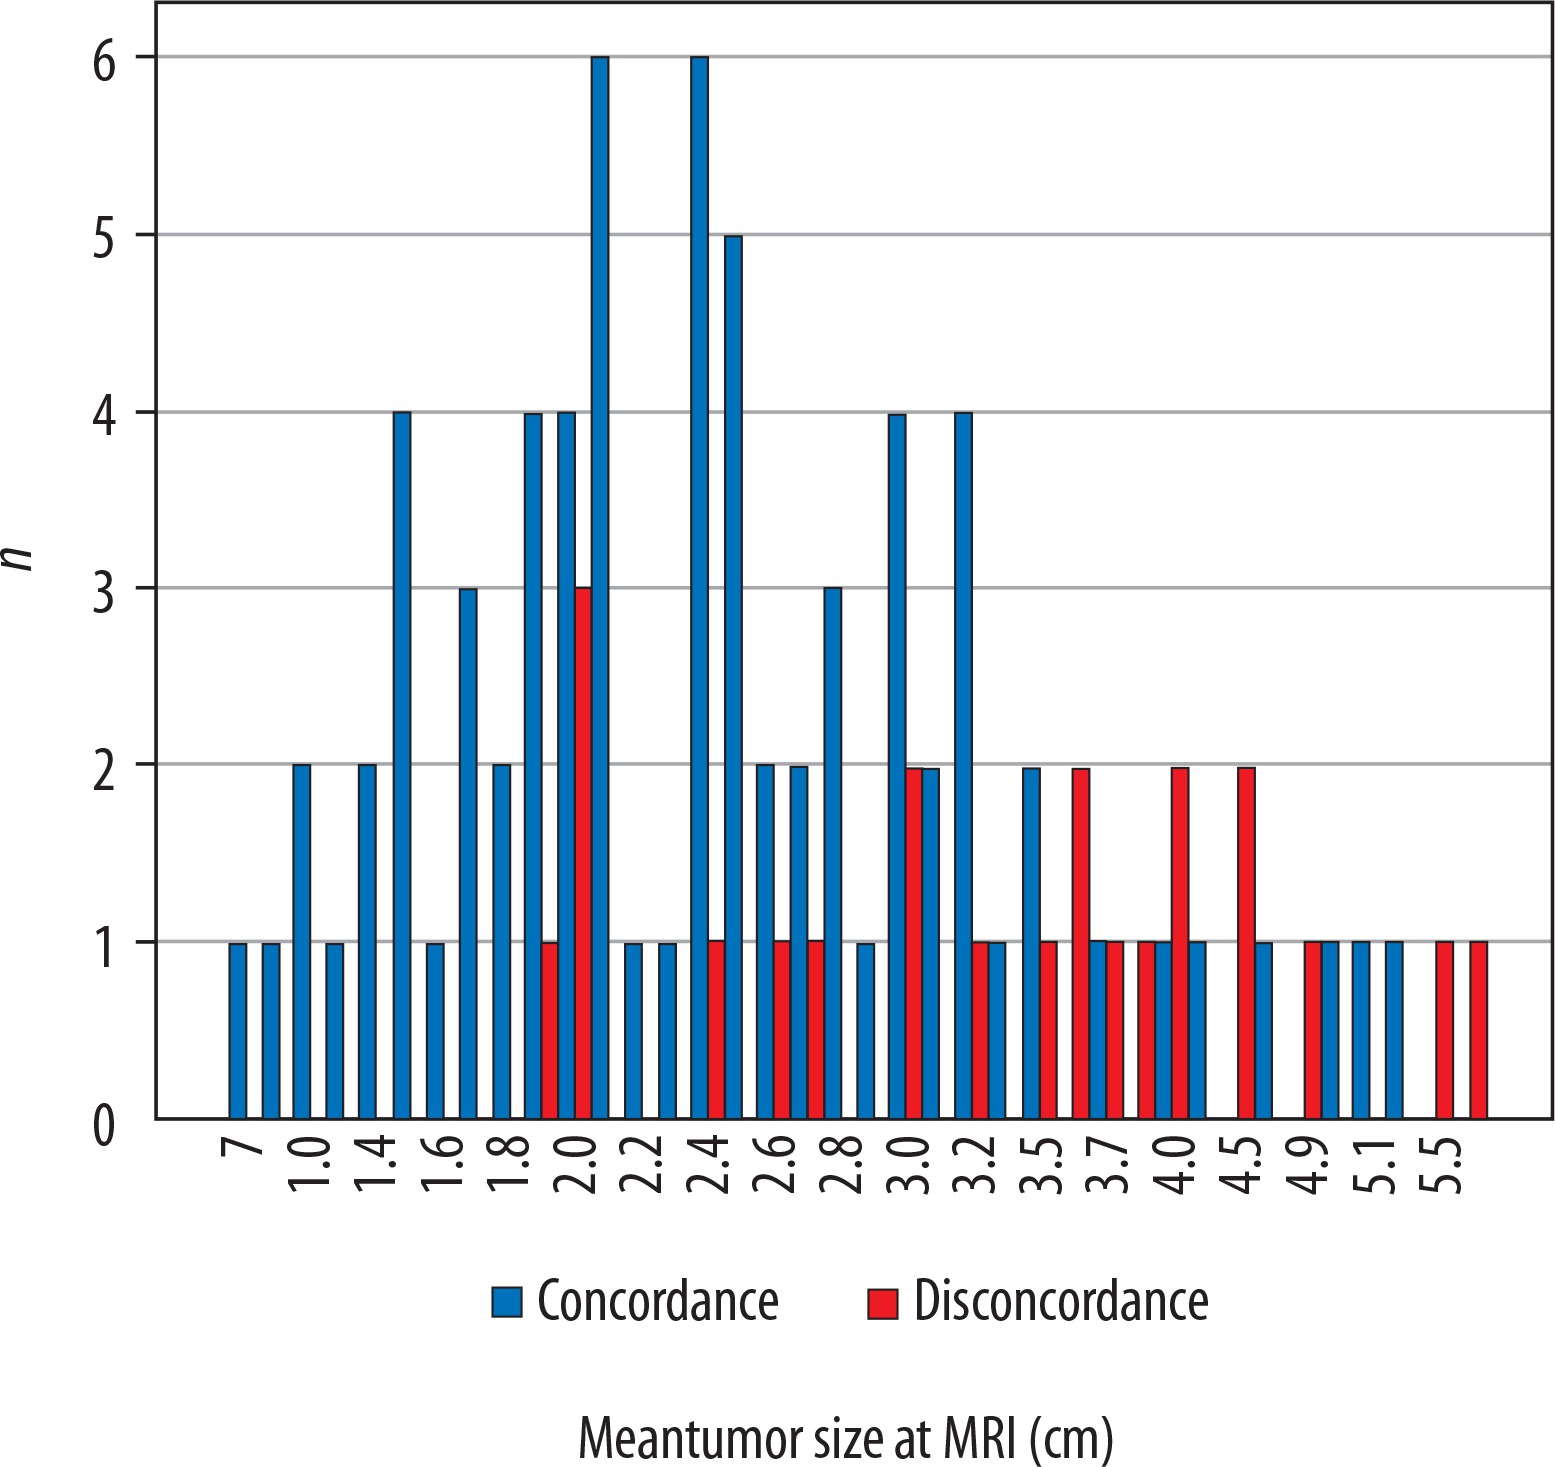
MRI-pathology discordance was associated with larger tumour size. Both of the tumour size measurements estimated from MRI and pathology reports had been affected in the same way (p < 0.001 for MRI size; p = 0.024 for pathological size) (Figure 2).
Figure 2
Tumour size measurements at dynamic contrast-enhanced magnetic resonance imaging (MRI) in concordant and discordant groups
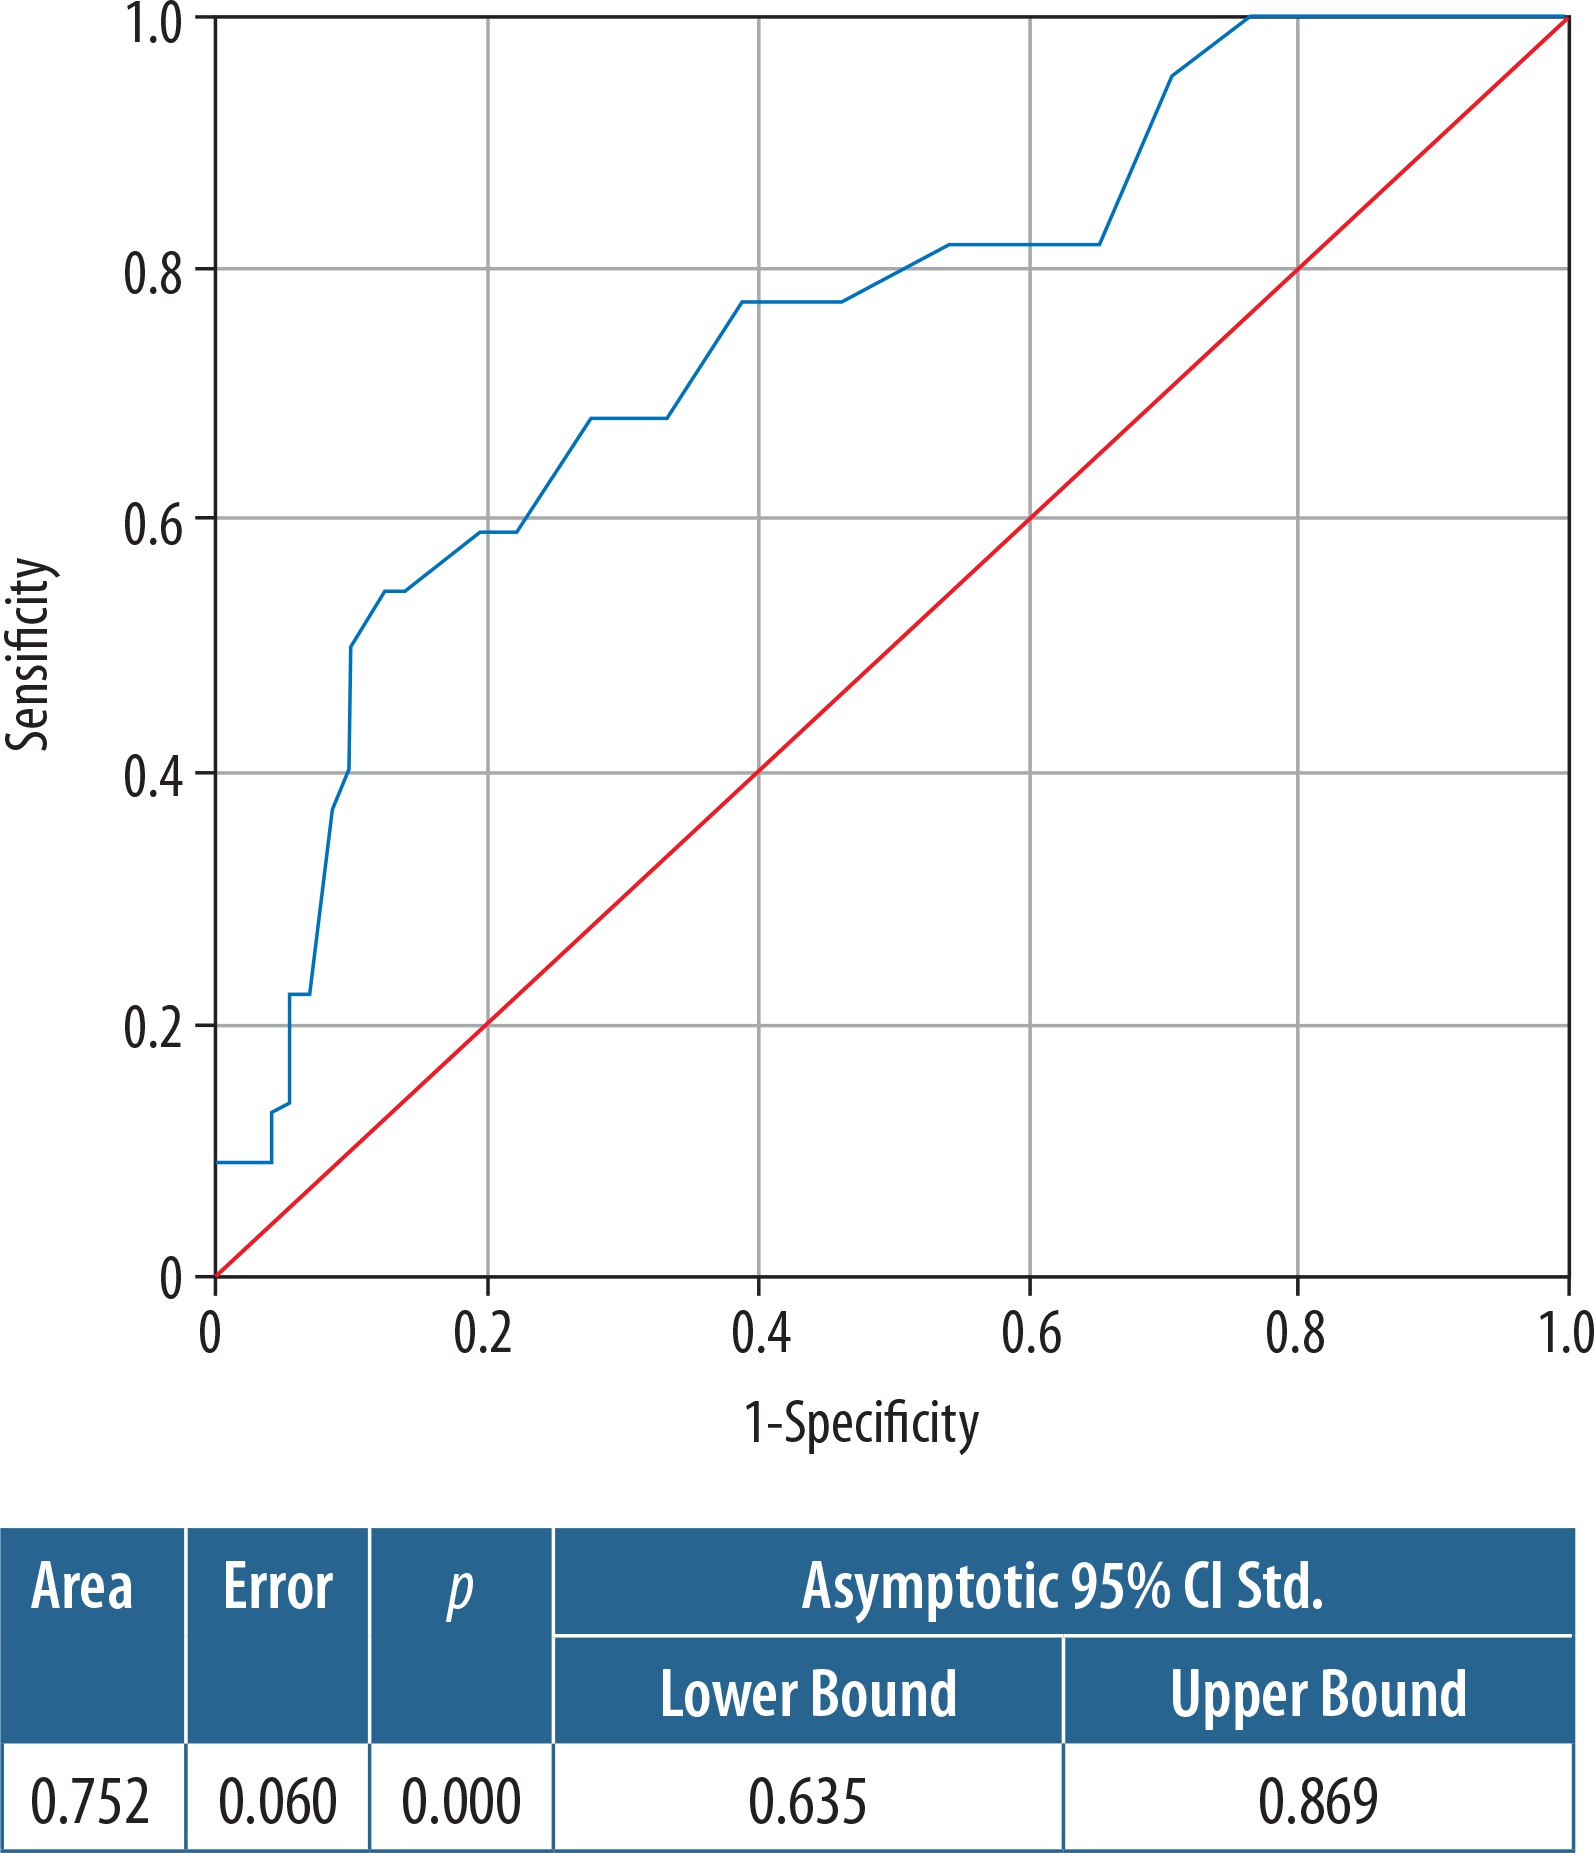
In ROC analyses (AUC: 0.752) 2.05 cm size estimated from MRI had a sensitivity of 81.8% and specificity of 34.7%. Taking the threshold to 3.4 cm, the sensitivity decreased to 54.5%, with increasing specificity to 87.5% (Figure 3).
Figure 3
Receiver operating characteristic (ROC) curve of the size assessment of dynamic contrast-enhanced magnetic resonance imaging
On univariate analysis, the histological and molecular type of tumours were not associated with MRI-pathology concordance of tumour size. Also, measurement accuracies were not significantly affected by patient age, histological grade, or lymphovascular invasion (LVI) or perineural invasion (PNI) positivity. FGV and BPE did not differ between the discordant and the concordant group statistically.
Table 1 also shows the comparison of BI-RADS descriptors. MRI features of margin and internal enhancement characteristics were statistically different between discordance and concordance groups. Irregular margin and heterogenous enhancement were associated with discordance in logistic regression analysis (p = 0.035, OR: 4,24; p = 0.021, OR: 4.96) (Table 2). Ninety-one tumours (96.8%) with a mass enhancement and three tumours (3.2%) with a non-mass enhancement were found. Two of the three non-mass tumours were in the discordant group with lobular morphology. One triple-negative tumour, belonging to concordant group, was seen as non-mass enhancement. Features of being a mass or a non-mass enhancement did not significantly affect the discrepancies between MRI and pathological measurements of tumour size.
Table 2
Multivariate logistic regression analysis of possible factors affecting MRI-pathology concordance
Discussion
In the present study, we found excellent correlation between tumour size determined by MRI and the pathological reports; nonetheless, our overestimation rates were higher (18.1%) than underestimations (5.3%). Published studies assessing MRI-pathology concordance ranged from an underestimation rate of 0% to 59% to an overestimation rate of 7% to 70% [22-25]. This wide range belongs to different concordance cut-off points, which was mostly agreed upon as ± 0.5 cm, as we accepted [5,12,26].
In a recent study by Yoo et al. in which strong correlation was found between MRI and pathology measurements, tumour size was overestimated in 11.7% and underestimated in 13.7% by MRI [13]. Patients with ductal carcinoma in situ (DCIS) were excluded from that study to avoid overestimations. The explanation for this was that pathological technicians could not measure the exact size of DCIS without using large-format histopathology methods, which means pathology underestimates DCIS size in today’s standard [27]. However, with the same exclusion, our overestimation rate was higher than the rate of underestimation, but our mean difference in tumour size was 0.1 cm, which corresponded to a nonsignificant size overestimation by MRI. Onesti et al. described a 1.06 cm overestimation with MRI in their series, especially for results for tumours larger than 2 cm in size, which is attributed the tumours with large DCIS components [12].
It was also found that while tumour size increases, concordance rates are becoming higher, as most of the studies concluded [5,12,13]. In our study, by ROC analysis, two thresholds were chosen for MRI accuracy of tumour size. When it was defined as 2.05 cm, the sensitivity was highest; 81.8% of discordant measurements were above that cut-off. When the threshold of 3.4 cm was used, specificity was highest, and 87.5% of concordant measurements were below it. Previous literature mentions the 2 cm threshold and that DCE-MRI provides accurate estimations of tumour size ≤ 2 cm [5,14].
There is no consensus in the literature about the relationship between accuracy of tumour size assessments and immunohistochemical types of breast cancer. Choi et al. studied the accuracy of MRI in breast cancer size assessment with histopathological factors, with the biggest group in the literature [14]. They analysed the size of 808 tumours and found that the size of tumours with positive ER receptor, negative HER2, luminal A type, nuclear and histological grade 1, negative nodal status, and negative LVI were significantly more accurately estimated.
Additionally, Yoo et al. found that ER negativity was associated with MRI-pathology discordance. They explained that ER-negative tumours are larger at the time of diagnosis and present as non-mass enhancement more frequently than ER-positive tumours [28].
Nevertheless, we did not find any relation between histological and molecular type of tumours and size. LVI, PNI, and tumour grade did not differ statistically between the concordance and discordance groups [5,12].
To the best of our knowledge, previous studies investigated the effect of BI-RADS descriptors on size accuracy and did not find any statistical difference related to the BI-RADS [13,28]. Our key finding was that BI-RADS descriptors of heterogenous contrast uptake and irregular margin were statistically different between the discordant and the concordant group. New to the literature, we attributed the size discrepancy to morphologic specialities rather than molecular biology, even though morphologic differences come from molecular subtypes. We achieved this result by regression analyses of all variables in the present study.
In a recent study by Rawashdeh et al., nine expert breast radiologists (min 2000 mammograms per year, minimum 10 years) were asked to delineate the breast masses manually from mammograms by using the tablets. Even being experts, a fair to moderate level of agreement was found between radiologists for shape and margin assessments using BI-RADS descriptors [29], which are qualitative and demonstrate wide intra- and interobserver variations [10,30,31]. The aforementioned study supports our result that reliability of size assessment might come from morphological features of the tumour, which are described with qualitative BI-RADS MRI descriptors.
In our study 75.5% of patients had minimal/mild BPE, whereas only 24.5% had moderate/marked BPE. Similarly, BPE levels in the high-BPE group are occasionally lower than the BPE levels in the low BPE group in the studies about this subject [32-34]. We analysed the effect of BPE on size assessment, contrary to the literature, even with similar BPE ratios, and no statistical difference was found between the high and low BPE groups. However, it was shown that high BPE causes overestimation or underestimation of tumour size by obscuring the margin of tumour [35].
Nevertheless, non-mass enhancement, which is described as one of the main reasons for size discrepancy in most of the studies about this subject [11,13,35,36], was found to be ineffective in the present study. In the aforementioned studies, it was thought that the size of non-mass-enhanced lesions was difficult to measure because it is hard to determine the borders of the lesion, and so it may be difficult to differentiate from BPE, leading to inaccurate measurements. In our study only three tumours were presented as non-mass enhancement, which may be the reason for our incompatible results with the literature.
The measurements of maximum tumour size were taken by using early-subtracted DCE T1-weighted sequence and MIP images in previous studies [2,4,11-14]. Naggara et al. investigated the value of MRI sequences for prediction of breast tumour size and concluded that T2-weighted images were better than DCE T1-weighted sequences. They gave a lot of attention to T2-weighted images, which do not overestimate the index tumour size. They also emphasised that late DCE T1-weighted images were frequently not found to be reliable enough to evaluate size, and they overestimated pathological size [37]. In our study we used the early-subtracted series, similarly to the literature. Our T2-weighted images are routinely fat saturated, which is different from the aforementioned study, which found non-fat saturated T2-weighted sequence to be more reliable for tumour size analysis.
Limitation
Two pathologists and two radiologists from the same hospital studied the cases. We could not assess intraobserver agreement between pathologists because of the retrospective design of the study. Also, we did not assess intraobserver agreement between radiologists because of time constraints. We analysed the cases in accordance.
Although excellent correlation was found in MRI-pathology concordance of tumour size measurements, two BI-RADS descriptors of irregular contour and heterogeneous contrast uptake were associated with discordancy. New to the literature, the discordancy might be attributed to the dynamic and morphological specialities of tumours primarily rather than tumour biology. A large-scale, prospective study could provide more accurate findings.