


Introduction
Breast lesions classified as lesions of uncertain malignant potential (B3) are a heterogeneous group of abnormalities with variable risk of associated malignancy. These lesions include atypical ductal hyperplasia (ADH), lobular intraepithelial neoplasia (LIN) 1-2, flat epithelial atypia (FEA), papillary lesions (PL), radial scars/complex sclerosing lesions (RS), and fibroepithelial lesions (FEL) [1]. These lesions can be subclassified according to the absence (B3a) or presence (B3b) of epithelial atypia [2-5]. Image-guided core needle biopsy (CNB) and vacuum- assisted biopsy (VAB) are essentials diagnostic procedures, and B3 lesion diagnosis occurs in 4.5-12.8% of breast specimens [6-8]. However, borderline lesions management is not simple because there is a significant risk of malignancy underestimation [9,10]. Surgical excision has been for a long time considered the best treatment option for B3 lesions in order to achieve their definitive characterization. However, recently, the first and second international consensus conference on B3 lesions recommended the expansion of the field of use of therapeutic VAB [11,12]. It is known that the apparent diffusion coefficient (ADC) value could help distinguish between benign, high-risk, and malignant breast lesions [13-17], but no previous studies have evaluated the performance of the ADC value in distinguishing between B3b lesions without and with malignancy at definitive histopathological examination (DHE) after surgical excision, between B3a lesions without and with atypia/malignancy at DHE, and between B3a and B3b lesions.
The study objectives were to evaluate if ADC value could differentiate between B3 and B3a lesions without and with atypia or malignancy at DHE after surgical excision and between B3b lesions without or with malignancy at DHE. Another study aim was to assess breast ADC value performance in distinguishing between B3a and B3b lesions.
Material and methods
Patients
From January 2013 to December 2017, 3986 CNBs were performed under sonographic guidance, and 384 (9.6%) B3 lesions were retrospectively collected.
The inclusion criteria were as follows: borderline (B3) lesion diagnosis at CNB; breast magnetic resonance (MR) performed at our hospital between 1 and 2 months after CNB procedure; surgical excision biopsy and pathological examination performed at our hospital within 1 month after MRI and within 3 months after CNB. Exclusion criteria were as follows: concomitant invasive breast cancer or ductal carcinoma in situ (DCIS) in the same breast in which borderline lesion was diagnosed; clinical evidence of haematoma at the CNB site at the time of MRI execution.
According to these criteria, 141 patients (mean age 47.9 ± 10.0 years; range 23-71) with 141 B3 lesions were selected by 4 radiologists (T.C., P.P, M.E., and S.B.F.) to be included in this study. Definitive post-surgical histopathological examination showed a maximum lesion diameter between 0.9 and 3.8 cm (mean 1.4 ± 0.4 cm).
The study was approved by the institutional review board and ethics committee of our institution. Informed consent was obtained from all individual participants included in the study. All procedures performed in studies involving human participants were in accordance with the ethical standards of the institutional and/or national research committee and with the 1964 Helsinki declaration and its later amendments or comparable ethical standards.
Ultrasound-guided core needle biopsy
All the 141 sonography-guided CNBs were performed using a semi-automatic biopsy gun (Precisa, Hospital Service, Latina, Italy) with a 14-gauge needle, and 4 to 8 (mean 5.5) cores were obtained during each CNB. In all cases local anaesthesia was performed (Lidocaine hydrochloride 20 mg/ml). All the lesion showed an important residual component visible at US examination after the procedure (always estimable as about more than 3/4 of the original lesion).
Breast magnetic resonance imaging protocol
Breast MRI was performed with a 1.5 T system (Achieva, Philips Medical Systems, Andover, MA) and a dedicated breast coil (SENSE Breast 7), using a standard protocol including the following sequences, each one with a field of view (FOV) of 340 × 340 mm:
– axial short tau inversion recovery (STIR) sequence with a TR/TE of 7758/70; flip angle 90°; matrix size of 272 × 222; slice thickness of 3 mm; slice spacing of 3 mm; acquisition time of 4 minutes 39 seconds;
– axial diffusion-weighted imaging (DWI) with a single-shot echo-planar imaging (EPI); b value of 0 and 800 s/mm2; TR/TE of 13,811/86; matrix size of 228 × 226;2 NEX; slice thickness of 3 mm; slice spacing of 3 mm and an acquisition time of 3 minutes 27 seconds;
– axial T1-weighted 3D fat-suppressed (T1fs), spoiled gradient-echo sequence (THRIVE) with TR/TE of 6.9/3.4; flip angle 12°; matrix size of 320 x 318; isotropic voxel of 1 mm; acquisition time of 1 minute 17 seconds for each phase and a total acquisition time of 7 minutes and 53 second; 1 phase before and 5 phases after gadobenate dimeglumine (Dotarem®; Guerbet BP 57400, F-95943 RoissyCdGCedex, France) bolus injection (0.2 ml/kg, 0.1 mmol/kg injected at 2.0 ml/s) followed by flushing with 20 ml of saline at 2.0 ml/s using an electronic power injector (Spectris MR Injector, Medrad).
Subtraction, multiplanar reconstruction (MPR) and maximum intensity projection (MIP) images, and ADC maps were also obtained.
Report evaluation
Two radiologists with at least 10 years’ experience in breast MRI (G.G.M. and E.P.), who were blinded to the lesion definitive histopathological examination reports, assessed the MR images in consensus.
As regards quantitative ADC values, once the lesion was identified on DWI, a region of interest (ROI) was manually placed in each slice in which the lesion was detectable on the b = 800 s/mm2 DWI to encompass as much of the abnormality as possible, while staying within its border and taking care to avoid haemorrhagic and cystic areas [18]. Mean ADC value (ADCmean), which corresponds to the area-weighted average of the ADC values found within each lesion slice, and minimum ADC value (ADCmin), which corresponds to the lower ADC value found among the different slices, were used in the analysis.
Statistical method
Definitive histopathological examinations were used as a gold standard in order to evaluate ADC value differences among B3 lesions. B3 lesions without epithelial atypia at CNB were considered B3a (PL, FEL, and RS without atypia), and the ones with epithelial atypia were considered B3b (ADH, LIN, FEA or PL, FEL, and RS with atypia at CNB). At DHE after surgical excision these lesions were further categorized in B3a without or with atypia or malignancy, and B3b without or with malignancy.
ADC values differences between groups were evaluated using t-test. The ADC threshold was chosen by the area under the ROC curve (AUC) and Youden index. AUCs were compared through the z-test. Qualitative variables were evaluated using the non-parametric Mann-Whitney U test. The statistical significance level was set at p < 0.05. All statistical analyses were performed using MedCalc Software v. 15.8 (Ostend, BEL).
Results
Histopathological findings
CNB diagnosis and specific CNB underestimation rates are reported in Table 1. The overall CNB underestimation rate was 25.5%, and the malignancy underestimation rate was 15.6%. DHE showed 16 DCISs, 4 IDCs, and 2 ILCs. 10/34 ADHs were reported as malignant (7 DCISs, 3 IDCs); 2/7 FEAs showed DCIS at DHE; 5/21 LINs were reported as malignant at DHE (2 DCISs, 2 ILCs, 1 IDCs); 13/63 PLs were reported as atypical at DHE, and 4/63 showed DCIS; 1/13 FELs showed DCIS, and 1/13 LINs.
Table 1
Borderline lesions underestimation rate at definitive histopathological examination
Magnetic resonance imaging findings
All the 141 B3 lesions were visible on DWI and ADC map. Therefore, all the 141 lesions were included in the ADC value analysis. ADCmean and ADCmin values of B3 lesions without (WO) and with (W) upgrade at DHE are reported in Table 2 (Figures 1-3).
Table 2
B3 lesions ADCmean and ADCmin values
[i] ADC – apparent diffusion coefficient, SD – standard deviation, B3a+bWO – B3 lesions without upgrade at definitive histopathological examination (DHE), B3a+bW – B3 lesions with upgrade at DHE (upgrade to malignancy for B3b or, to malignancy or atypia for B3a lesions), B3aWO – B3a lesions without atypia or malignancy at DHE, B3aW – B3a lesions with atypia or malignancy at DHE, B3bWO – B3b lesions without malignancy at DHE, B3bW – B3b lesions with malignancy at DHE
Figure 1
A 42-year-old woman with a 3.2-cm lesion in her right breast. The lesion appeared hyperintense on DWIs obtained at b = 0 (A) and b = 800 (B), and hypointense on ADC map (ADCmean 1.251 × 10⁻³ mm2/s, ADCmin 0.726 × 10⁻³ mm2/s). It was diagnosed as fibroepithelial lesion at core needle biopsy and upgraded to ductal carcinoma in situ at definitive histopathological examination after surgical excision
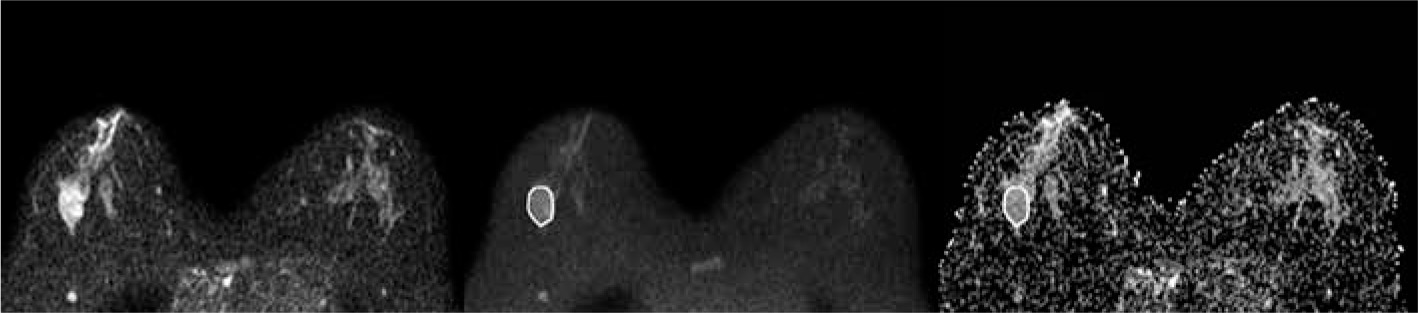
Figure 2
A 43-year-old woman with a 1.0-cm lesion in her right breast. The lesion appeared slightly hyperintense on DWIs obtained at b = 0 (A) and b = 800 (B), and hypointense on ADC map (ADCmean 1.413 × 10⁻³ mm2/s, ADCmin 1.065 × 10⁻³ mm2/s). It was diagnosed as lobular intra-ephitelial neoplasia (LIN) 1 at core needle biopsy and was confirmed to be LIN1 at definitive histopathological examination after surgical excision
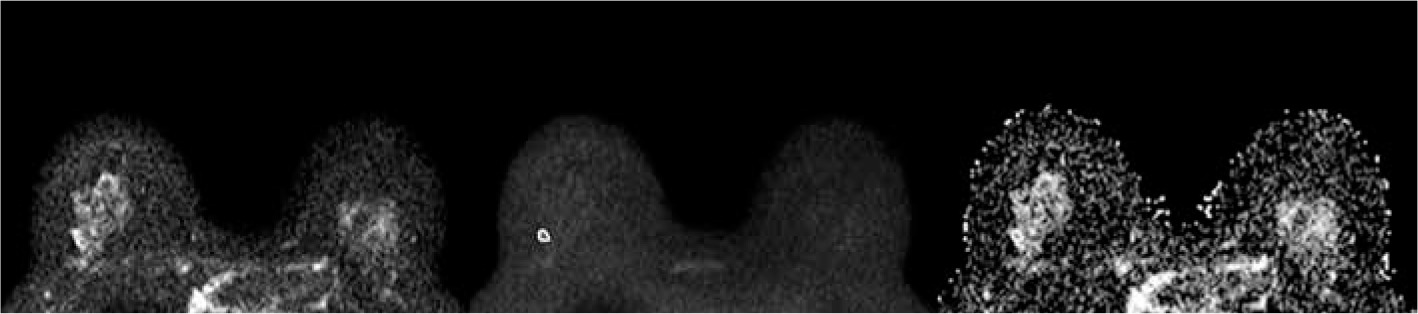
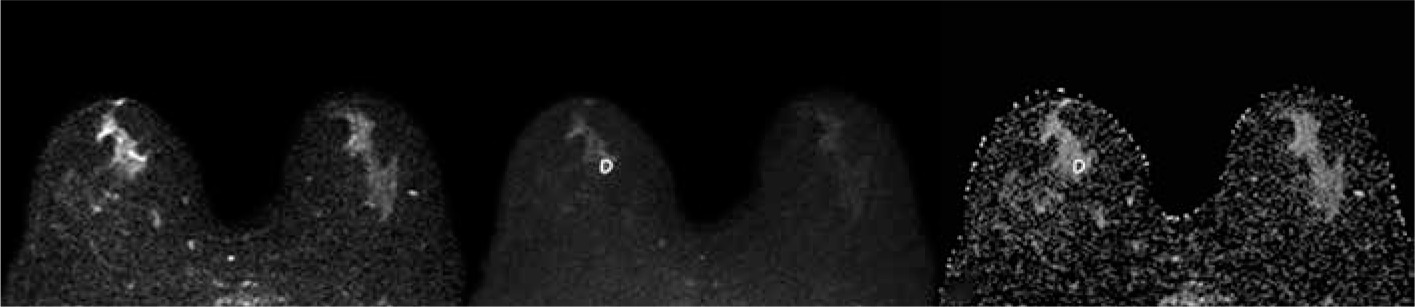
Figure 3
A 62-year-old woman with a 1.1-cm lesion in her right breast. The lesion appeared slightly hyperintense on DWIs obtained at b = 0 (A) and b = 800 (B), and hypointense on ADC map (ADCmean 1.081 × 10⁻³ mm2/s, ADCmin 0.722 × 10⁻³ mm2/s). It was diagnosed as atypical ductal hyperplasia at vacuum-assisted biopsy and upgraded to IDC at definitive histopathological examination after surgical excision
Statistical analysis
ADCmean and ADCmin values differences among B3 lesions are reported in Table 3.
Table 3
ADCmean and ADCmin values differences among B3 lesions
[i] ADC – apparent diffusion coefficient, AUC – area under the ROC curve, B3a+bWO – B3 lesions without upgrade at definitive histopathological examination (DHE), B3a+bW – B3 lesions with upgrade at DHE (upgrade to malignancy for B3b or, to malignancy or atypia for B3a lesions), B3aWO – B3a lesions without atypia or malignancy at DHE, B3aW – B3a lesions with atypia or malignancy at DHE, B3bWO – B3b lesions without malignancy at DHE, B3bW – B3b lesions with malignancy at DHE
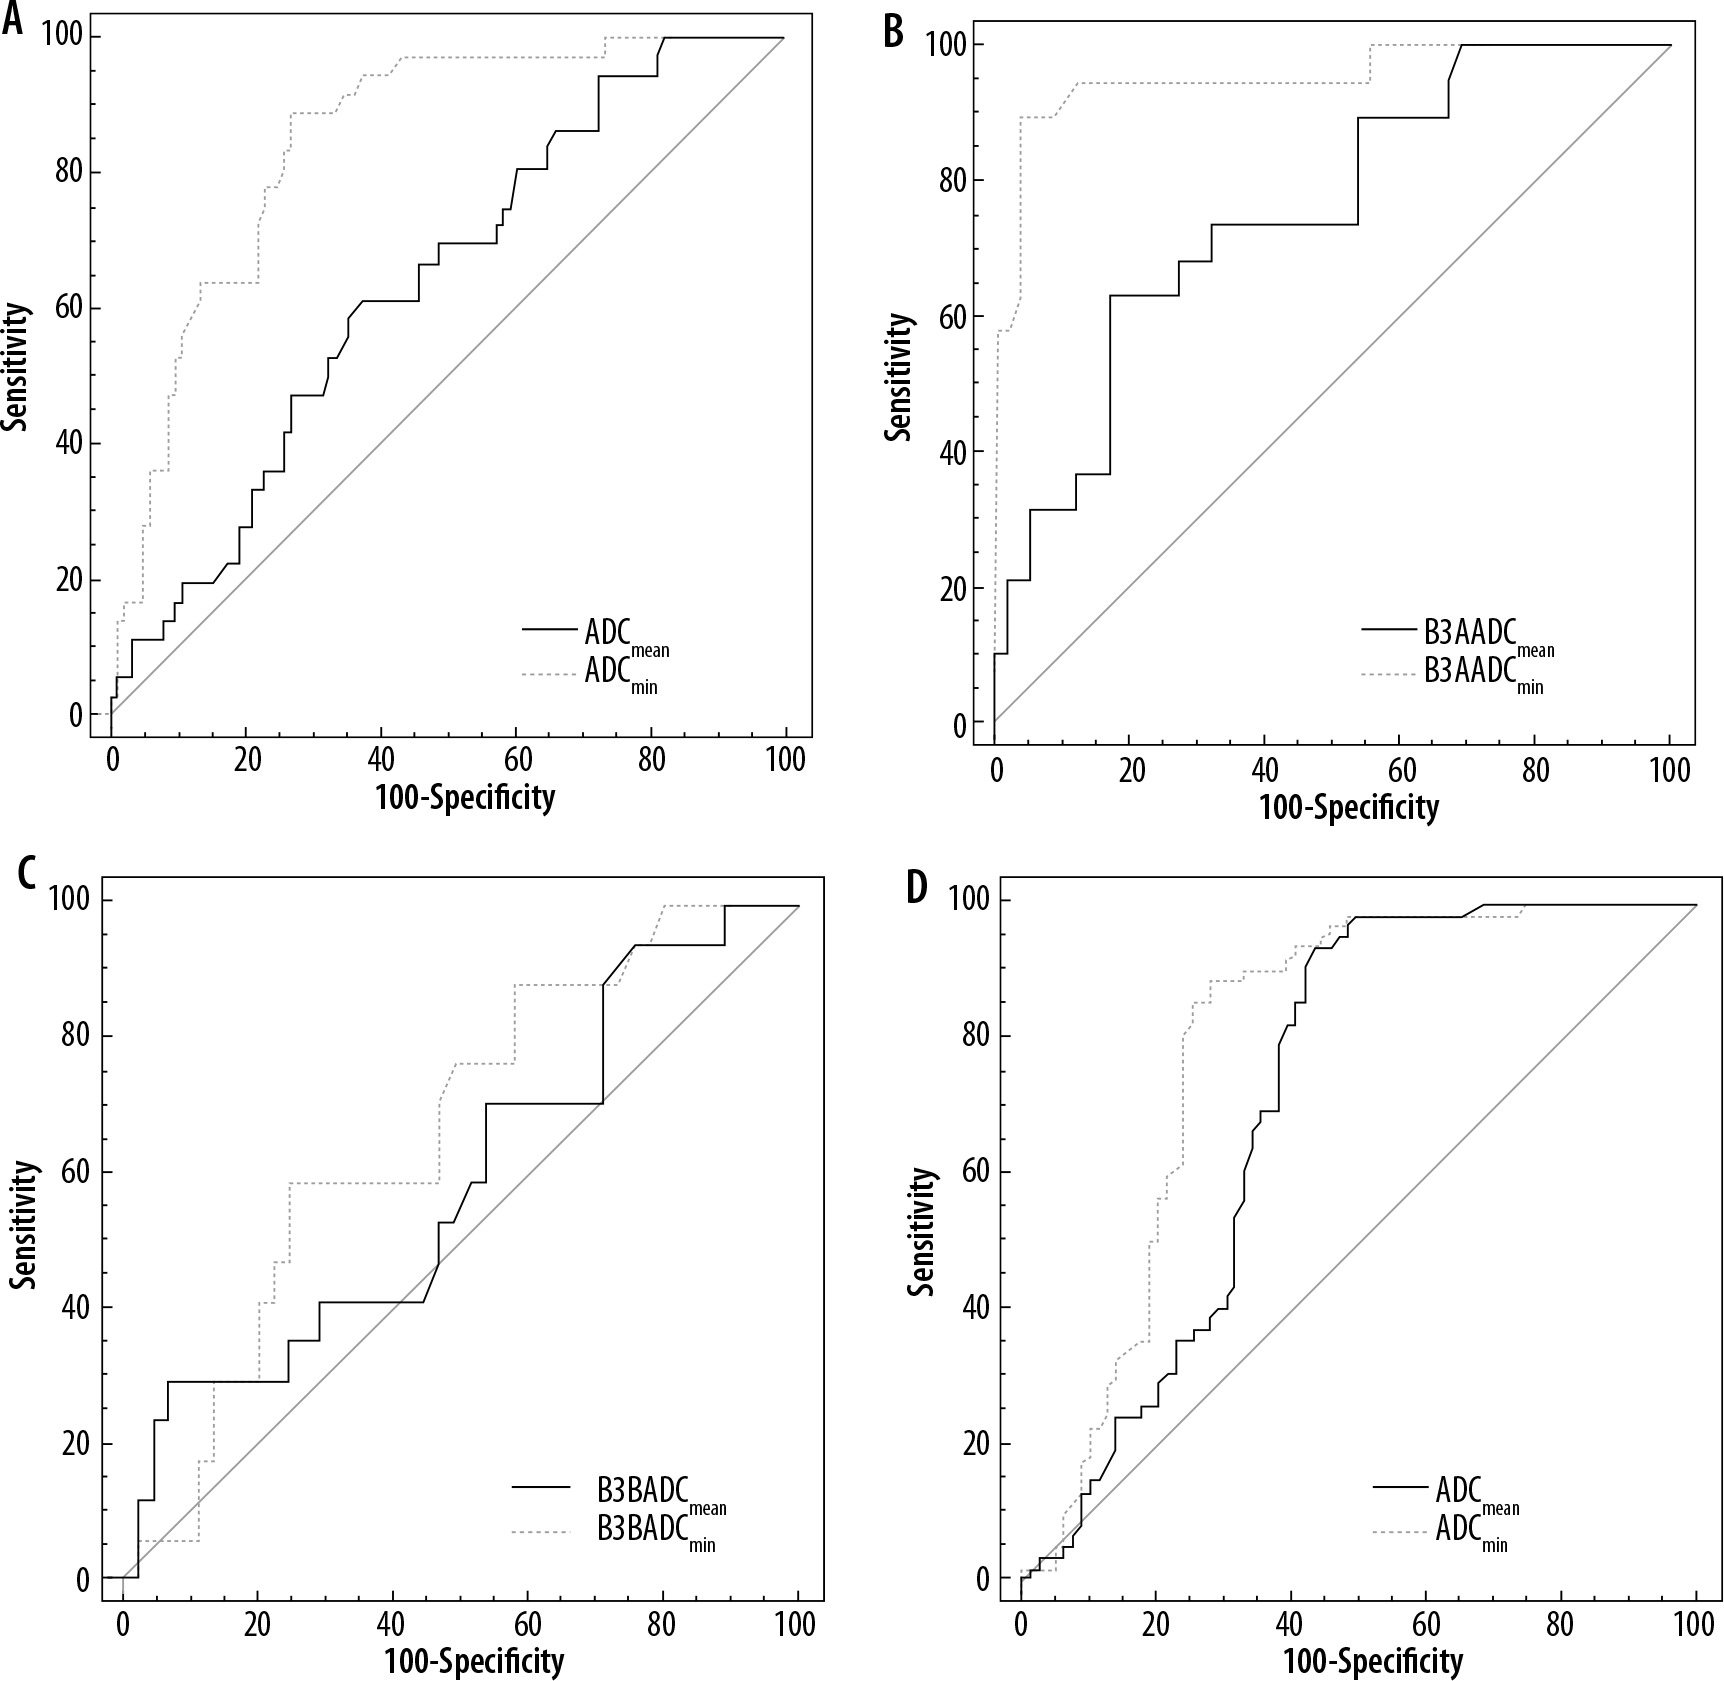
ADCmean and ADCmin AUC comparisons are shown in Figure 4.
Figure 4
AUC ADCmean and ADCmin comparison between: A) B3 lesions upgraded and not upgraded (to malignancy for B3b, and to malignancy or atypia for B3a at definitive histopathological examination showed statistically significant difference (p < 0.0001, z statistic 4.289); B) B3a lesions upgraded and not upgraded to malignancy or atypia at definitive histopathological examination showed statistically significant difference (p = 0.0005, z statistic 3.508); C) B3b lesions upgraded and not upgraded to malignancy at definitive histopathological examination did not showed statistically significant difference (p = 0.5120, z statistic 0.653); D) B3a and B3b lesions did not showed statistically significant difference (p = 0.0692, z statistic 1.817)
Discussion
DWI, quantified by ADC value, is an MRI technique that is used to evaluate the 3-dimensional mobility of water in vivo and enables indirect assessment of tissue microstructure. Advances in MR technology including echo-planar imaging, multichannel coils, and parallel imaging allowed the extension of the use of DWI in breast imaging, where it was first applied in 1997 by Englander et al. [18, 19].
In this study, ADC values were statistically different between B3 and B3a lesions without or with atypia or malignancy at DHE after surgical excision, between B3b lesions without or with malignancy at DHE, and between B3a and B3b lesions. The present study showed a better performance of the ADCmin value than ADCmean in predicting B3b lesions with malignancy at DHE or B3a lesions with atypia/malignancy at DHE.
The higher cellularity and the architectural changes of B3 lesions with associated atypia or malignancy could be the cause of the lower mean ADC values of these lesions, because in these conditions the motion of water molecules is more restricted [20-22].
Diffusion restriction and low ADC values have been correlated with the presence of malignant lesions on non-selected subjects [23-32], and previous studies showed that ADC values of normal breast tissue, benign lesions, and malignant lesions are related to the technical parameters of acquisition of MRI examination [33,34]. A previous study demonstrated that the mean ADC is significantly different between benign lesions and high-risk lesions [35].
In this study the patients underwent an MRI examination with a maximum DWI b value of 800 s/mm2. This value is commonly used in breast imaging [27] and was used in a previous study in this field [36].
To our knowledge, this is the first study that evaluated and found ADC value differences between B3b lesions without and with malignancy at DHE after surgical excision, or between B3a lesions without and with atypia /malignancy at DHE, regardless of BI-RADS category. Moreover, this study found ADC value differences between B3a and B3b lesions.
Only 1 previous study assessed and found a significant correlation between B3 lesions upgraded to malignancy at surgery and ADC value, but the ADC value was evaluated in 23 breast lesions classified as MRI BI-RADS categories 4 and 5 only [36].
A previous study reported a better performance of ADCmin value than ADCmean in distinguish between benign and malignant lesions, and our study confirmed a statistically significant difference between ADCmin and ADCmean performance, although in another setting, because it was reached in 2 out of 4 cases [37].
Regarding the possible clinical implications of our findings, we think that the ADC value, especially the ADCmin value, could be used to help guide the diagnostic-therapeutic pathway of these lesions. For example, B3 lesions with an ADC value under the thresholds reported in this study could be worthy of surgical excision or more frequent follow-up after VAB excision when the same MR scan and the same sequence settings are used. This could be particularly useful in patients who would otherwise not be referred for surgical excision or strict follow-up based on CNB results. In particular, our results show a possible clinical use of ADCmin in B3a lesions, in order to help discriminate those lesions that show atypical or malignant foci at DHE. Confirmation of such findings from future prospective studies is warranted.
The present study has some limitations. First of all, it is a single-centre retrospective analysis, with a limited number of patients. Furthermore, ADC value inter-observer variability, MRI BIRADS descriptors and assessment categories were not assessed. Moreover, we are aware of the fact that performing MRI after CNB could be a shortcoming. However, this could be considered more useful in a clinical setting, because in daily practice MRI examinations are more frequently performed after this procedures.