


Introduction
Computed tomography (CT) scanning dosimetry is the subject of many radiological protection reports [1,2] and scientific publications [3-7]. The importance of CT dosimetry is due to the fact that the CT scan contributes to the main portion of the cumulative dose in many countries (about 67% in the US and 68% in the UK), as well as a growing number of CT exams (about 12-fold in the UK and more than 20-fold in the US [8,9]), after the introduction of multi-detector CT (MDCT) scanners that make CT scanning an easy and fast imaging modality and provide better image quality [10]. Also, in comparison to other X-ray-based imaging techniques, CT scan delivers a greater dose to patients [11]. For example, a routine chest CT scan delivers about 100 times (or higher) the dose relative to a routine chest conventional radiography [12]. These reasons have made CT dosimetry very important.
The calculation of doses received by patients during a CT procedure is complex [13]. The CTDI indicates the dose transferred to the standard phantoms and the DLP is defined as the volumetric CTDI (CTDIv) multiplied by the scan length [5] . Although CTDI and DLP are commonly used dose descriptors, they have some disadvantages. The CTDIv is independent of patient’s body size and shape. Although, the DLP depends on the scan length it is not dependent on scan region, and radiosensitivity of organs/tissues is not considered [1,14,15]. The ED has been defined by the International Commission on Radiological Protection (ICRP) as an index that reflects the risk of non-uniform exposure in terms of an equivalent whole-body exposure and takes into account the radiosensitivity of organs/tissues. With the use of the ED, the comparison between the risks of different imaging modalities has been made possible [15,16].
Various local and national studies on CT dosimetry indicate that head and neck CT examinations are very common imaging protocols [17] and overall comprise about 25 to 30% of all CT procedures [8,11]. Pantos et al. [18] reviewed 42 CT dosimetry publications and indicated the wide range (0.3-8.2 mSv) of the ED from head CT examinations. Smith-Bindman et al. [12] reported that this value for a routine head scan ranged from 0.27 to 5.8 mSv and for a routine neck scan from 0.78 to 8.8 mSv. They indicated the ED from head and neck examinations are variable, depending on scan parameters and scanner specifications.
From the above-mentioned view and considering the importance of CT dosimetry, the objective of this study was to estimate ED from the non-contrast head and neck CT examinations in routine clinical trials in four general hospitals with different CT scanners equipped with different numbers of detector rows, and to compare them with each other and with the other reports. In order to have a precise comparison between CT scanners, we also evaluated image quality parameters and ImPACT Q-factor, which relates image quality parameters with the dose. Q-factor is a good indicator that gathers all data together and makes the comparison between CT scanners possible [19].
Material and methods
CT scanners
Four CT scanners including a 4-MDCT, a 6-MDCT, a 16-MDCT, and a 64-MDCT were investigated in the present study. All CT scanners used in this study were manufactured by Siemens HealthCare (namely Somatom Sensation 4, Somatom Emotion 6, Somatom Emotion 16, and Somatom Sensation 64). The scanners’ specifications are presented in Table 1.
Table 1
CT scanner characteristics utilised in this study
Patient selection
Questionnaires for a total of 169 adult patients (107 head scans and 62 neck scans) were investigated in four general hospitals during one month, to extract routine head and neck protocols in each exam. Through the questionnaires, the tube potential, tube current time, collimation, pitch factor, and the scan length were recorded. The average of scanning parameters was used for dosimetry purposes. Characteristics of the scan protocols are indicated in Table 2.
Table 2
Characteristics of scan protocols included in the study
Dosimetry and ED calculation
The CTDI100 for the head and neck examinations with the average of scan parameters were measured using a calibrated pencil ionization chamber (model DCT-10 RS, Rti electronics, Sweden) with an active length of 100 mm. For CTDI100 measurements we used a standard cylindrical polymethyl methacrylate (PMMA) head phantom with a diameter of 16 cm, which has a hole to measure CTDI100 in the centre (CTDI100,c) and four holes near the surface (≈1 cm) to measure CTDI100 on the periphery (CTDI100,p). After the measurements we calculated weighted CTDI (CTDIw) with the aim of Equation 1:
CTDIw = 1/3 (CTDI100,c) + 2/3 (CTDI100,p).
To draw a comparison between CT scanners, we used the normalised CTDIw (nCTDIw) to tube current time (mAs). The CTDIv was calculated with CTDIw divided by pitch factor for each scanner. Also, the DLP was calculated by multiplying the CTDIv by the scan length. Finally, EDs were obtained by multiplying the most recent DLP to ED conversion factor published by Deak el al. [20]. The conversion factor for head and neck examinations for adults in tube potential range of 100-120 kV are 0.0019 and 0.0051 mSv/mGy × cm, respectively [20].
Quality-control parameters
In order to have a good comparison between procedures, we used the ImPACT Q-factor, which relates image quality characteristics such as image noise and spatial resolution of images to dose (Equation 2):
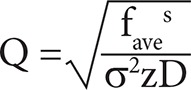
In this equation fave demonstrates spatial resolution, σ demonstrates image noise expressed as a percentage, for water phantom: σ ([HU]/10) [19], the z demonstrates slice width (mm), and the D demonstrates radiation dose (CTDIv (mGy)) [19,21].
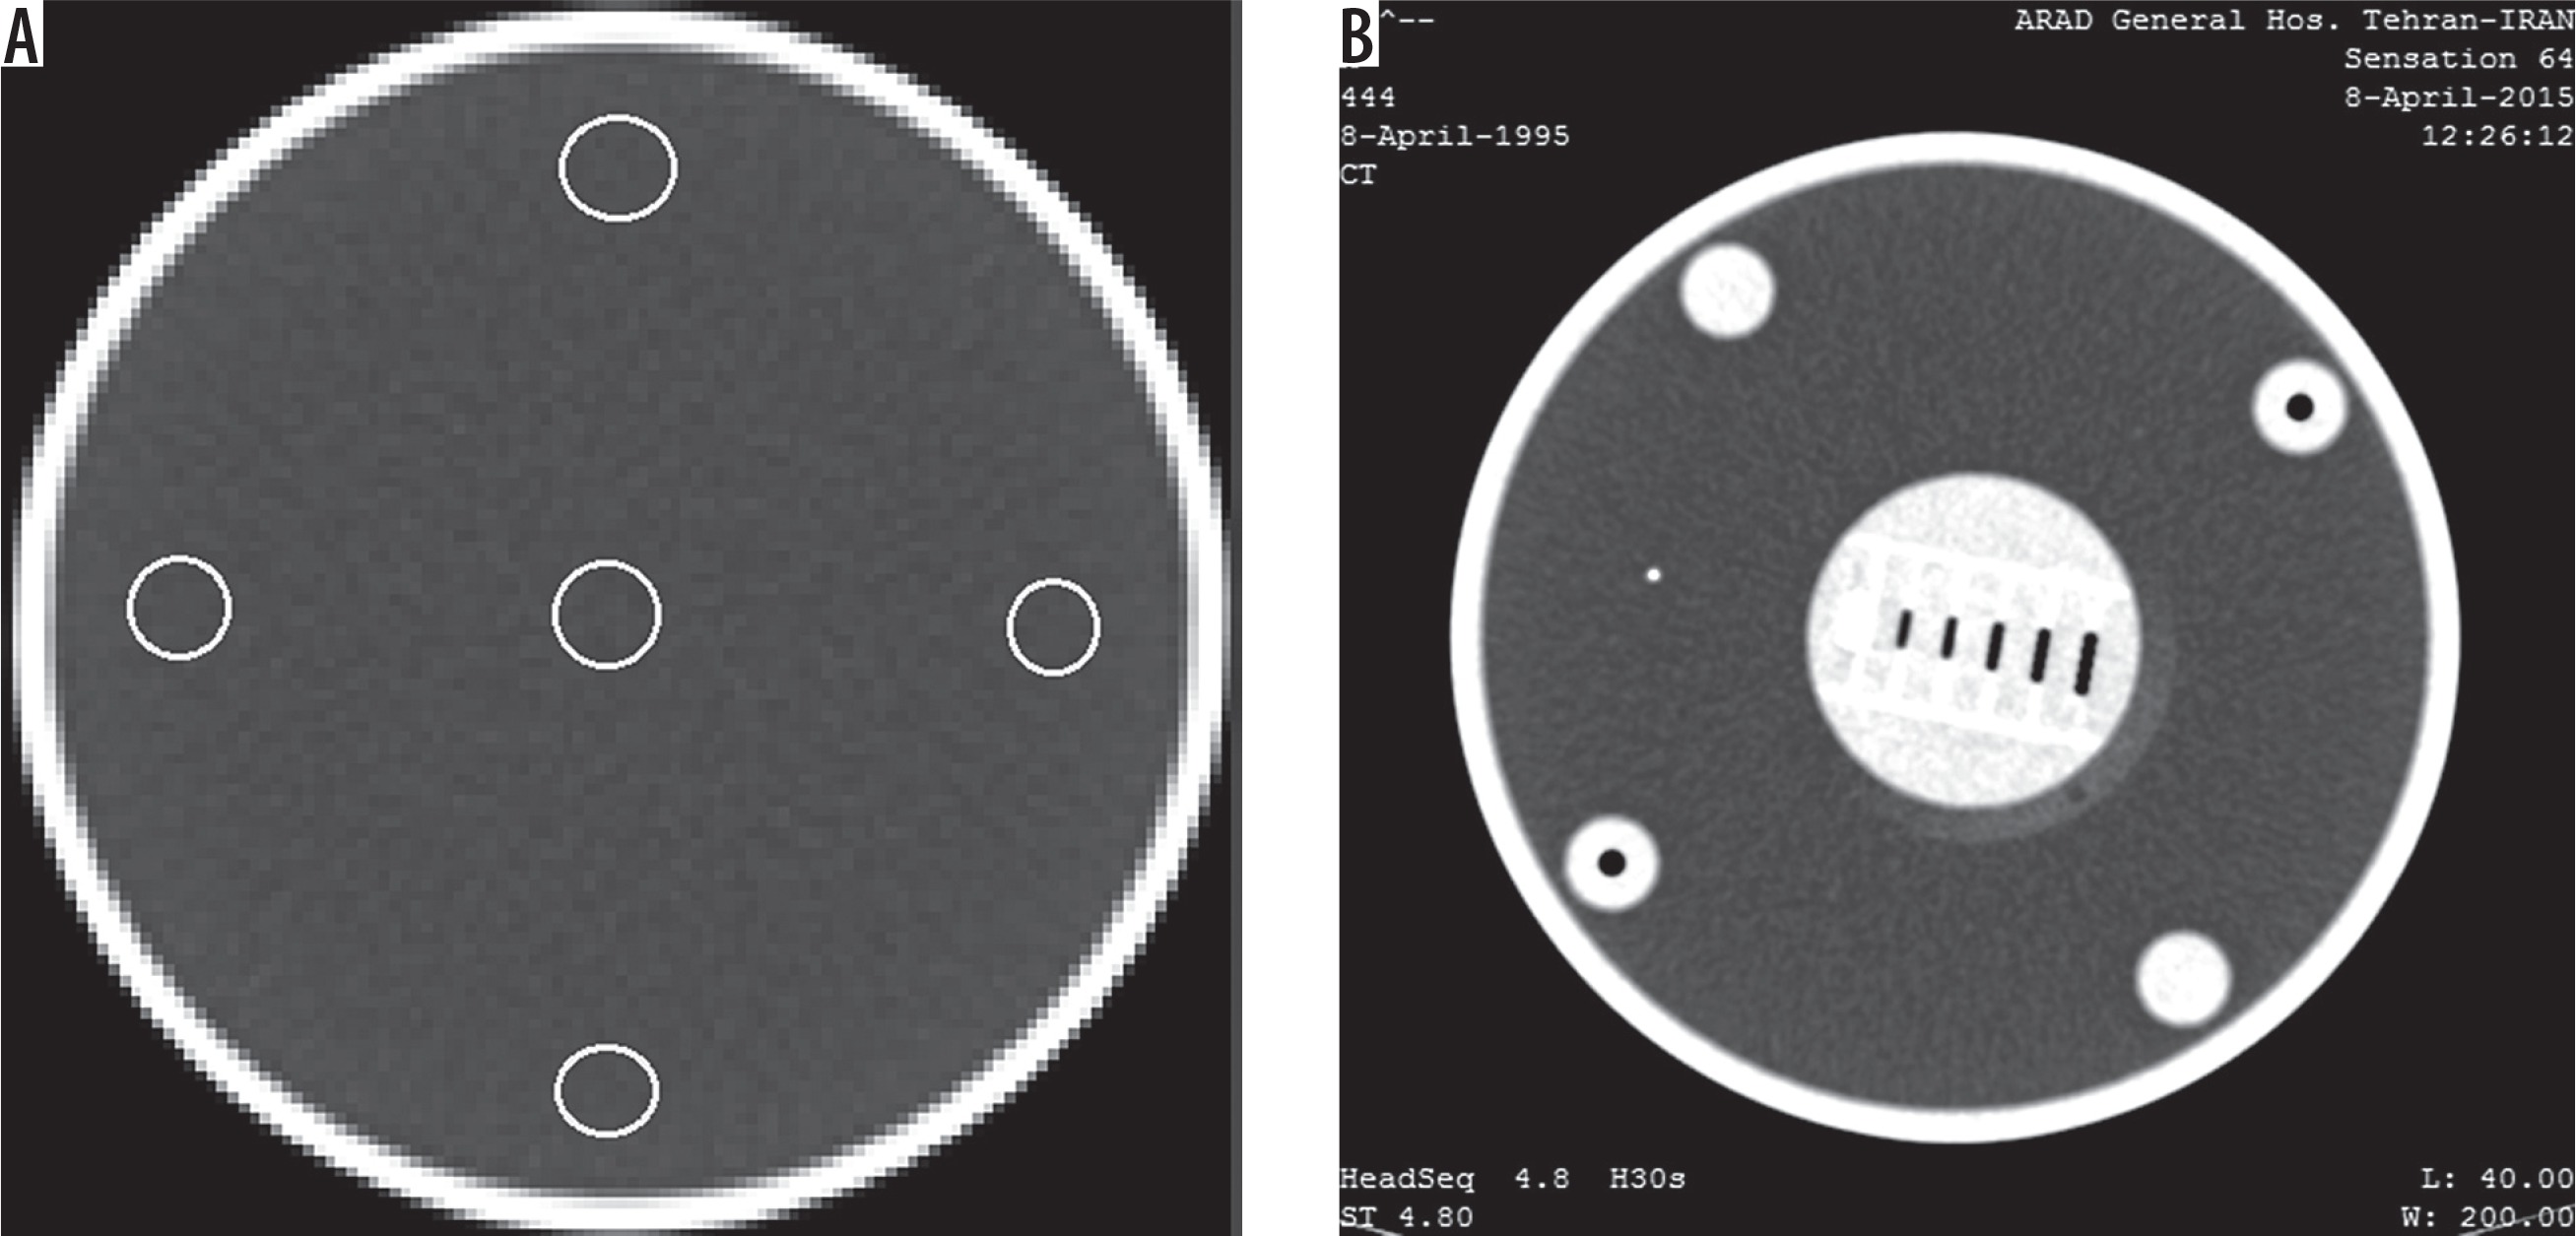
Noise is the standard deviation of CT numbers (HU) in the selected region of interest in a medium. The common medium for noise assessments is water. Standard variation for image’s noise in the centre of a water phantom is ± 3 HU. CT number and standard deviation of CT numbers in the centre and four peripheral regions (middle, top, bottom, right, and left near the surface of the phantom) were estimated in the centric slice of a standard water phantom with a diameter of 16 cm. The average of noise in those five ROIs was considered as image noise. Through this method image uniformity can also be assessed. Image uniformity is necessary to know whether or not beam hardening or cupping artifacts exist [22]. For uniformity evaluations, differences between mean CT numbers at any ROI around the phantom and the centre should not exceed ± 5 HU [23]. To assess SR, the phantom had an object with circles with different diameters and includes 3, 4, 5, 6 and 7 circles/cm (Figure 1). For calculation of fave, modulation transform function (MTF) curves were drawn with the method described in the literature [24], and the average of spatial frequency at MTF50 and MTF10 ([MTF50 + MTF10]/2) was used for Q-factor calculation. A higher Q-factor indicates that the scanning protocol has good image quality and/or fewer doses, and a lower one has lower image quality and/or delivers a higher dose to the patient [21]. All images investigated in this study were reconstructed with H30 (H referring to head phantom) reconstruction kernel.
Statistical analyses
One-way ANOVA test between normally distributed values and Kruskal-Wallis test between nonparametric values were performed between four CT scanners to assess statistical differences between the resulting values. Differences at p-value < 0.05 were considered as significant. Before that, Kolmogorov-Smirnov test (K-S test) was performed to show whether or not the values had a normal distribution.
Results
A total of 169 patients for non-contrast head and neck CT examinations in four general hospitals were investigated. All patients were adults with the mean (range) age of 51 (24-79) years and were normal in height and weight. All CT procedures were without injection of any contrast material and were not repeated (one scan performed per patient). All head scans were axial scans, all neck scans were spiral, and no tube current modulation (TCM) systems were used.
The CTDI100 values were measured and CTDIw values were calculated according to Equation 1. Calculated CTDIw values in head scans were 32 ± 4, 27 ± 2, 18 ± 3, and 49 ± 4 mGy for 4-MDCT, 6-MDCT, 16-MDCT, and 64-MDCT scanners, respectively. The CTDIw values in neck scans were 24 ± 9, 18 ± 3, 16 ± 2, and 27 ± 3 mGy for 4-MDCT, 6-MDCT, 16-MDCT, and 64-MDCT scanners, respectively. To compare CT scanners output, normalised CTDIw (nCTDIw) to tube current-time (mAs) was used. Results of normalised values (mGy per mAs) for both head and neck examinations are shown in Figures 2A and 2B, respectively. The CTDIv, DLP, and ED were calculated with methods described in the previous section, presented in Table 3. Also, image quality parameters were evaluated, and the results are presented in Table 3. To calculate fave, MTF50 and MTF10 were extracted from MTF curves (Figures 3A and 3B).
Table 3
The CTDIv, DLP, ED, Noise, fave, and Q-factor for all participating CT scanners
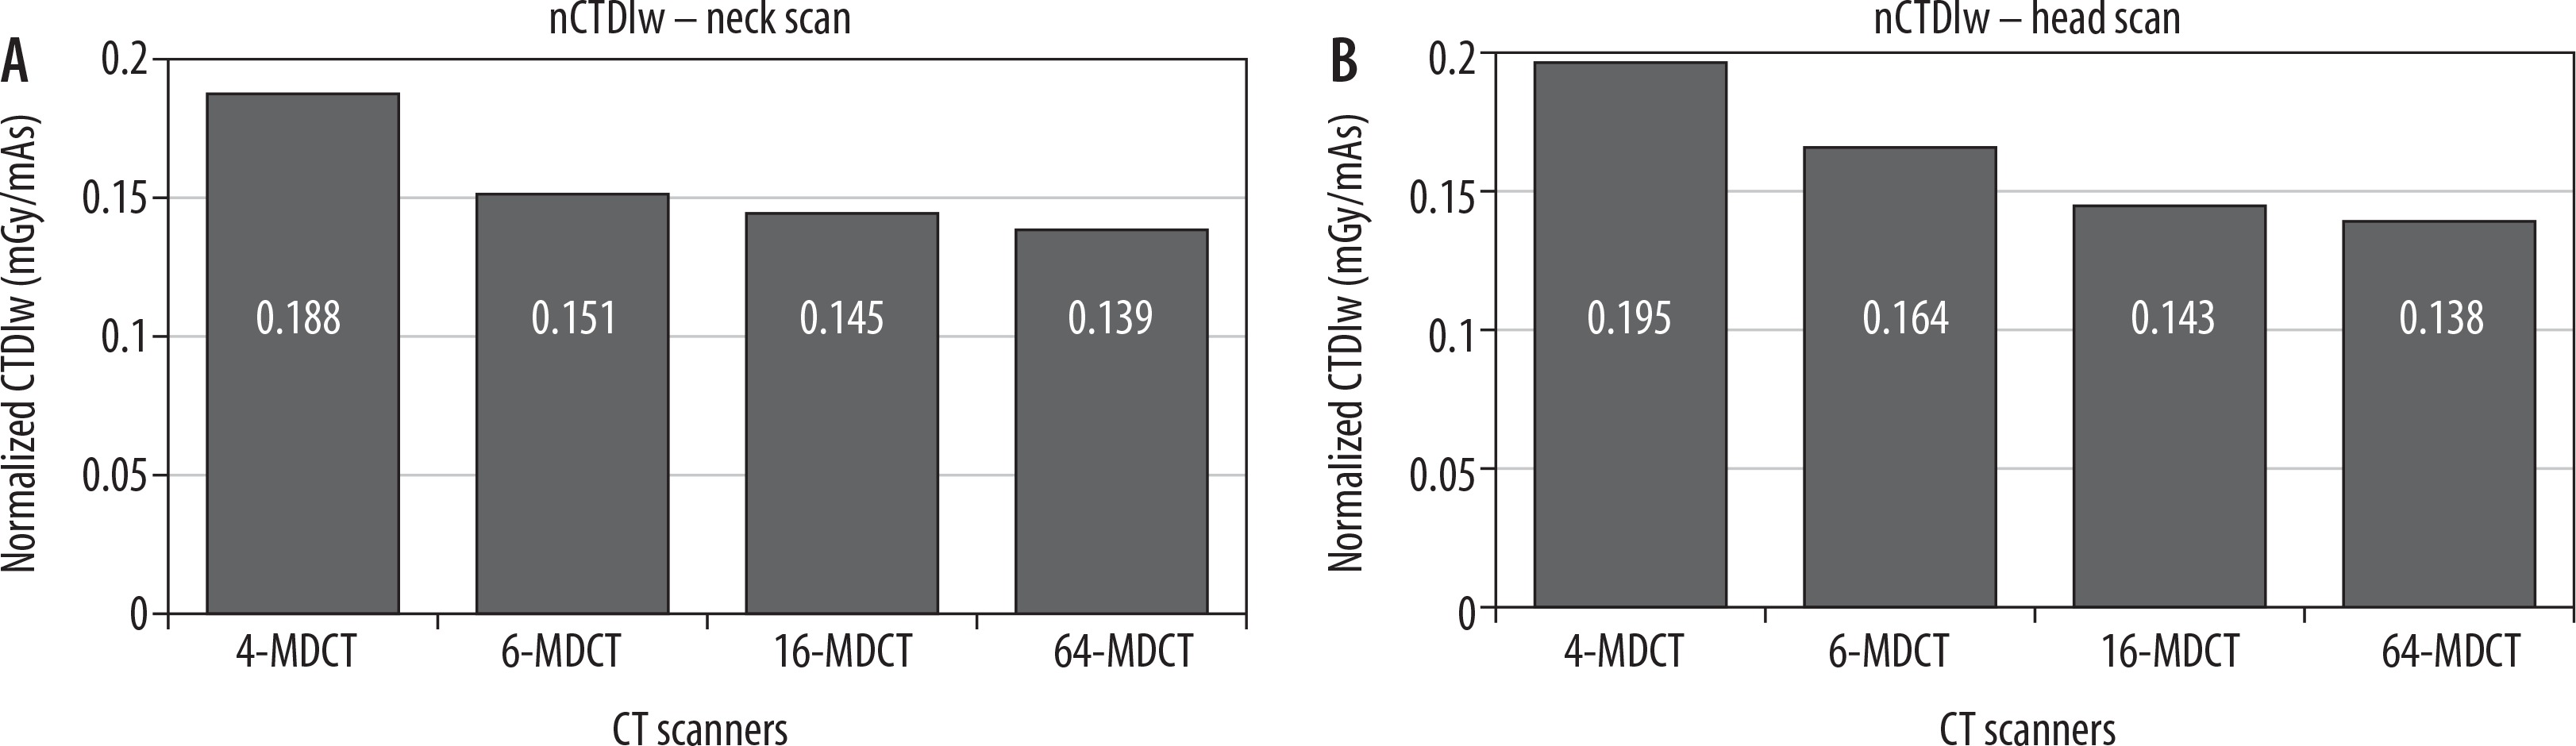
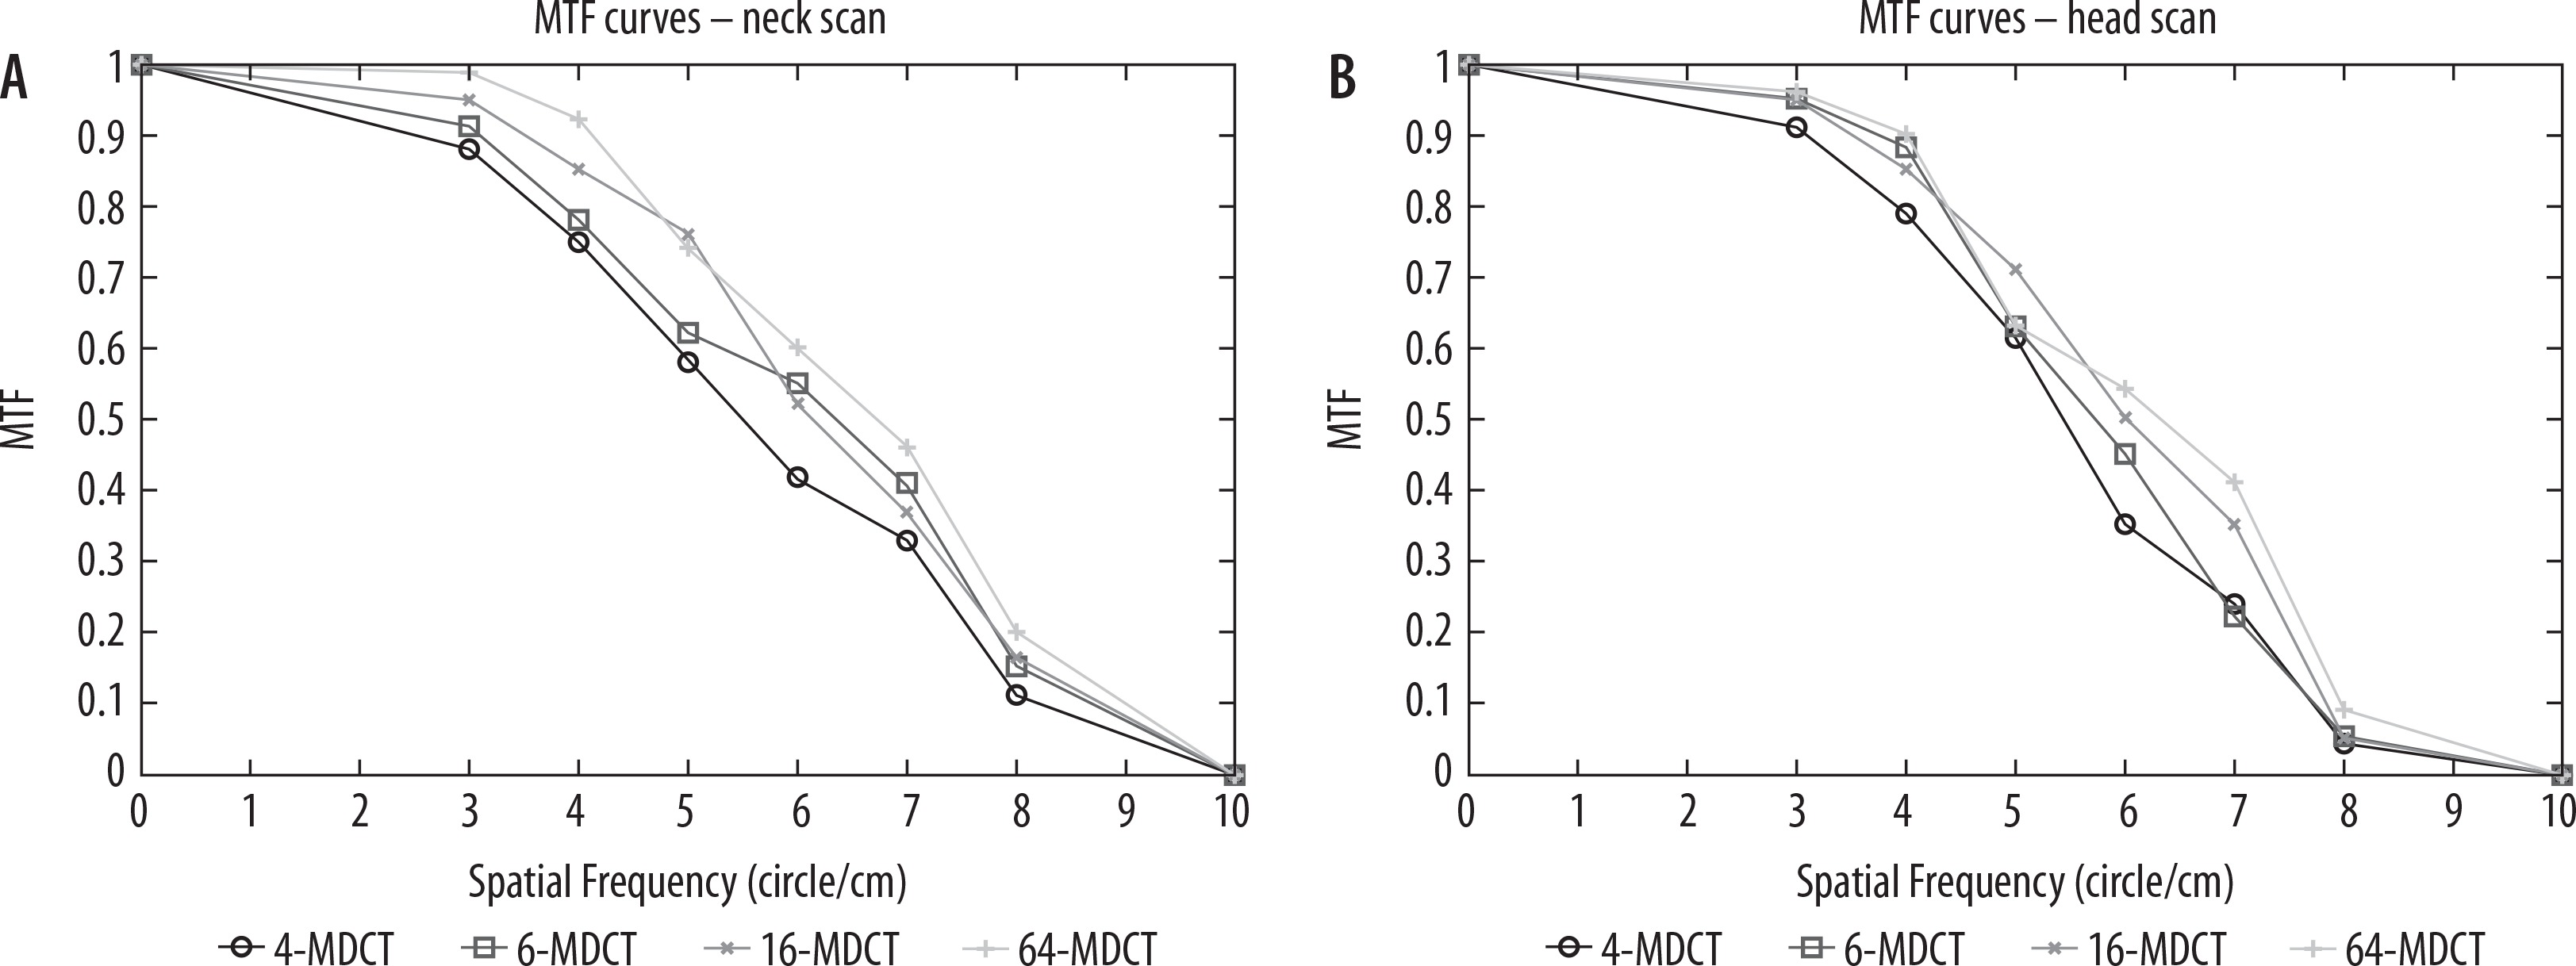
Image uniformity tests were performed for each protocol on each CT scanner. The CT number in the centre of the phantom and the mean of the CT numbers of peripheral regions and the variation between them are presented in Table 4.
Table 4
The computed tomography (CT) numbers and their variations in the centre and peripheral of the phantom
Statistical analyses indicate normal distribution in the scan length and tube current-time (mAs) in the neck scan. The rest of our data for both head and neck scans did not present normal distribution; therefore, nonparametric tests were done for those data.
In the case of the head scan, the differences between the mAs, CTDIv, DLP, and ED between four CT scanners were significant (p < 0.05). The differences between the scan lengths were not found to be significant (p > 0.05).
In the neck scan, the differences between the scan lengths in all of the CT scanners, except between the 16-MDCT and 64-MDCT, were significant (p < 0.05). The differences between tube current time (mAs) between the 4-MDCT and 6-MDCT, and between the 6-MDCT and 16-MDCT did not reach significant levels (p > 0.05). The differences of the CTDIv between the 4-MDCT and 64-MDCT, and between 6-MDCT and 16-MDCT were not found to be significant (p > 0.05). The difference between the DLP and ED in all of the CT scanners was also significant (p < 0.05).
Discussion
The aim of this study was to estimate common CT dose descriptors including the CTDIv, DLP, and ED and to assess the image quality parameters in non-contrast head and neck CT examinations in different hospitals with different CT scanners. We graded each scanner with ImPACT Q-factor to compare with each other. The overall mean values were compared with other studies.
In the case of image quality, all taken images were uniform, and no cupping artifact was observed on all CT scanners (Table 4). Noise levels in all scanners, except 64-MDCT, were beyond the standard level (± 3 HU). The 64-MDCT has less noise compared to other CT scanners. Given that noise is inversely proportional to the number of photons (mAs) (31) received by the detectors, using high tube current-time (mAs) in 64-MDCT leads to less noise. The high mAs values used in 64-MDCT leads to high CTDIv, DLP, and ED values. Although 64-MDCT delivers a higher dose comparing to the other CT scanners, less noise and better SR lead to high Q-factor on this scanner in both head and neck examinations (Tables 2 and 3).
The calculated nCTDIwvalues indicate a decreasing trend from 4-MDCT to 64-MDCT in both head and neck examinations (Figure 2). These changes in the nCTDIw values among different CT scanners have also been reported by other researchers and might be related to beam geometry, radiation quality, absorption, and scattered X-rays for different scanners. Also, slice thickness could cause those differences [25]. Parsi et al. [26] reported the range of nCTDIw for a wide range of CT scanners. According to their report nCTDIw varies 0.19–0.20, 0.06–0.20, 0.16–0.22, and 0.10–0.15 for Somatom Sensation 4, Somatom Emotion 6, Somatom Emotion 16, and Somatom Sensation 64, respectively. Our nCTDIw values are within range of or near their reported values. Lee et al. nCTDIw reported values of 0.28 and 0.23 (mGy/100 mAs) in 120 kVp for Somatom Sensation 4 and Somatom Sensation 64, respectively. Our values are less than their reported values.
In the case of head scan, overall, the mean values of the CTDIv, DLP, and ED were lower than those of other research studies summarised in Table 5. Sohrabi et al. [27] recently proposed a National Diagnostic Reference Level (NDRL) for some CT procedures, comprising head scans. They proposed the values of 58 mGy and 750 mGy for the CTDIv and DLP, respectively. In this case, our values are lower than the NDRL of Iran (Table 5).
Table 5
International CTDIv, DLP, and ED comparison
| Head scan | CTDIv | DLP | ED | Neck scan | CTDIv | DLP | ED |
|---|---|---|---|---|---|---|---|
| This study (2016)◾ ** | 31 | 433 | 0.8 | This study (2016)◾** | 21 | 440 | 2.3 |
| UK (2003)◾* | 56 | 690 | 1.5 | UK (2011)◾ | 24 | 525 | – |
| UK (2011)◾ | 58 | 890 | – | East Anglia (2002)◾* | 330 | 3.2 | |
| Italy (2014)◾ | 64 | 1086 | – | Netherlands (2013) ◻** | 329 | 1.7 | |
| India (2014)◾ | 32 | 875 | – | ||||
| Ireland (2012)◾ | 64 | 857 | – | ||||
| East Anglia (2002)◾* | – | 760 | 1.7 | ||||
| Taiwan (2007)◾* | – | 665 | 1.6 | ||||
| Sudan (2011)◾* | 65.4 | 758 | 1.6 | ||||
| Tanzania (2006)◾* | – | 912 | 2.1 | ||||
| Netherlands (2013) ◻** | – | 813 | 1.5 |
Regarding the neck scan, our results indicate that, overall, the DLP were higher than values from East Anglia and the Netherlands, and were lower than the UK reported values. Our ED values were higher than the reported values from the Netherlands and lower than those from East Anglia (Table 5).
Conclusions
There has been a tremendous increase in the use of the CT scans in the last two decades after the introduction of multi-detector CT scanners. Alongside this fact, concerns about the side effects of the use of ionization radiation on the patients have increased. According to the ALARA (as low as reasonably achievable) principle, techniques should create a balance between dose and imaging quality.
In the present study non-contrast head and neck CT examinations were investigated in terms of dose and image quality. Radiation doses arising from four different CT scanners with different detector array configurations were evaluated, and protocols were graded with the ImPACT Q-factor.
Our results indicate that the nCTDIw values in 64-MDCT are lower than other CT scanners investigated in the study, for both head and neck scans. An increasing trend in the Q-factor from 4-MDCT to 64-MDCT units in both head and neck examinations was clearly observed. This increasing trend seems to be due to a better spatial resolution and less noise of images taken by 64-MDCT.