


Introduction
A new coronavirus, severe acute respiratory syndrome coronavirus 2 (SARS-CoV-2), was first reported from Wuhan, China, in December 2019, and then quickly spread to other countries around the world [1]. It is an enveloped RNA virus responsible for SARS-CoV-2 disease, denominated COVID-19. Clinical expression of the disease ranges from asymptomatic to a severe life-threatening course [2]. The dominant clinical presentation is characterized by high temperature and cough [3]. Up to 5.0% of the patients were admitted to intensive care units, 2.3% of them underwent invasive mechanical ventilation, and 1.4% of the patients died [1]. At present, real-time polymerase chain reaction testing (RT-PCR) for SARS-CoV-2 is the standard for diagnostic confirmation [4]. Imaging plays an important role in the diagnosis: ultrasound (US) and chest radiography (CXR) are offered as the first step; computed tomography (CT) is reserved for more severe cases or cases of discrepancy between clinical and radiographic findings, especially in the early stage where a swab test may be negative [5]. Our study aimed to systematically evaluate and compare the imaging findings of COVID-19 detected in 23 patients admitted to our hospital who underwent CXR, lung US and chest CT examinations. In addition, we have provided a complete overview of the literature to compare our results with recent evidence regarding the imaging features of this novel disease.
Material and methods
Patients
Our retrospective study was approved by the local institutional review board. From March 17, 2020, to April 25, 2020, a total of twenty-three patients (13 men, 10 women; age range, 53 to 84 years; mean age 72.7 years) with COVID-19 confirmed by RT-PCR assay and hospitalized in San Giuseppe Moscati Hospital (Aversa, Italy), were included. All patients underwent a chest radiological evaluation upon admission to our Emergency Department using chest CT and/or CXR and/or lung US. Clinical and laboratory data were also evaluated.
Image acquisition
Bedside lung US was performed in the Emergency Department using low frequency (2-5 MHz) convex probe and high frequency (5-10 MHz) linear probe. CXR was performed in the posteroanterior projection at full inspiration or in the anteroposterior projection in the supine patients. Chest CT examination was performed using a multi-detector CT scanner with 16 channels located in the emergency room and used exclusively for COVID-19 patients. The following were used as CT acquisition parameters: tube voltage of 120 kVp; tube current, standard (reference mAs, 60-120); slice thickness, 1.0 mm; reconstruction interval of 1.0 mm. The acquisition of all CT images was performed during full inspiration with the patient in full inspiration and without IV contrast medium.
Image analysis
All lung US, CXR, and CT images were reassessed by two expert thoracic radiologists in consensus (S.G. and F.D. with 27 and 14 years of experience in thoracic radiology). The following lung US findings were investigated: A-lines, B-lines, thickened pleural line, pleural consolidation, and effusion. CXR and CT features were classified according to the Fleischner Society Glossary [6]. The following chest radiographic findings were evaluated: hazy increased lung opacity, consolidation, and pleural effusion. CT images were analyzed in the pulmonary window, with a width of 1500 Hounsfield units (HU) and a level of –600 HU, and in the mediastinal window, using a width of 350 HU and a level of 50 HU. The following CT findings were assessed: distribution (peripheral, central or both), involved lung lobes (right upper lobe, middle lobe, lower lobe, left upper lobe, lower lobe), number of lobes involved (one, two, three, four, five), appearance (ground-glass opacity, consolidation, ground-glass opacity with consolidation), specific signs (air bronchogram sign, “crazy-paving” pattern, architectural distortion, fibrous stripes, subpleural lines, vascular thickening, and nodules), and extra-pulmonary alterations (pleural effusion and mediastinal enlarged lymph nodes).
Results
Patient population and imaging examinations
All twenty-three patients presented with clinical manifestations upon admission, including fever in twenty-three patients (100%), cough in eleven patients (48%), dyspnea in ten patients (43%), and fatigue in thirteen patients (56%). Laboratory tests showed low levels of lymphocytes in twenty patients (87%) and high C-reactive protein levels in twenty-two patients (91%). Available imaging examinations performed for each patient were as follows: CXR alone from six patients, CT alone from seven patients, while a combination of lung US and chest X-ray in two patients, lung US and chest CT in six patients, chest X-ray and CT in five patients and lung US, chest X-ray and CT in three patients.
US features
Bedside lung US was performed in eleven patients. In ten cases (91%), US showed various B-line patterns (focal, multifocal, confluent) with bilateral distribution, which indicated filling of intralobular or interlobular septa or opacities that did not obscure the underlying bronchial and lung structures. In five patients (45%) a subpleural consolidation was observed while in two cases (18%) US showed a thickened pleural line. In one case (9%), a mixed pattern was highlighted with A- and B-lines. Moreover, in one patient (9%), pleural effusion was also observed. Of these patients, chest X-ray was performed in five patients while chest CT was performed in nine patients; bilateral consolidations or hazy increased opacities were observed in chest X-ray examination (Figure 1) while bilateral ground-glass opacities (GGO) with consolidations were highlighted at CT evaluation (Figures 2 and 3). Detailed lung US findings are reported in Table 1.
Figure 1
A) Lung ultrasound with convex probe shows irregular pleural surface and multiple B lines. B) Chest X-ray shows bilateral, central and peripheral, lung opacities. C, D) Axial chest computed tomography images show patchy bilateral ground-glass opacities with interlobular septal and intralobular interstitial thickening (“crazy-paving” pattern) in the upper lobes, mainly peripheral and more consolidated areas
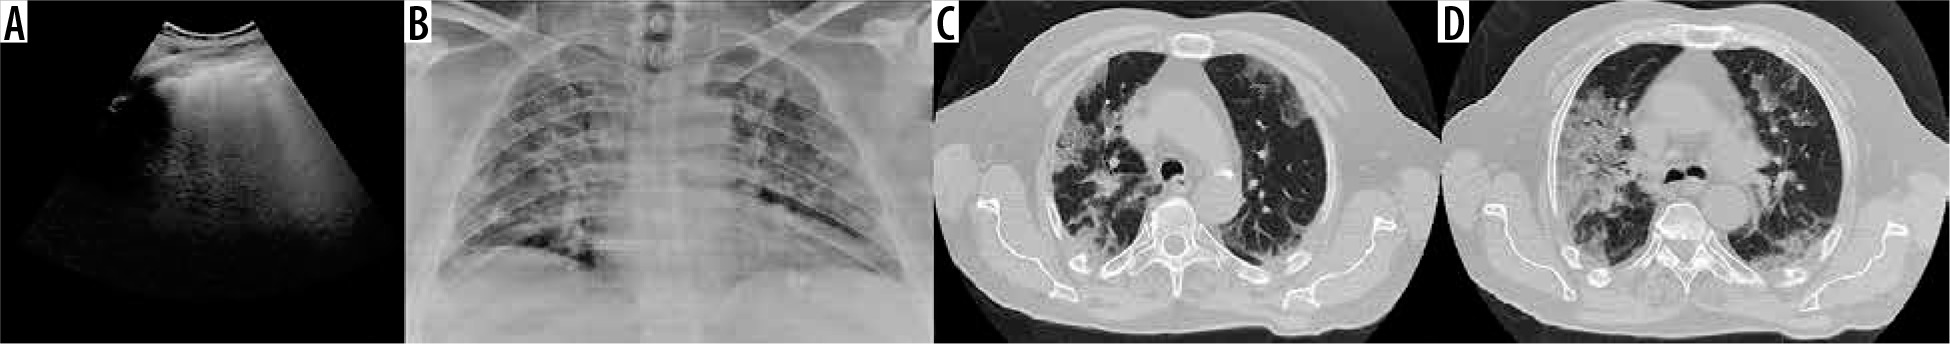
Figure 2
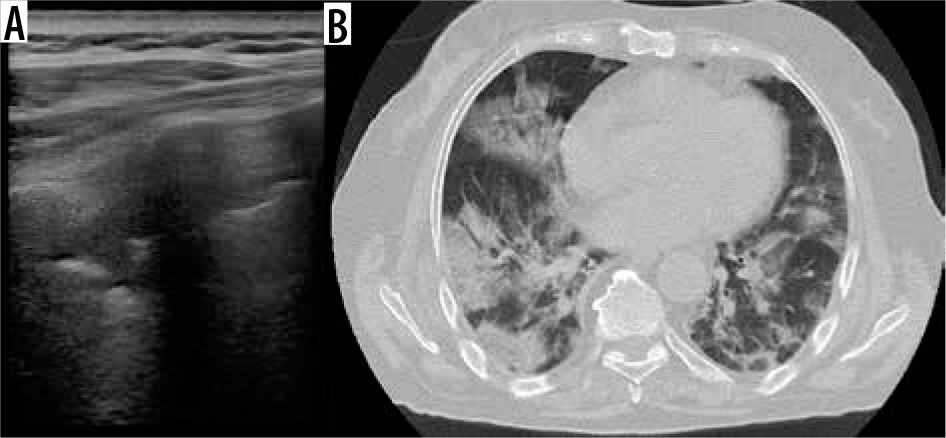
A) Lung ultrasound shows pleural line irregularities and confluent vertical artifacts (B-lines). B, C) Chest computed tomography axial images show bilateral and peripheral ground-glass opacities with “crazy-paving” pattern and air bronchogram sign in the lower lobes

Chest X-ray findings
CXR was performed in a total of sixteen patients. Of these, two patients (12%) showed no abnormalities, although chest CT performed on the same day allowed bilateral GGO to be identified. In the remaining cases, eight patients (50%) showed a consolidation while in six patients (37%) a hazy increased opacity was identified; no pleural effusion was detected. The distribution of these features was bilateral in thirteen cases (81%) and unilateral in one patient (6%). Moreover, the lower lobes were involved in eight patients (50%), while similar lower and upper zone involvement was observed in six cases (37%) and upper zone involvement in only one patient (6%). Among these patients, CT was performed on the same day in eight patients, showing correlated characteristics, especially bilateral GGO with consolidations predominantly involving the lower lobes (Figure 1). Detailed results of CXR findings are shown in Table 2.
Table 2
Chest X-ray findings and results (N = 16)
CT findings
Twenty-one patients underwent a chest CT examination, which showed abnormalities in all cases. The most common CT findings were GGO (Figure 4), detected in 21 cases (100%); among them, 16 (76%) also showed concomitant consolidations (Figure 5). In all patients the lesions involved both lungs, generally 5 lobes (76%), in particular, the right lower lobe (100%) and the left lower lobe (100%), with a prevalent peripheral distribution in twenty-one cases (100%) while both peripheral and central localization was detected in sixteen patients (76%). Specific lung CT findings were observed such as air bronchogram sign (Figures 5 and 6) in sixteen patients (76%), “crazy paving” pattern (Figure 6) in twelve patients (57%), perilesional vascular thickening in ten patients (47%), subpleural lines in eight patients (38%), architectural distortion in four patients (19%), fibrous stripes in four cases (19%) and nodules in two cases (9%). Among extrapulmonary CT features, enlarged mediastinal lymph nodes were detected in twelve patients (57%) and pleural effusion in two patients (9%). Detailed CT findings are reported in Table 3.
Figure 4
Chest computed tomography axial image shows patchy bilateral and peripheral ground-glass opacities
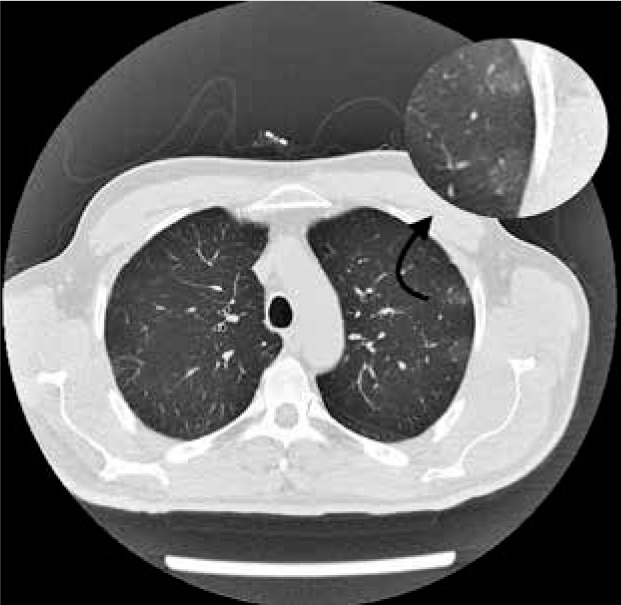
Figure 5
Chest computed tomography axial image shows bilateral and diffuse ground-glass opacities and more consolidated areas with air bronchogram sign

Figure 6
Chest computed tomography axial image shows bilateral and diffuse ground-glass opacities with superimposed interlobular septal thickening and intralobular septal thickening (“crazy paving” pattern) and more consolidated areas with air bronchogram sign
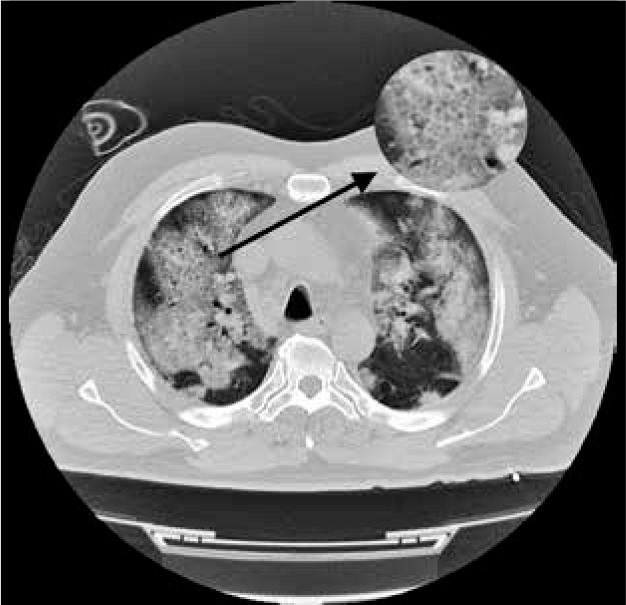
Table 3
Computed tomography chest findings and results (N = 21)
Literature review
An updated literature review of imaging manifestations of COVID-19 pneumonia including CXR, ultrasound, and CT scans was performed on PubMed by two researchers independently. The search method included the terms “coronavirus”, “SARS-CoV-2” and “COVID-19”, and aimed to identify retrospective and prospective studies published up to 25th April 2020. We limited our search to English-language studies conducted on human subjects with more than 10 patients in which COVID-19 infection was investigated and we excluded studies focused on pediatric populations.
From the literature search, we found 30 articles [2,3, 7-32,34-36] that included a total of 4243 patients, with a mean age of 49.63 years old, male: 2245 and female: 1998. Chest CT abnormalities were reported in all studies whereas only three studies [2,18,29] included CXR findings; finally, lung US abnormalities such as various B-line patterns, subpleural consolidation and thickened pleural line were investigated in one original studies and discussed in two letters to the editor [2,32,33].
Discussion
As reported in the literature review, to date, there are still few studies with a large population available reporting detailed analysis regarding CXR manifestations. Chen et al. [18] reported bilateral pneumonia as the most common result on CXR, while in the Ng et al. study [29], only five patients underwent CXR and of these, three had parenchymal consolidations, two showed no alterations, and none had pleural effusion. The CXR results of the included studies are displayed in Table 4.
Table 4
Literature review of computed tomography imaging manifestations of COVID-19 pneumonia
| First author, publication data [reference No.] | Patient characteristics | CT findings | ||||||
|---|---|---|---|---|---|---|---|---|
| N | Age (mean) | Sex | Time between onset and 1st | GGO | Consolidation | Distribution and/or location | Other findings | |
| Huang, 24 January 2020 [7] | 41 | 49 | F: 11, M: 30 | 8 | Typically present | Typically present | Bilateral: 40 (98%) | – |
| Chen, 29 January 2020 [18] | 99 | 55.5 | F: 32, M: 67 | N.R. | 14 (14%) | 99 (100%) | Bilateral: 74 (75%) Unilateral: 25 (25%) | – |
| Chung, 3 February 2020 [25] | 21 | 51 | F: 8, M: 13 | N.R. | 18 (86%) | 6 (29%) | Bilateral: 16 (76%) Unilateral: 2 (24%) Peripheral distribution: 7 (33%) | Crazy paving: 4 (19%) Fibrotic streaks or linear opacities: 3 (14%) |
| Song, 6 February 2020 [26] | 51 | 49 | F: 26, M: 25 | median 4 days (range 1 - 14) | Pure GGO: 39 (77%) GGO with consolidation: 30 (59%) | 28 (55%) | Bilateral: 44 (86%) Lower lobes: 46 (90%) Peripheral: 44 (86%) | Crazy paving: 38 (75%) Interstitial thickening or reticulation: 11 (22%) Air broncograms: 41 (80%) Lymphadenopathy: 3 (6%) Pleural effusion: 4 (8%) |
| Pan, 6 February 2020 [27] | 63 | 44.9 | F: 30, M: 33 | N.R. | 54 (85.7%) | 12 (19.0%) | Number of affected lobes: 3.3 | Interstitial thickening or reticulation: 11 (17.5%) |
| Wang, 7 February 2020 [28] | 138 | 56 | F: 63, M: 75 | N.R. | 138 (100%) | – | Bilateral: 138 (100%) | – |
| Ng, 13 February 2020 [29] | 21 | 56 | F: 8, M: 13 | 3 | 18 (86%) | 13 (62%) | Peripheral: 18 (86%) Perihilar: 1 (5%) Upper zone: 3 (14%) Lower zone: 8 (38%) Similar upper and lower zone involvement: 8 (38%) | – |
| Pan, 13 February 2020 [30] | 21 | 40 | F: 15, M: 6 | 9-13 days | 15 (71%) | 19 (91%) | Single lobe: 3 (14%) Bilateral multilobe: 18 (86%) Peripheral: 13 (62%) Random: 7 (33%) Diffuse: 1 (4.8%) | Crazy paving: 4 (19%) |
| Han, 15 February 2020 [31] | 108 | 45 | F: 70, M: 38 | 1–3 days (median, 1 day) | 65 (60%) GGO with consolidation: 44 (41%) | 6 (6%) | Peripheral: 97 (90%) Central: 2 (2) Peripheral and central: 9 (8%) | Crazy paving: 43 (40%) Air broncograms: 52 (48%) |
| Fang, 19 February 2020 [8] | 51 | 45 | F: 22, M: 29 | N.R. | 36 (72%)* | N.R. | Peripherical: 36 (72%) Lower lobes: 36 (72%) | *36 (72%) typical CT manifestations (e.g. peripheral, subpleural ground glass opacities, often in the lower lobes); 14 (28%) atypical CT manifestations |
| Xu, 19 February 2020 [9] | 90 | 50 | F: 51, M: 39 | N.R. | 65 (72%) | 12 (13%) | Periphery: 46 (51%) Bilateral: 53 (59%) Upper lobes: 40 (44%) Lower lobes: 47 (52%) | Crazy paving: 11 (12%) Interstitial thickening or reticulation: 33 (37%) Air broncograms: 7 (8%) Fibrotic streaks or linear opacities: 55 (61%) Lymphadenopathy: 1 (1%) Pleural effusion: 4 (4%) Pleural retraction sign/thickening: 50 (56%) |
| Zhao, 19 February 2020 [10] | 101 | 44.44 | F: 45, M: 56 | N.R. | 87 (86.1%) | 44 (43.6%) | Unilateral: 10 (9.9%) Bilateral: 83 (82.2%) Peripheral: 88 (87.1%) Central: 1 (1.0%) Lower lobes: 55 (54.5%) Upper lobes: 6 (5.9%) | Interstitial thickening or reticulation: 49 (48.5%) Vascular enlargemen: 72 (71.3%) Lymphadenopathy: 1 (1.0%) Pleural effusion: 14 (13.9%) |
| Zhou, 19 February 2020 [11] | 62 | 52.8 | F: 23, M: 39 | 10 patients: 1-7 days (mean, 2.2 ± 1.8 days); 52 patients: 1-14 days (mean, 6.6 ± 4.0 days) | 25 (40.3%) | 21 (33.9%) | Single lesion: 10 (16.1%) Multiple lesion: 52 (83.9%) Peripheral: 48 (77.4%) Peripheral and central: 14 (22.6%) | Crazy paving: 39 (62.9%) Air broncograms: 45 (72.6%) Vascular enlargement: 28 (45.2%) Vacuolar sign: 34 (54.8%) Fibrotic streaks or linear opacities: 35 (56.5%) Pleural effusion: 6 (9.7%) Pleural retraction sign/thickening: 35 (56.5%) |
| Bernheim, 20 February 2020 [12] | 121 | 45.3 | F: 60, M: 61 | 36 patients: 0-2 days; 33 patients: 3-5 days; 25 patients: 6-12 days; 27 patients: unknown | 92 (76%) | 53 (43.8%) | Bilateral: 73 (60%) Right lower lobe: 79 (65%) Left lower lobe: 76 (63%) Peripheral: 63 (52%) | Crazy paving: 6 (5%) ”Reversed halo” sign: 2 (2%) Fibrotic streaks or linear opacities: 9 (7%) Pleural effusion: 1 (1%) |
| Xu, 21 February 2020 [13] | 50 | 43.9 | F: 21, M: 29 | N.R. | 21 (75.0%) | 6 (21.4%) | Peripheral: 27 (96.4%) Central: 14 (50.0%) Peripheral involving central: 12 (42.9%) Symmetrical: 15 (53.6%) | Thickened intralobular septa: 21 (75.0%) Thickened interlobular septa: 20 (71.4%) Air broncograms: 15 (53.6%) Lymphadenopathy: 1 (3.6%) Pleural effusion: 2 (7.1%) |
| Li, 21 February 2020 [14] | 51 | 58 | F: 24, M: 29 | N.R. | 46 (90.20%) | 31 (60.78%) | Single lobe: 3 (5.9%) Bilateral multilobe: 32 (94.1%) Peripheral and subpleural: 49 (96.1%) | Crazy paving: 36 (70.6%) Air broncograms: 35 (68.6%) “Reversed halo” sign: 2 (3.9%) Vascular enlargement: 42 (82.4%) Pleural effusion: 1 (2%) |
| Wu, 21 February 2020 [15] | 80 | 44 | F: 38, M: 42 | 7 ± 4 | 73 (91%) | 50 (63%) | Subpleural: 42 (53%) Diffuse: 7 (9%) Peribronchial: 3 (4%) Mixed: 24 (30%) | Crazy paving: 23 (29%) Interstitial thickening or reticulation: 47 (59%) Spider web sign: 20 (25%) Lymphadenopathy: 3 (4%) Pleural effusion: 5 (6%) |
| Shi, 24 February 2020 [16] | 81 | 49.5 | F: 39, M: 42 | N.R. | 53 (65.4%) | 14 (17.3%) | Unilateral: 17 (21%) bilateral: 64 (79%) central: 10 (12.4%) Peripheral: 44 (54.3%) Both central and peripheral: 27 (33.3%) | Crazy paving: 8 (9.9%) Interstitial thickening or reticulation: 3 (3.7%) Air broncograms: 38 (46.9%) Lymphadenopathy: 5 (6.2%) Pleural effusion: 4 (4.9%) Pleural retraction sign/thickening: 26 (32.1%) |
| Yang, 26 February 2020 [17] | 149 | 45.11 | F: 68, M: 81 | median 7.61 days (range 0 - 7) | Rported as GGO on 287 (12.1%) segments and mixed GGO on 637 (26.8%) segments | Reported as present on 170 (7.2%) segments | Peripheral: 35.9% Central: 2.15% Both: 8.12% | Interstitial thickening or reticulation: 79 (53%) Air broncograms: 81 (54%) Fibrotic streaks or linear opacities: 31 (21%) Lymphadenopathy: 7 (5%) Pleural effusion: 10 (7%) |
| Ai, 26 February 2020 [19] | 1014 | 51 | F: 547, M: 467 | N.R. | 409 (40%) | 447 (44%) | – | Interstitial thickening or reticulation: 8 (8%) |
| Li, 29 February 2020 [20] | 83 | 45.5 | F: 39, M: 44 | 58 patients: median 6 days (range: 3 - 8.5 days); 25 patients: median 8 days (range: 6 - 12 days) | 81 (97.6%) | 53 (63.9%) | Bilateral: 79 (95.2%) Lower lobe: 80 (96.4%) Right lower lobe: 78 (94%) Left lower lobe: 80 (96.4%) | Crazy paving: 30 (36.1%) Interstitial thickening or reticulation: 52 (62.7%) Fibrotic streaks or linear opacities: 54 (65.1%) Spider web sign: 21 (25.3%) Pleural effusion: 7 (8.4%) Pleural retraction sign/thickening: 7 (8.4%) |
| Xiong, 3 March 2020 [21] | 42 | 49.5 | F: 17, M: 25 | mean 4.5 days (range 1-11 days) | n of lobes with opacification: 158/210 (75%) | 23 (55%) | Single lobe: 10 (24%) Bilateral multilobe: 32 (76%) Central: 5 (12%) Peripheral: 12 (29%) Both central and peripheral: 25 (59%) | Interstitial thickening or reticulation: 17 (41%) Air broncograms: 14 (33%) Fibrotic streaks or linear opacities: 15 (36%) Lymphadenopathy: 12 (29%) Pleural effusion: 5 (12%) |
| Wang, 4 March 2020 [36] | 114 | 53 | F: 56, M: 58 | N.R. | Ground-glass opacity: 27.3% Ground-glass opacity and consolidation: 45.4% | 27.3% | Peripheral zone: 43.6% Central zone: 0% Both: 56.4% Single lobe of one lung: 9.1% Multiple lobes of one lung: 5.5% Multiple lobes of both lungs: 72.7% Bilateral lower lungs: 3.6% Bilateral middle and lower lungs: 9.1% | Pleural effusion: 0.9% |
| Guan, 6 March 2020 [3] | 1099 | 47.0 | F: 459, M: 640 | N.R. | 550 (56.4%) | 409 (41.9%) | Bilateral: 505 (51.8%) | Interstitial thickening or reticulation: 43 (14.7%) |
| Liu, 7 March 2020 [34] | 73 | 41.6 | F: 32, M: 41 | N.R. | Unique ground-glass opacities: 28-100% Multiple ground-glass opacities: 72-100% | *Severe type: 24% *Critical type: 100% | Unilateral lung involvement: 35% Bilateral lung involvement: 50-100% | Paving stone sign: 35-100% Bronchial wall thickening: 5-100% Pleural effusion: 0-100% Thickening of lung texture: 50-100% |
| Bai, 10 March 2020 [22] | 219 | 44.8 | F: 100, M: 119 | 4.9 | 200 (91%) | 150 (69%) | Unilateral: 41 (19%) Bilateral: 165 (75%) Central: 3 (1%) Peripheral: 176 (80%) Central + peripheral: 31 (14%) | Crazy paving: 11 (5%) Interstitial thickening or reticulation:123 (56%) Air broncograms: 30 (14%) “Reversed halo” sign: 11 (5%) Fibrotic streaks or linear opacities: 111 (51%) Lymphadenopathy: 6 (3%) Pleural Effusion: 9 (4%) Pleural retraction sign/thickening: 32 (15%) |
| Zhao, 13 March 2020 [23] | 19 | 48 | F: 8, M: 11 | 5.0 | 17 (89.47%) | N.R. | Single lobe: 4 (21.05%) Bilateral: 15 (78.95%) | – |
| Cheng, 14 March 2020 [24] | 11 | 50.36 | F: 3, M: 8 | N.R. | GGO 11 (100%) Mixed GGO 7 (63.6%) | 6 (54.5%) | Peripheral: 11 (100%) Right lower lobe: 8 (72.7%) Left lower lobe: 7 (63.6%) | Interstitial thickening or reticulation: 9 (81.8%) Air broncograms: 8 (72.7%) Fibrotic streaks or linear opacities: 2 (18.2%) |
| Lomoro, 4 April 2020 [2] | 42 | 66.3 | F: 22, M: 36 | N.R. | 15 (35.7%) | 0 (0%) | Peripheral: 27 (64.3%) Central: 1 (2.4%) Peripheral and central: 12 (28.6%) Neither peripheral or central: 2 (4.8%) | Vascular thickening: 10 (23.8%) Crazy paving pattern: 24 (57.1%) Air bronchogram sign: 11 (26.2%) Bronchus deformation: 12 (28.6%) Noduls: 1 (2.4%) Pleural effusion: 3 (7.1%) Fibrous stripes: 21 (50%) Subpleural lines: 15 (35.7%) Lymph node: 6 (14.3%) |
| Ding, 8 April 2020 [35] | 112 | 55.8 | F: 61, M: 51 | 8.0 | 76-98.1% | 25.5-75% | Mostly peripheral at all stages with the highest rate (66.6%) at stage 2, and with the development of the disease the lesions gradually spread from the periphery to the center Bilaterally, in multiple lobes, with the lowest rate (42.5%) at stage 1 and the highest rate (95.6%) at stage 4 | Air bronchogram, bronchiectasis and pleural effusion with their maximum frequencies occurring in stage 2: 50.0%, stage 6: 45.2% and stage 4: 27.9% Pericardial effusion: 4.4% Pneumothorax: 3.8% |
On the other hand, chest CT abnormalities were largely investigated in recent published works and the most common reported abnormalities associated with COVID-19 pneumonia were isolated GGO, followed by consolidations and GGO in combination with consolidative opacities; the predominant distribution was bilateral, peripheral, subpleural and of the lower lobes. Other CT signs showed heterogeneous results; in particular, the air bronchogram, the crazy-paving pattern and the interstitial thickening (i.e. reticulation pattern) had a detection rate which ranged from 8% to 80%, from 17.5% to 81.8%, and, from 8.4% to 56.5%, respectively. Moreover, the reversed halo sign was described in only three studies: Bernheim et al. found it in 2% [12], Li et al. in 3.9% [14], Bai et al. in 5% [22]. According to the revised studies, lymphadenopathy and pleural effusion were rarely observed.
Interestingly, recent evidence focused on the reliability of disease staging using CT scores [34,35], identifying a correlation between the signs, symptoms, and the stage of the disease. Liu et. al. [34] reported the initial and follow-up characteristics of CT in COVID-19 patients by classifying them based on severity, in patients with mild, common, severe, and critical type. Atelectasis and pleural effusion findings were rarely observed and were found only in critically ill patients, suggesting a worse prognosis when these signs occurred; in the follow-up, CT scans, mostly in patients who had recovered from the disease, GGO, and consolidation were resolved, while the interlobular septum and bronchial wall thickening, band opacities and scattered patchy consolidation were still visible in a minority of patients.
Ding et al. [35] classified the disease into six stages according to the time of the initial symptoms; this study showed no abnormalities at the initial presentation (symptoms of 0-4 days) in 21.2% of performed chest CT scans while variable lesions were observed in the progressive phase (5-9 days). In later stages, the presence of crazy paving pattern, consolidation, and linear opacities increased significantly, reflecting the pathological changes with the development of interstitial edema and alveolar exudation. Furthermore, they analyzed the adherence of semiquantitative CT score to the severity of the different stages, showing that the total CT scores of the bilateral lungs were lower in the first stage compared to the other stages, but there was no significant difference between the other stages, suggesting the permanence of disease within ten days after the onset of the initial symptoms.
Regarding our case series, it is interesting to note that, unlike the data reported in the literature relating to chest CT abnormalities, the most frequently detected CT lung findings were GGO with concomitant consolidative opacities (76%), rather than isolated GGO, visible only in 24% of cases. Instevisiblead, according to the revised studies, also in our case series, the predominant distribution was bilateral and peripheral with lower zone involvement (100%); however, the high central distribution frequency (76%) should be considered. Similarly, we highlighted a high frequency of presence of air bronchogram sign (76%) and “crazy paving” pattern (57%). Regarding the presence of perilesional vascular thickening, we detected this sign in 47% of cases, which represents an incidence lower than that reported by of Li and Xia (82.4%) [14] and Zhao et al. (71.3%) [10] and similar to that observed in the study of Zhou et al. (45.2%) [11]; this sign is thought to be caused by hyperemia induced by an acute inflammatory response [2]. Regarding the extrapulmonary manifestations, it is interesting to note that in 57% of cases we detected mediastinal enlarged lymph node, an uncommon finding according to literature data. According to the revised studies, pleural effusion was rarely observed (9%). Therefore, the set of our findings suggests a higher incidence of more severe and critical disease cases in our case series, as also confirmed by the high mortality rate of our case series (6 patients: 26%). These data can be explained by patients’ access to the hospital at a later stage in the history of the disease.
Limitations of our study were related to the retrospective design, the small sample size, and the lack of follow-up studies; in fact, we only included imaging evaluations performed at the time of hospitalization.
In conclusion, we provided a current and exhaustive overview of multi-modality lung imaging findings observed in patients with COVID-19 pneumonia, and we described the typical US, CXR, and CT features detected at hospital admission, thus helping radiologists to recognize this novel, severe and pandemic infectious disease.