


Introduction
The entire world still has to deal with the global coronavirus pandemic, which started in the last months of 2019 in China. Currently, we are passing through consecutive waves of the pandemic and the flu season at once. This is very troublesome in the context of diagnostics and treatment of various viral respiratory infections.
The incidence of influenza and influenza-like diseases is usually higher in winter and early spring than in the other seasons. They are a significant scourge of global public health, leading to an estimated 650,000 deaths worldwide each year [1]. In Poland, the peak incidence of influenza infections has regularly been in January-March each epidemic season. Byambasuren et al. demonstrated in their epidemiological review (involving the data from seasons 2008/2009 to 2017/2018) that the proportion of laboratory confirmations of influenza-like infections in Poland has been rising in recent years, peaking from 3.2% to 42.4% over the decade. Healthcare providers have also reported increasing numbers of infections, from 568,958 in 2008/09 to 5,337,997 in 2017/18. It is worth noting that in the recent years, among all confirmed influenza-like infections in Poland the percentage of influenza significantly rose from 56.8% (2008/2009) to 96.7% (2017/2018). This made it the most common among these diseases, with respiratory syncytial virus (RSV) taking second place [2].
All this data is concerning in times of pandemic because the first symptoms of COVID-19 and influenza-like diseases are similar. However, they often require different treatment, and COVID-19 patients need to be isolated in a much stricter way. It is therefore essential to use quick and broadly available tests to differentiate these conditions and, in particular, to distinguish COVID-19 from very common influenza.
According to most of recommendations, the reference method for diagnosing COVID-19 is the reverse transcription polymerase chain reaction (RT-PCR) assay, with its very high specificity (greater than 95%) but variable and relatively low sensitivity (32 to 71%) [3]. However, chest CT is available in most of emergency wards and, in contrast to PCR, can be obtained in several minutes. The very first study carried out by Ai et al. in Wuhan, China revealed that chest CT sensitivity, specificity, and accuracy for the diagnosis of COVID-19 were 97%, 25%, and 68%, respectively [4]. The recent meta-analysis of Kim et al. showed its sensitivity to be 94% and specificity 37% [5]. Actually, most of international societies recommend limiting the role of chest CT in COVID-19 diagnosis, probably due to its relatively low sensitivity. Based on the American College of Radiology (ACR) and the Canadian Society of Thoracic Radiology recommendations [6,7], chest CT should be used sparingly and reserved for hospitalized, symptomatic patients with specific clinical indications. It should not be used as a screening tool. The Fleischner Society in a recent statement suggest that medical imaging should not be performed for triage of asymptomatic or mildly symptomatic patients [8]. However, in recent studies from Europe, chest CT sensitivity and specificity were, respectively, 90.7% and 78.8% in Italy [9], and 90% and 91% in France [10]. These studies were published later than pioneering Chinese studies, which gives hope that as we gain more experience during the course of the pandemic, our diagnostic accuracy will increase. In this review, we subjectively selected and summarised the most interesting and useful literature data about chest CT features in COVID-19, their differentiation from other interstitial pneumonias, particularly from viral pneumonias, and useful radiological scales. We hope that this brief analysis will support frontline radiologists in further improvement of their chest CT results this winter.
The most common chest CT findings in COVID-19 pneumonia and their relation to the course of the disease
There is a broad spectrum of chest CT changes in COVID-19. Ground-glass opacities (GGOs) with posterior and peripheral distribution were typically described as imaging manifestations of the disease, for the very first time by Chung et al. in a study of 21 patients [11]. However, as the experience of radiologists increases, they notice also different features of the disease and their diverse meaning.
Ground-glass opacities
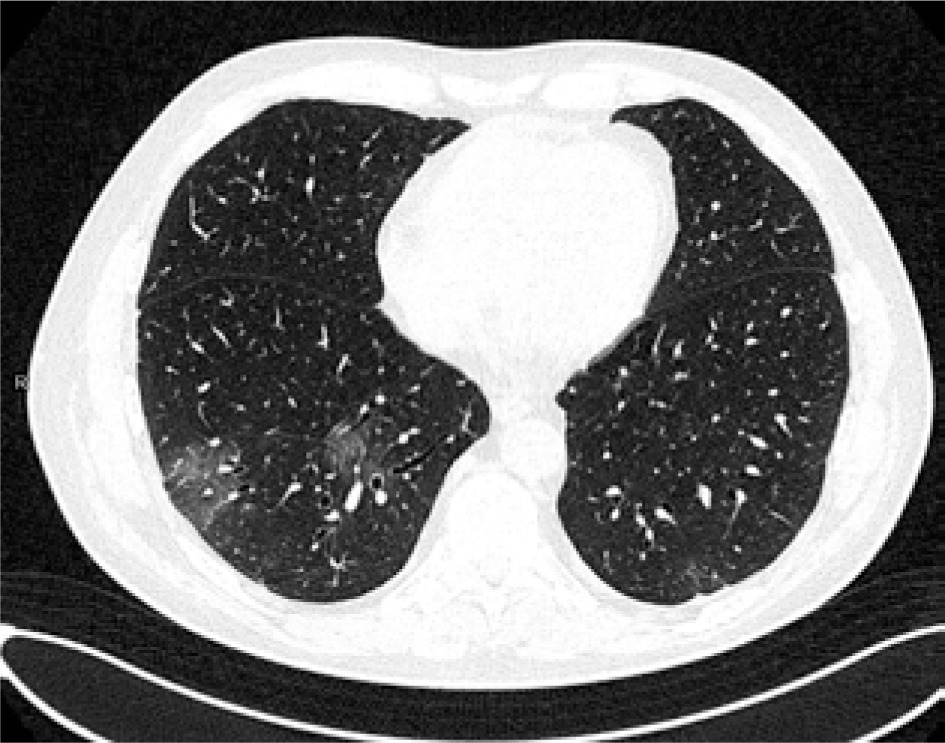
GGOs are the most common finding in COVID-19 and are detected in up to 98% of patients [12]. In the study of Inui et al., GGOs dominated over consolidation in the majority of asymptomatic patients but not in the symptomatic ones [13]. Their distribution in the lung tissue seems to depend on the stage of the disease. According to the study of Pan et al., GGOs are initially found in subpleural areas, often unilaterally, as small, hazy foci, as shown in Figure 1. Later on, their number increases with characteristic diffuse, bilateral and peripheral, posterobasal distribution [14]. Moreover, according to the studies of Huang et al. and Cheng et al., pure, peripheral GGOs are more often found in discharged patients with better outcome, while scattered distribution and greater lung involvement are typically characteristic of intensive care patients [15,16].
Consolidation
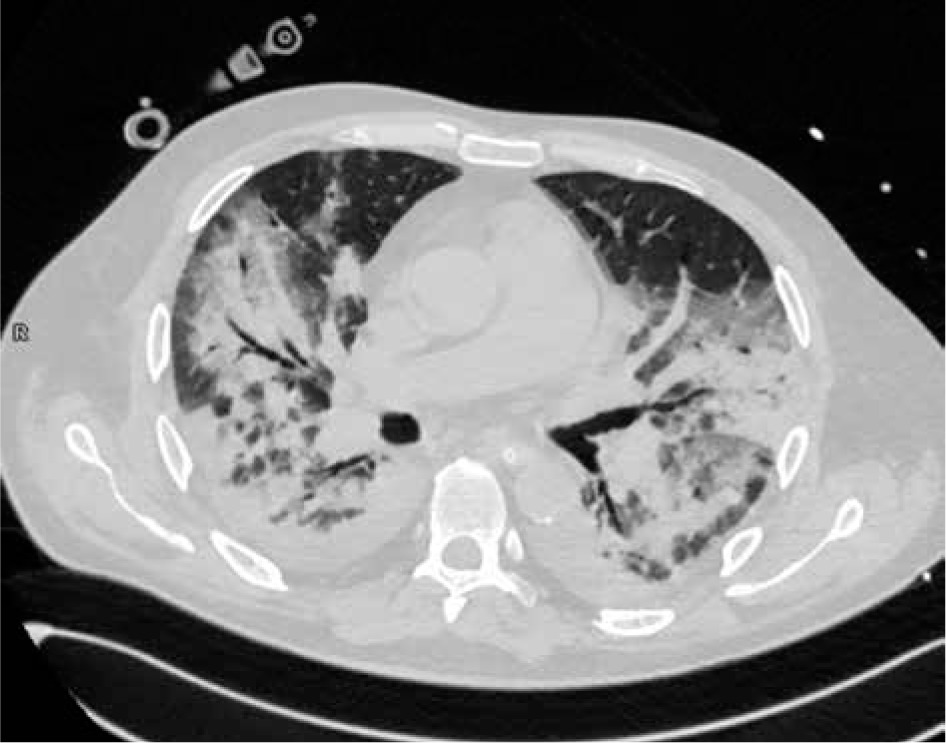
Consolidation is the imaging sign related to the complete filling of alveolar airspace. Its occurrence rate in COVID-19 is 2-64%, depending on the study and the stage of the disease. Consolidation without GGOs seems to be relatively rare in COVID-19. In the study of Bernheim et al. it was found in only 2% of patients; in the study of Yoon et al. it was 5% of all lesions [17]. However, consolidation in general, mixed with GGOs, is typically considered as the second most common chest CT feature in COVID-19 (Li et al. 64%[18], Pan et al. 63%[14], Wu et al. 63%[19], Song et al. 55%[20]). It usually forms from GGOs in 1-3 weeks of the disease [14]. It was considered to be more frequent in patients older than 50 years [20], predicting severe course of the disease [21]. An example of consolidation is demonstrated in Figure 2.
Reticular pattern and linear opacities
The reticular pattern and linear opacities, associated with intra- and interlobular septal thickening, can be caused by interstitial lymphocyte infiltration. It is considered to be the one of the most common imaging findings in COVID-19, and is typically more frequent in the later stages of the disease [22,23]. However, in the study of Vancheri et al., who analysed chest X-rays of 240 PCR-positive patients, the reticular pattern was often the earliest alteration [24]. The results are particularly interesting because the corresponding chest CT sign is intra- and interlobular septal thickening.
Crazy paving
Crazy paving is the appearance of GGOs with a superimposed reticular pattern (Figure 3). It is not as common as GGOs and consolidation. It occurs in 5-36% of patients, more frequently in the later stages of the disease, and is often considered as a sign of progression [14,22]. Crazy paving is usually followed by vascular dilatation (19.5% – Ojha et al. [25], 59% – Bai et al. [26]).
Reversed halo sign
Reversed halo sign is an area of GGOs surrounded by a ring-shaped area of consolidation (Figure 4). This sign is considered variably as a sign of healing of the lung tissue or as a sign of disease progression, with consolidation developing around GGOs [12].
Bronchial wall thickening
Bronchial wall thickening is a relatively common sign and can be found in 10-20% of COVID-19 patients [12]. According to Li et al., bronchial wall thickening and bronchiectasis can be more often found in critical patients [18].
Lymphadenopathy and pleural effusion
Lymphadenopathy and pleural effusion are chest CT lesions atypical for COVID-19 [27]. However, according to Shi et al. and Li et al., they can be found more often in critical patients [23,28]. They are considered to be a sign of bacterial superinfection [12].
The prevalence of CT features, and therefore interstitial involvement, is different in the specified stages of the disease. Pan et al. divided the evolution of disease into 4 stages, with the last stage after 14 days of disease. In the early stage (first 0-4 days) the main radiological demonstration was GGOs distributed subpleurally in lower lobes, unilaterally or bilaterally. In the progressive stage (5-8 days) the infection aggravated to diffused, multi-lobe distribution with diffused GGOs, crazy paving, and consolidation. In the peak stage (9-13 days) the involved area of lung increased with more dense consolidation; moreover, subpleural parenchymal bands occurred. In the absorption period (more than 14 days of disease) the consolidation was absorbed to extensive GGOs and there was no crazy paving pattern. The last stage could extend beyond 26 days [14]. In another study, Bernheim et al. demonstrated concurring results, using 0-20-point scoring of lung involvement [22].
COVID-19 and other interstitial diseases
Most of the lesions mentioned above may be characteristic not only of COVID-19 but also of many other infectious and non-infectious diseases.
Non-specific interstitial pneumonia
Non-specific interstitial pneumonia (NSIP) is usually associated with systemic connective tissue diseases. Diffuse GGOs with mostly bilateral, subpleural, and basal distribution are the most common chest CT changes. Moreover, in the fibrotic subtype of NSIP the subpleural fibrotic changes with traction bronchiectasis are much more common and intensified than in COVID-19 [29,30].
Cryptogenic organising pneumonia
Cryptogenic organising pneumonia (COP) is an uncommon interstitial lung disease of unknown aetiology and is associated with abnormal lung tissue healing. The onset of symptoms may be subacute with fever, malaise, weight loss, and non-productive cough. The most common chest CT features of COP are GGOs, consolidation, peribronchial nodules, and bronchial wall thickening. The reversed-halo sign, which can be found also in COVID-19, is one of the most characteristic CT changes [31]. Changes may be polymorphic, usually with peribronchial or subpleural distribution, and the lower lobes are more often involved [29,30]. The CT presentation of this disease may, due to its variety, overlap not only with COVID-19 but also with other interstitial diseases. Therefore, it requires careful, both clinical and radiological, differentiation.
Acute eosinophilic pneumonia
Acute eosinophilic pneumonia is a type of eosinophilic lung disease, which in some patients may be associated with smoking. The onset of symptoms is usually acute with fever and hypoxaemia. The bronchoalveolar lavage eosinophilia is an important finding in laboratory results. Chest CT features may include bilateral GGOs and consolidation of random distribution and interlobular septal thickening – changes that overlap with COVID-19. However, lymph node enlargement, pleural effusion, and centrilobular nodules are also common, unlike in COVID-19 [29].
Mycoplasma pneumoniae
Mycoplasma pneumoniae is a cause of a common atypical pneumonia and is responsible for up to 40% of community acquired pneumonias and 18% of cases requiring hospitalisation in children. The illness may manifest as a non-specific upper respiratory tract infection in up to 50% of cases [32]. Its most characteristic chest CT features are GGOs, consolidation, and bronchial wall thickening, which overlaps with COVID-19. As in COVID-19, lymphadenopathy and pleural effusion are uncommon. However, the common presence of centrilobular nodules in M. pneumoniae pneumonia may, to some degree, serve as a differentiating sign [29].
Pneumocystis jirovecii pneumonia
Pneumocystis jirovecii pneumonia (PJP) is an atypical, opportunistic infection, affecting almost only immunocompromised patients, such as HIV-positive patients or patients with iatrogenic immunosuppression. GGOs, consolidation, septal thickening, and crazy paving may be seen commonly in chest CT scans in this infection as well. However, in contrast to COVID-19, the distribution of changes is usually central or perihilar, with subpleural sparing in up to 40% of cases [29,33]. Moreover, pneumatoceles of various shapes and sizes can be seen, and this lesion is uncommon in COVID-19 [29].
Chest CT signs of COVID-19 can overlap also with many other viral pneumonias, including flu, as is more broadly discussed below.
COVID-19 and other viral pneumonias – a differential diagnosis
Influenza A and B are annually the causes of seasonal flu epidemic. The most common CT findings in influenza pneumonia and other viral pneumonias, such as: diffuse or patchy GGOs with interlobular septal thickening, consolidation along bronchovascular bundles, and bronchial wall thickening, are very similar to COVID-19 [34]. However, some authors looked for chest CT signs differentiating COVID-19 and influenza pneumonia.
Table 1 presents the results of five studies from PubMed Base. The authors of these studies looked for chest CT differences in patients with COVID-19 and other viral pneumonias. In the studies of Bai et al. and Yin et al., features such as vascular thickening, reversed halo sign, and crazy paving were more common in COVID-19, but pleural effusion, lymphadenopathy, and bronchiectasis occurred more often in influenza and other viral pneumonias [26,35]. Lin et al. found that the peripheral distribution of features and location of the largest lesion close to pleura were characteristic for COVID-19, but the diffuse or random distribution were more frequent in other viral pneumonias [36]. The peripheral distribution was found to be more characteristic for COVID-19 also in the studies of Bai et al. and Wang et al. [26,37]. What is more, the meta-analysis of Altmeyer et al. had the largest sample and showed only 2 features that were significantly more common in COVID-19 than in other viral pneumonias: peripheral distribution of CT changes and more frequent involvement of not only inferior but also upper and middle lobes [38].
Table 1
Significant differences of chest computed tomography findings in COVID-19 pneumonia and influenza pneumonia (or other viral pneumonias including influenza) according to the latest studies
In fact, the characteristic distribution of changes seems to be most often mentioned by the authors as the differentiating feature. However, it is problematic because the evaluation of this feature is subjective and may be difficult for an unexperienced radiologist. Moreover, in the advanced stages of the disease, there is much more lung tissue involved and the distribution of changes can be more scattered. The CT features, demonstrated in Figures 5 and 6, are characteristic of COVID-19 and influenza A pneumonia, respectively.
Figure 5
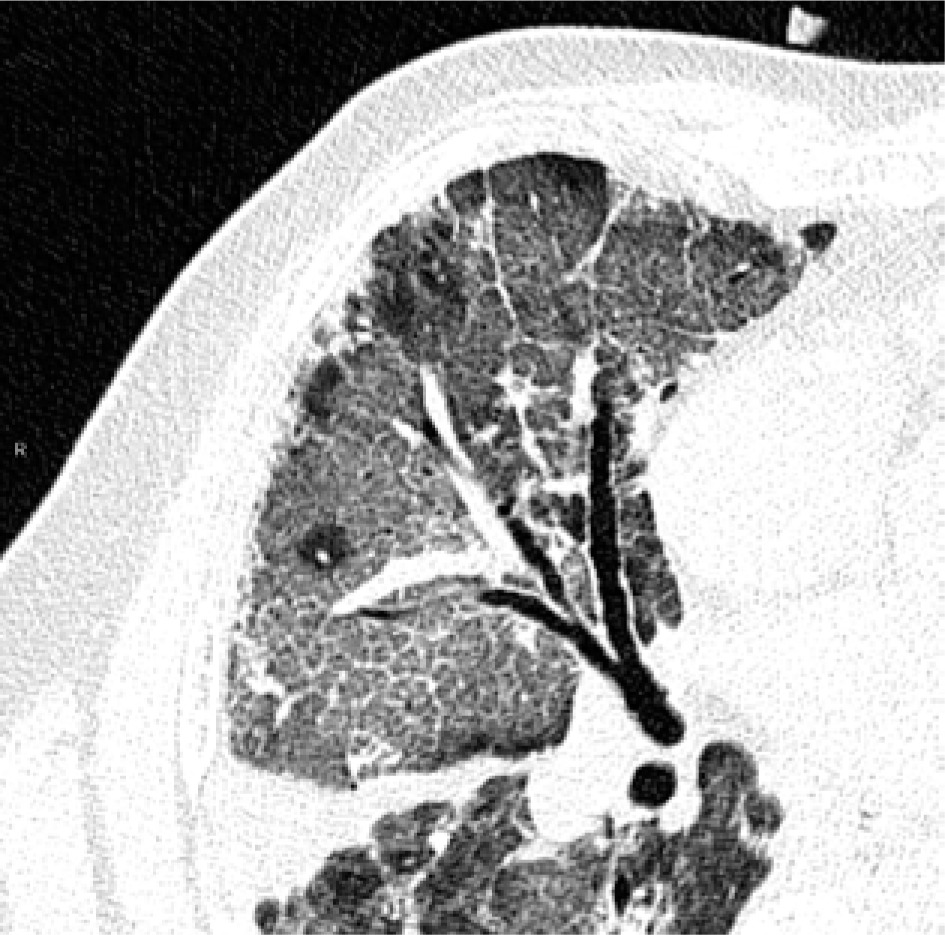
COVID 19: Bilateral ground-glass opacities, crazy paving appearance, vascular dilatation, subpleural bands and architectural distortion. The distribution of changes is bilateral and peripheral
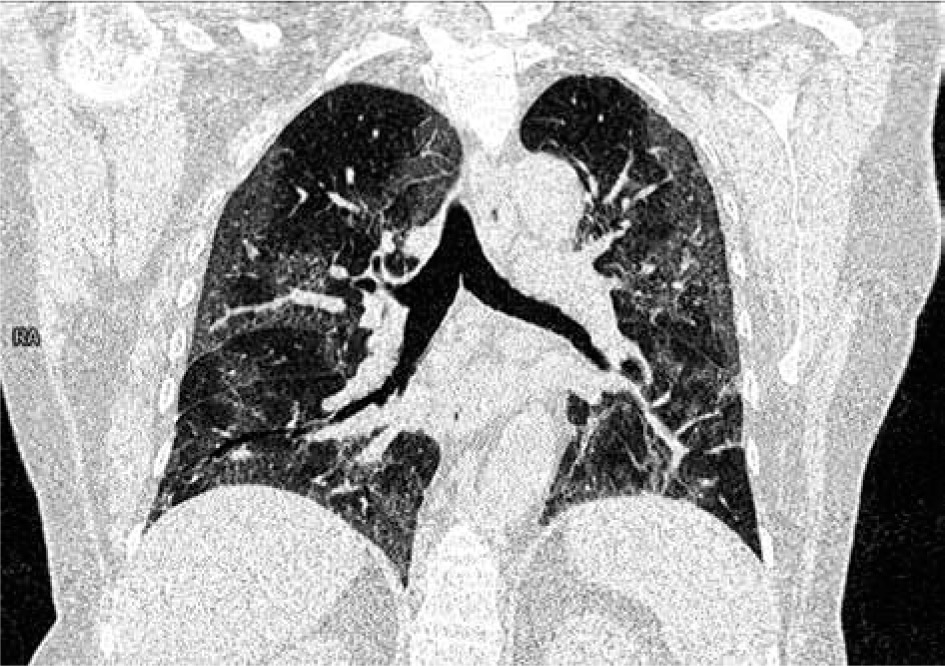
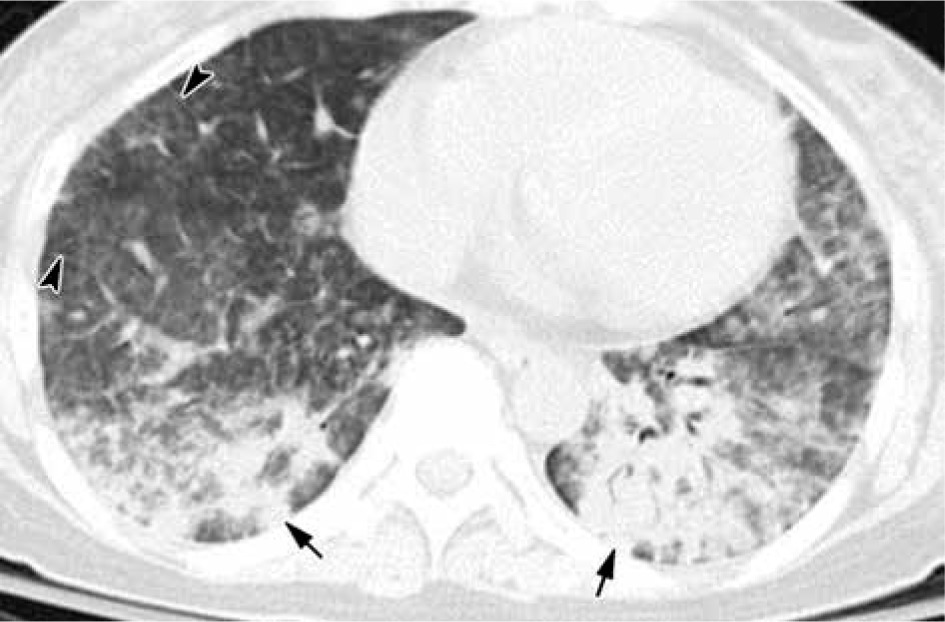
Figure 6
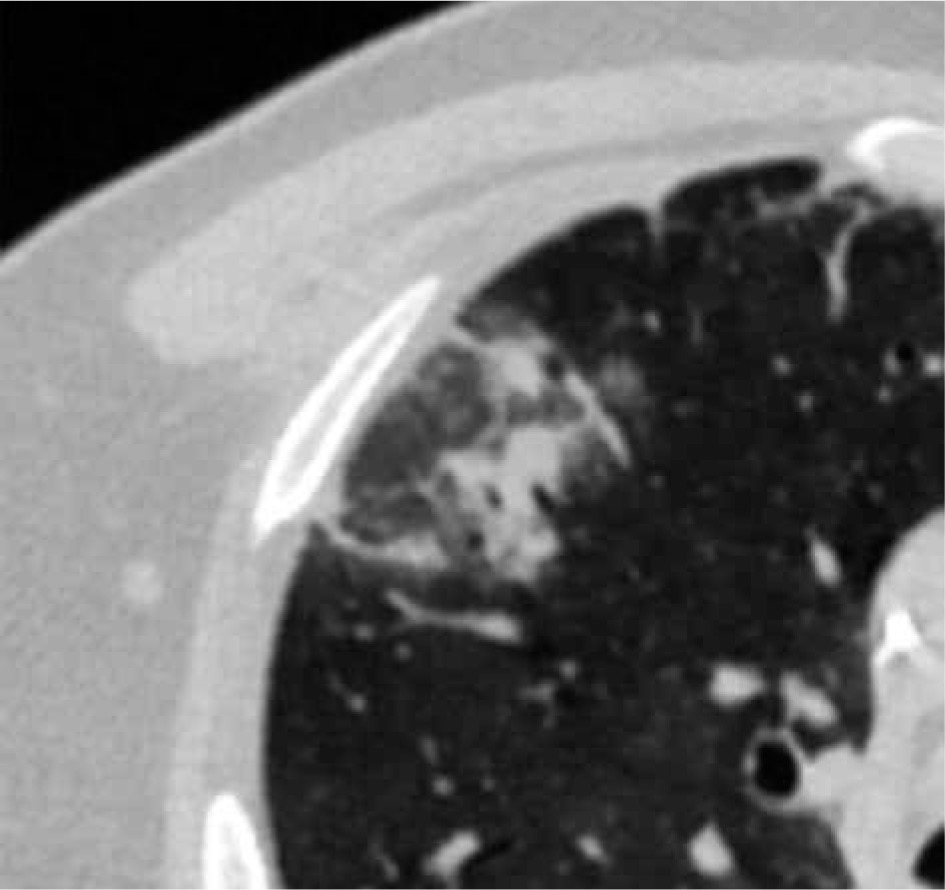
Influenza A pneumonia: computed tomography – consolidation (arrows), diffuse ground-glass opacities, interlobular septal thickening (arrowheads). The distribution of changes is mainly in the lower lobes. The peripheral distribution of consolidation is not as strong as in COVID-19 pneumonia (image from Koo et al. [35])
CO-RADS and RSNA, automatic system of lung involvement
CO-RADS, developed by the Dutch Radiological Society, and the RSNA reporting system are the CT-based scales used for staging the level of suspicion of COVID-19 infection. They provide more objective chest CT evaluation, depending on many features, with partially low interobserver variation. Both reporting systems show moderate to substantial interrater agreement across readers of different levels of expertise. The interobserver variation is particularly low in cases with high stage of suspicion of COVID-19 infection [39-41]. The RSNA created a descriptive scale that assists in chest CT differential diagnosis. The scale suggests the language that radiologists should use in their report. When the appearance is typical, the radiologist should report that findings are commonly seen in COVID-19 pneumonia but can also be caused by other factors (such as influenza). The typical appearances of COVID-19 are defined as peripheral, bilateral, and multifocal GGOs with visible interlobular lines (crazy paving) and reversed-halo sign [42]. In the case of indeterminate appearance, the physician should report nonspecific findings that occur not only in COVID-19 pneumonia but also in other conditions. CO-RADS is a tool established by the Dutch Radiological Society, with a 5-point scale of suspicion of COVID-19 pneumonia on chest CT. The level of suspicion progresses from very low (CO-RADS 1) to very high (CO-RADS 5). CO-RADS 0 means technically insufficient examination, and CO-RADS 6 means PCR proven COVID-19. CO-RADS 5 requires the presence of findings characteristic for COVID-19 and among them the obligatory feature and at least 1 confirmatory pattern. The obligatory feature are GGOs with or without consolidation, close to visceral pleura including the fissures, with multifocal and bilateral distribution. The confirmatory patterns are crazy paving, patterns compatible with organizing pneumonia, thickened vessels within parenchymal abnormalities, and characteristic shape of GGO regions. They should have unsharp margins with half-round shape or sharp margins outlining the shape of multiple adjacent secondary pulmonary lobules [43].
The obvious limitation of these scales remains that normal chest CT cannot clearly exclude COVID-19 because CT results can be negative in the early stages of the disease [22]. However, CO-RADS and the RSNA reporting system can be very useful in differential diagnosis of CT changes because they were demonstrated to have high positive predictive value, with RT-PCR as the reference standard. This feature is particularly strongly expressed with COVID-19 appearance classified as “typical” (CO-RADS 5) [39,42,43]. Moreover, Bellini et al. demonstrated 81% specificity of CO-RADS in CO-RADS ł 4 patients [40]. This relatively high specificity and objectivity can make these tools particularly useful this winter, when the accuracy of our CT results should be high.
Radiologists usually report the type and distribution of lung changes, but their qualitative and quantitative assessment seems to be ineffective. Therefore, many studies reported deep learning algorithms on severity assessment of COVID-19 patients, based on imaging features.
The DL-based CT Pneumonia Analysis Prototype (Siemens Healthinners, Erlangen, Germany) is one of the AI prototypes, which is used (currently for scientific purposes) at our department. The prototype estimates: lung volume (in ml), percentage of all-attenuation opacities (POO) and their volume, percentage of high-attenuation opacities (PHO) and their volume, lung severity score (LSS – measures the extent of all-attenuation in each lobe), and mean HU and standard deviations for lung parenchyma and pulmonary opacities (Figure 7). The values are given separately for both lungs combined, for each lung, and for each lobe [44]. Moreover, the prototype helps to assess COVID-19 probability, especially with conjunction with RT-PCR tests, and when there are limited resources and the crunch of time (the evidence is, however, still preliminary) [45].
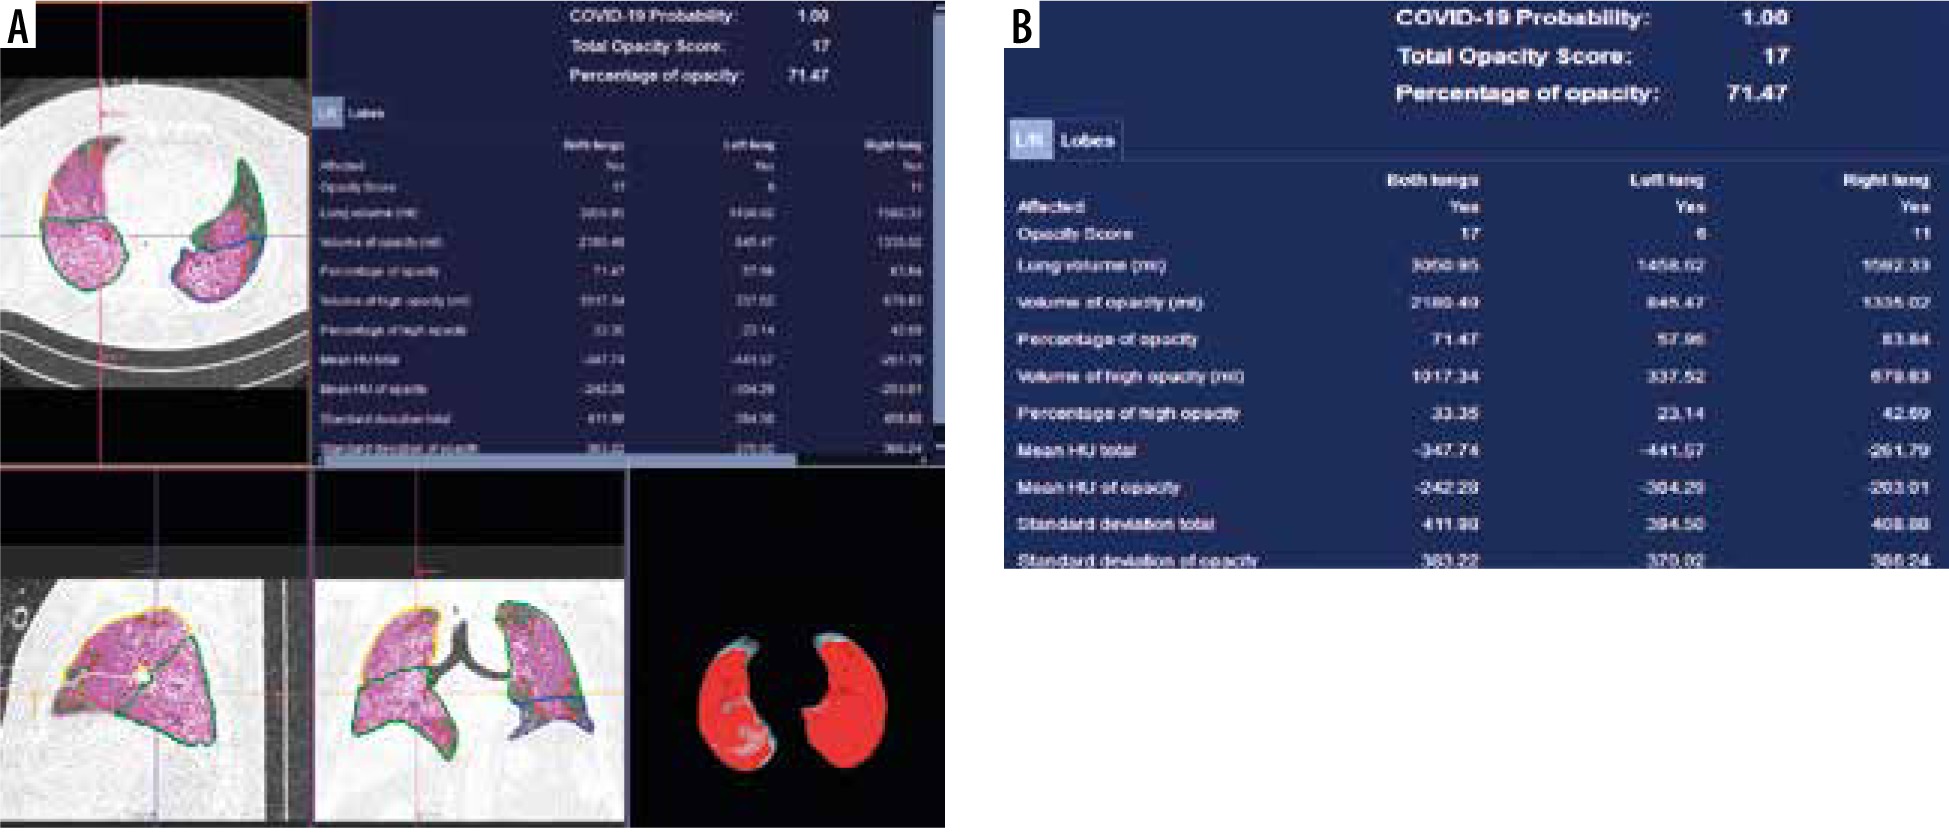
The percentage and volume of pulmonary opacities were shown to predict patient’s outcomes, and the percentage of compromised lung volume was an accurate predictor for risk of intubation, oxygen support, and in-hospital death [19].
In the study of Homayounieh et al. the prototype was superior to subjective severity scores from experienced radiologists’ assessment for evaluation of the severity and outcome in COVID-19.
Although the prototype is still not permitted in clinical use, it gives particularly important data and seems to be an interesting and important proposal for further studies [44].
Conclusions
Chest CT features in COVID-19 are characteristic, but they overlap with other viral pneumonias. The most specific feature for COVID-19 is the peripheral distribution of changes. However, evaluation of this feature can be problematic for unexperienced radiologists and in the later stages of the disease. Therefore, it is very helpful to use standardised scores that make the specificity of chest CT higher. Moreover, the AI-prototypes estimating lung involvement in COVID-19 are an interesting proposal for further studies because they provide data that may be important for clinical prognosis.