


Introduction
Since the first infections were noticed in December 2019 in Wuhan, China [1], SARS-CoV-2 has spread to the entire world. The World Health Organisation (WHO) has designated the ongoing pandemic of COVID-19 a Public Health Emergency of International Concern [2,3]. At the moment, the reference standard to make a definitive diagnosis of SARS-CoV-2 infection is the reverse trans-cription-polymerase chain reaction assay (rt-PCR) [4]. However, radiological imaging plays a crucial role in evaluating the course of COVID-19 and in choosing the proper management of infected patients.
Chest X-ray (CXR) is generally considered not to be sensitive for the detection of pulmonary abnormalities in the early stage of the disease [5,6]. However, in the emergency setting CXR can be a useful diagnostic tool for monitoring the rapid progression of lung involvement in COVID-19, especially in patients admitted to intensive care units [7].
Computed tomography (CT) imaging is considered to be the most effective method for detection of lung abnormalities, especially in the early stage of the disease [5,8]. Moreover, serial chest CT imaging with different time intervals is also effective in estimating the evolution of the disease from initial diagnosis to discharge from hospital [8,9].
However, the results of radiological examinations can vary between radiologists. This bias is particularly present in chest imaging. In order to standardise the results of radiological descriptions and turn them into a measurable outcome, there is a need for an objective tool for radiologists to follow. An algorithm in the form of a medical scale may play the role of such a tool.
In this review, we present and discuss currently available scoring systems that can be used to assess the severity of lung involvement in COVID-19 patients in everyday work, both for CXR and CT imaging.
Chest X-ray imaging
Although the CT imaging is the best method of assessing the specific abnormalities of the disease and its evolution in time, the increasing number of hospitalised patients and the indisputable increase of radiological examinations make the constant use of chest CT scans difficult to sustain.
The rapid course of SARS-CoV-2 infection and the severity and progression of lung aberrations require a method of radiological evaluation to implement and manage the appropriate treatment for infected patients.
While the CXR examination has a very low sensitivity for the detection of pulmonary abnormalities in the early-stage disease, it can be widely used for monitoring the progression and later stages of COVID-19, especially in patients in a critical state.
Here we present scoring methods used to determine the intensity of the disease in CXR images.
SARI chest X-ray severity scoring system
This system was presented by Taylor et al. in “BMC Medical Imaging” in 2015 [10]. The authors intended to develop and validate a CXR scoring system that could be used by non-radiologist clinicians to assess patients with acute respiratory diseases.
It was created in the pre-COVID era, and its goal was to simplify the clinical grading of CXR reports into five different severity categories in hospitalised patients with confirmed acute respiratory infection.
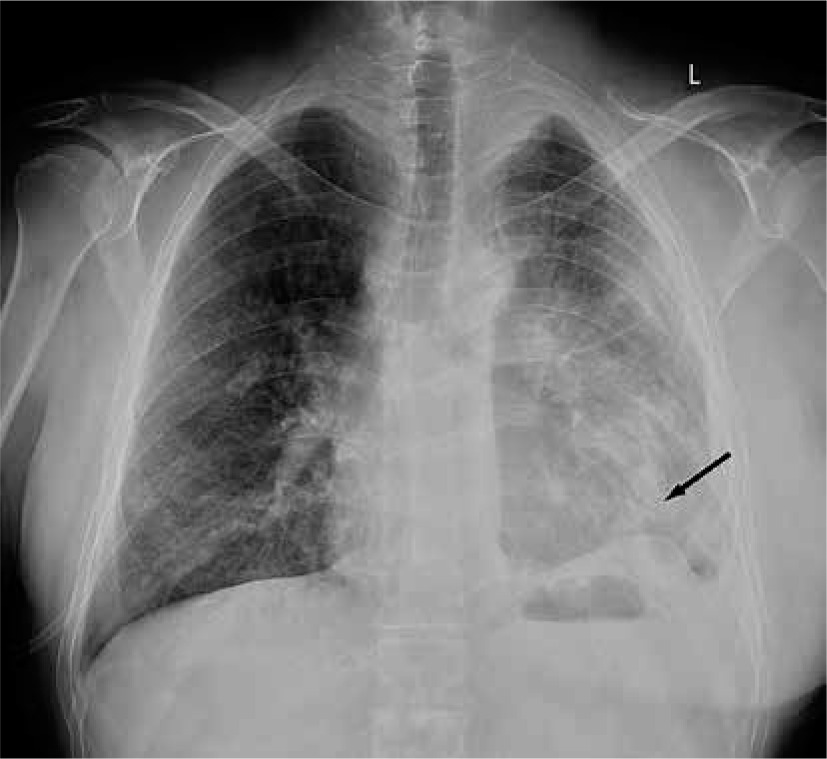
CXR findings were categorised as: 1 – normal; 2 – patchy atelectasis and/or hyperinflation and/or bronchial wall thickening; 3 – focal consolidation; 4 – multifocal consolidation; and 5 – diffuse alveolar changes (Figure 1).
Figure 1
Chest X-ray image of a COVID-19-positive patient with lungs assessed in SARI severity scoring system at 5 points. The arrow shows diffuse alveolar changes
It was reported only once by Yoon in Southern Korea [11] that this scoring system was used to quantify the pulmonary involvement in COVID-19 patients.
RALE classification
This is a system presented by Wong et al., which was published in “Radiology” in March 2020 [12]. The aim of this study was to describe the course and severity of CXR findings in COVID-19 and correlate them with rt-PCR results.
The authors adapted and simplified the Radiographic Assessment of Lung (O)Edema (RALE) score proposed by Warren et al. in 2018 [13].
Each lung was assessed individually, and depending on the extent of involvement by consolidation or ground-glass opacity a score of 0 to 4 points was given (0 – no involvement; 1 – less than 25%; 2 – 25% to 50%; 3 – 50% to 75%; 4 more than 75% involvement). The overall score was the sum of points from both lungs (Figure 2).
Figure 2
Chest X-ray image of a COVID-19-positive patient with lungs assessed in RALE classification at 4 points. Both lungs are assessed individually - right lung was evaluated at 1 point and left lung at 3 points. The overall RALE score was 4 points

This study included 64 patients (26 men, 38 women, mean age 56 ± 19 years). Chest X-ray findings in COVID-19 patients frequently showed bilateral lower zone consolidation, which peaked 10-12 days after symptom onset; the highest recorded score was 8 and the median CXR severity score was 3.
Out of the 20 patients who had normal baseline CXRs, seven developed abnormalities on follow-up CXR.
Chest X-ray score
This is the only method to date of assessing CXR, designed specifically for patients with confirmed COVID-19. It was proposed by Borghesi and Maroldi in March 2020 [7].
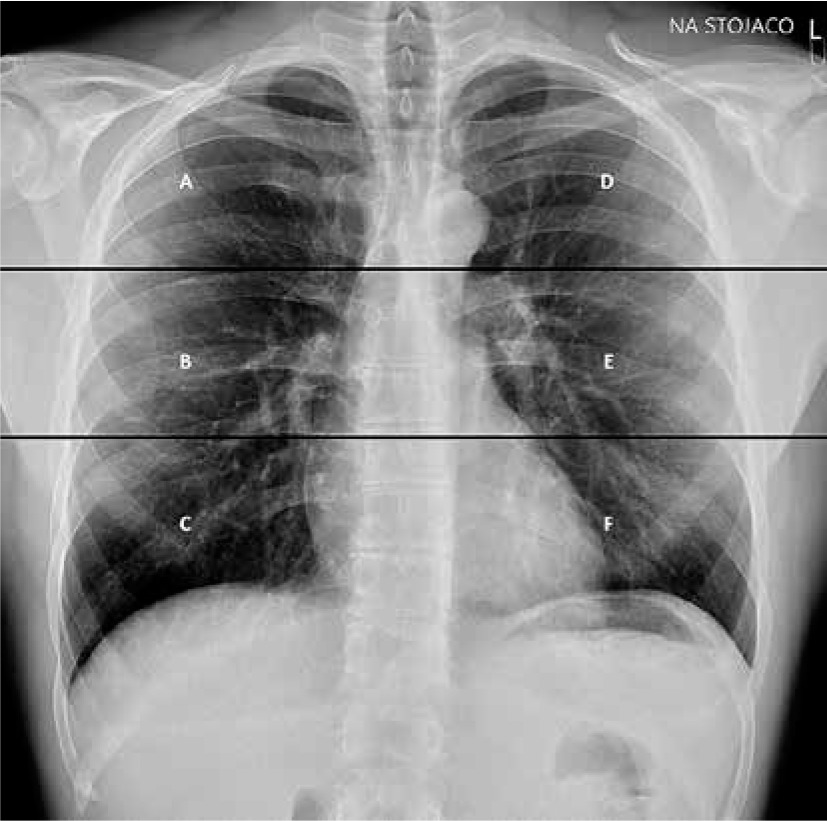
This CXR scoring system includes two steps of imaging analysis. The first step is to divide each lung into three zones on frontal chest projection (PA or AP), marked as letters A, B, and C for the right lung and D, E, and F for the left lung.
The letters divide lungs into three levels: upper level (A and D) – above the inferior wall of the aortic arch; middle level (B and E) – below the inferior wall of the aortic arch and above the inferior wall of the right inferior pulmonary vein (the hilar structures); and lower level (C and F) – below the inferior wall of the right inferior pulmonary vein (the lung bases) (Figure 3).
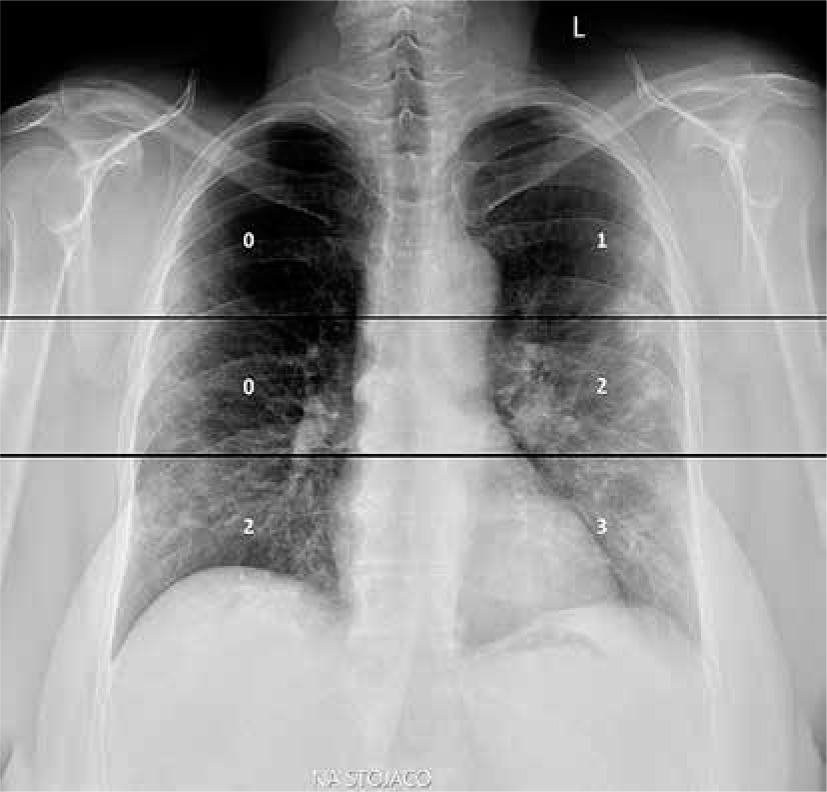
The second step is to assign a score (from 0 to 3 points) to each zone based on the detected lung abnormalities: 0 – no lung abnormalities; 1 – interstitial infiltrates; 2 – interstitial and alveolar infiltrates (interstitial predominance); and 3 – interstitial and alveolar infiltrates (alveolar predominance). The overall score is the sum of the points from all the zones with a range from 0 to 18 (Figures 4 and 5).
Figure 4
Chest X-ray image of a COVID-19-positive patient with lungs assessed in chest X-ray sore at 0 points

Figure 5
Chest X-ray image of a COVID-19-positive patient with lungs assessed in chest X-ray sore at 8 points
The overall CXR score as well as the partial score of each zone can be seen at the end of the report.
This study included 100 patients hospitalized patients with confirmed SARS-CoV-2 infection. The reports ranged from 0 to 16 with a median of 6.5. The CXR score was significantly higher in patients who died than in those who were discharged from the hospital (p ≤ 0.002).
Computed tomography imaging
CT imaging is the most effective method for detecting lung abnormalities in patients with COVID-19. In the early months of the ongoing pandemic CT scans were considered as the primary tool for COVID-19 detection in epidemic areas [14] and were even used for diagnosing patients with this disease.
In these cases, the exposure to side effects of performing the scans had to be diminished as much as possible; therefore, the protocol for CT in monitoring the course of the disease was limited to performing a native phase with a small dosage of radiation with no contrast administered.
However, despite having very high sensitivity (up to 90%) [15], CT has very low specificity, and typical abnormalities cannot be distinguished from other viral infections, such as pneumonia in the course of influenza or adenovirus infections. This excludes tomography from being used as a tool of definitive diagnosis of SARS-CoV-2 infection.
Nevertheless, the high sensitivity of CT makes this method ideal for assessing the severity of the disease in patients with confirmed COVID-19.
In order to properly standardise and quantify the radiological examinations, physicians all over the world implemented different algorithms of evaluating the severity of lung abnormalities. Below, we present three most promising scales to determine the severity of pulmonary involvement of COVID-19.
Chest computed tomography severity score
This method was proposed by Yang et al. and was published in “Radiology” in March 2020 [16]. It was created to help assess COVID-19 burden on the initial scan obtained at admission and provide an objective approach to identify patients in need of admission to hospital. The score (CT-SS) is an adaptation of a method previously used during the SARS epidemic of 2005 [17].
This scale uses lung opacification as an equivalent for extension of the disease in the lungs.
In this study, the 18 segments of both lungs were divided into 20 regions, in which the posterior apical segment of the left upper lobe was subdivided into apical and posterior segmental regions, while the antero-medial basal segment of the left lower lobe was subdivided into anterior and basal segmental regions.
Then, the lung opacities in all of the 20 lung regions were subjectively evaluated on chest CT. Each region was scored 0, 1, or 2 points depending on the parenchymal opacification involved: 0%, 1-50%, or 51-100%, respectively.
The overall CT severity score was defined as the sum of the points scored in each of the 20 lung segment regions, which ranges from 0 to 40 points.
In the study, the authors included 102 patients with confirmed SARS-CoV-2 infection in rt-PCR (53 men and 49 women, 15-79 years old, 84 cases with mild and 18 cases with severe disease)
The optimal CT-SS threshold for identifying severe COVID-19 was 19.5 points, with 83.3% sensitivity and 94% specificity.
The inter-observer ICC for CT-SS was found to be excellent, with median ICC 0.925 and mean ICC 0.936 for 102 patients.
Total severity score
This method was presented by Kunwei et al. and was published in “European Radiology” in March 2020 [18]. The main objective of the study was to explore the relationship between the imaging manifestations and clinical classification of COVID-19.
The authors of the study assessed each of the five lobes of the both lungs for the presence of inflammatory abnormalities, including the presence of ground-glass opacities, mixed ground-glass opacities, or consolidation.
Each lobe could be awarded 0 to 4 points, depending on the percentage of the involved lobe: 0 (0%), 1 (1-25%), 2 (26-50%), 3 (51-75%), or 4 (76-100%) (Figures 6-11).
Figure 6
Computed tomography scans of a COVID-19-positive patient in axial projection. Lungs were assessed in modified total severity scoring system (mTSS) at 6 points. The main features of lung involvement are regions of ground glass opacity; therefore, the overall mTSS score is 6A
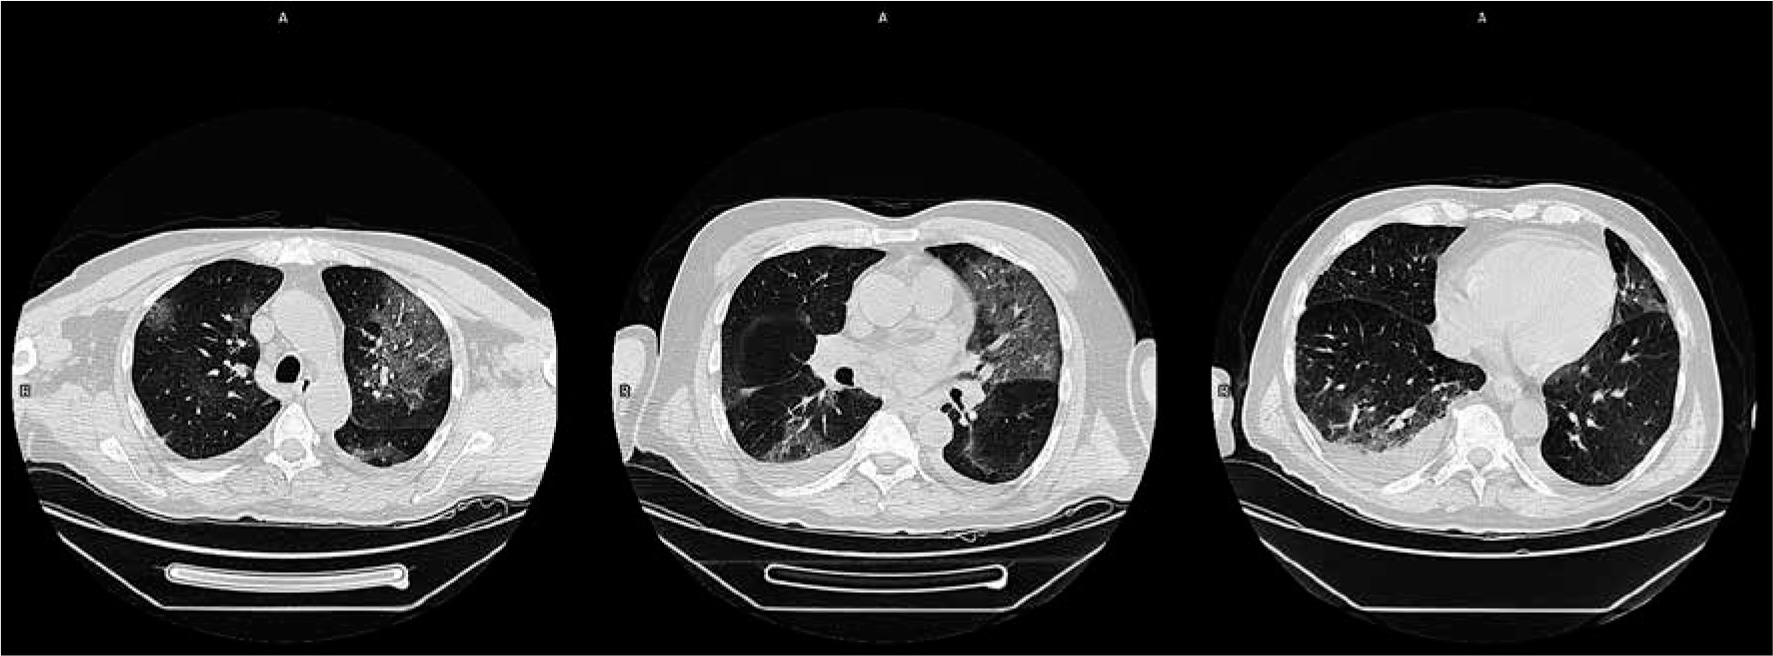
Figure 7
Computed tomography scans of a COVID-19-positive patient in sagittal projection. Lungs were assessed in modified total severity scoring system (mTSS) at 6A
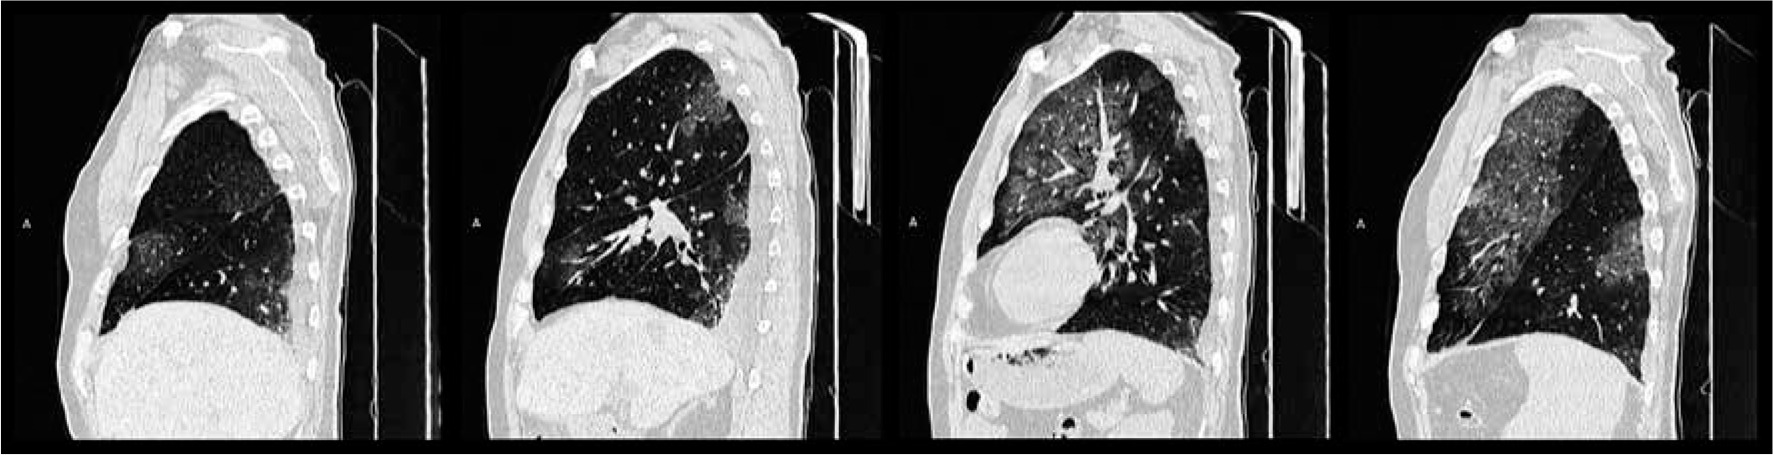
Figure 8
Computed tomography scans of a COVID-19-positive patient in coronal projection. Lungs were assessed in modified total severity scoring system (mTSS) at 6A
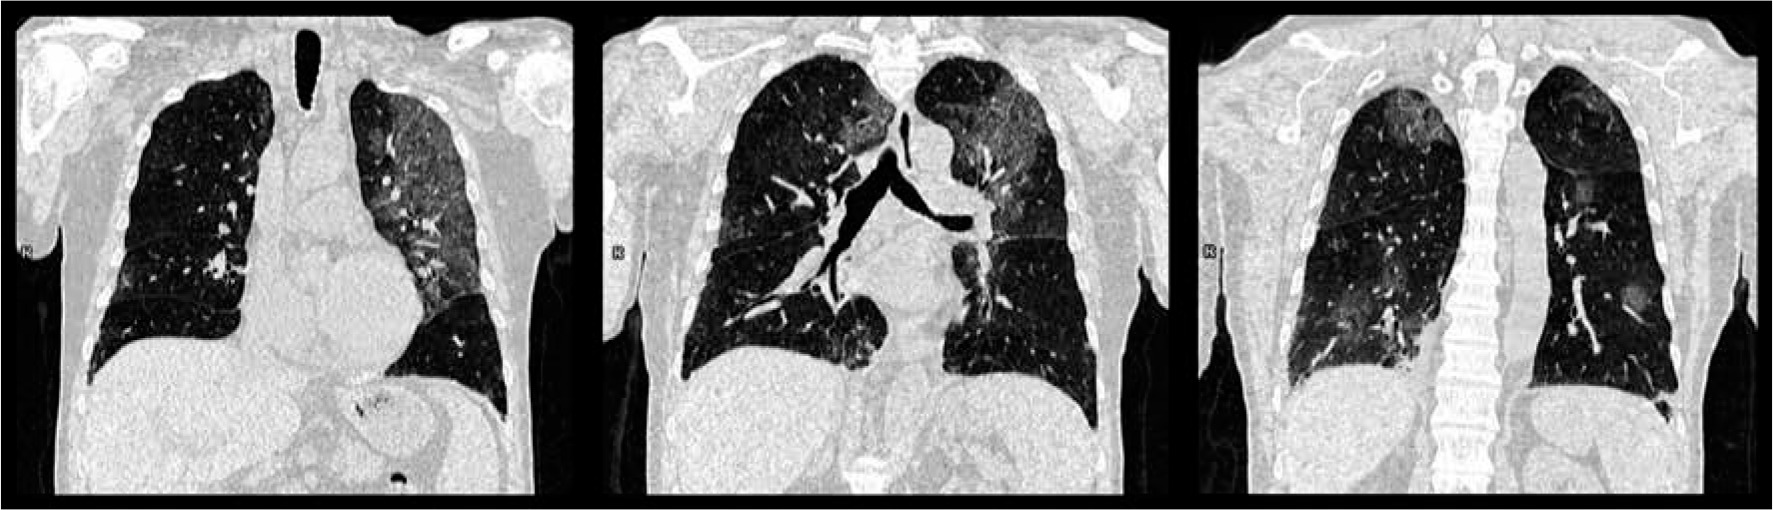
Figure 9
Computed tomography scans of a COVID-19-positive patient in axial projection. Lungs were assessed in modified total severity scoring system (mTSS) at 18 points. The main features of lung involvement are consolidations; therefore, the overall mTSS score is 18C
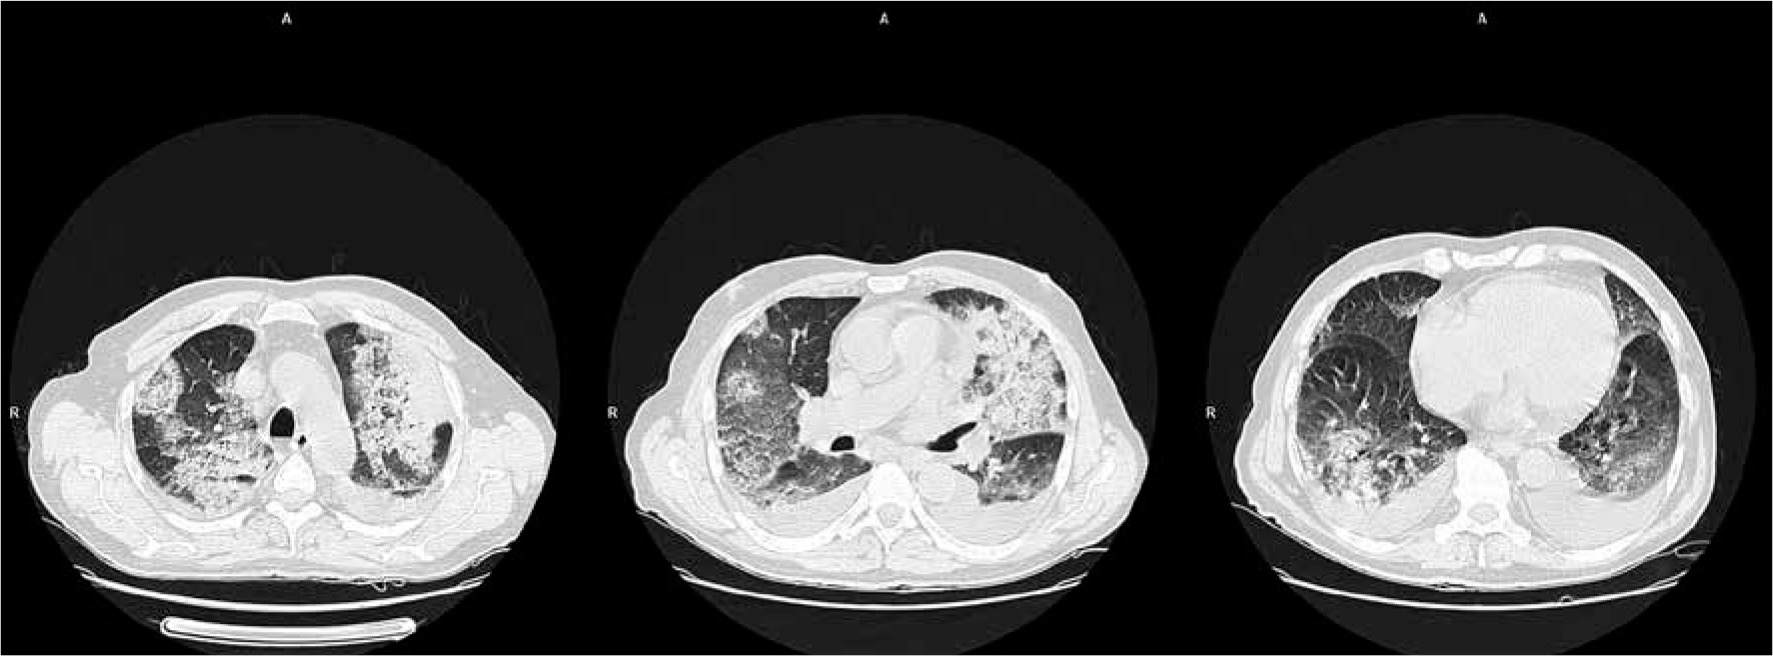
Figure 10
Computed tomography scans of a COVID-19-positive patient in sagittal projection. Lungs were assessed in modified total severity scoring system (mTSS) at 18C
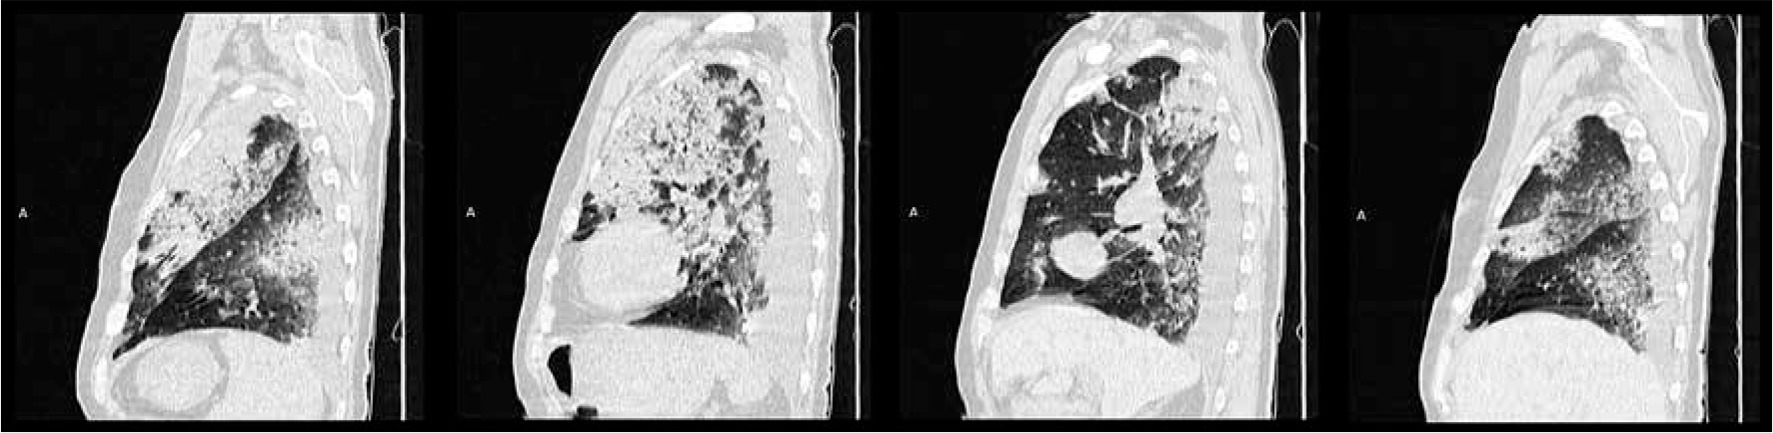
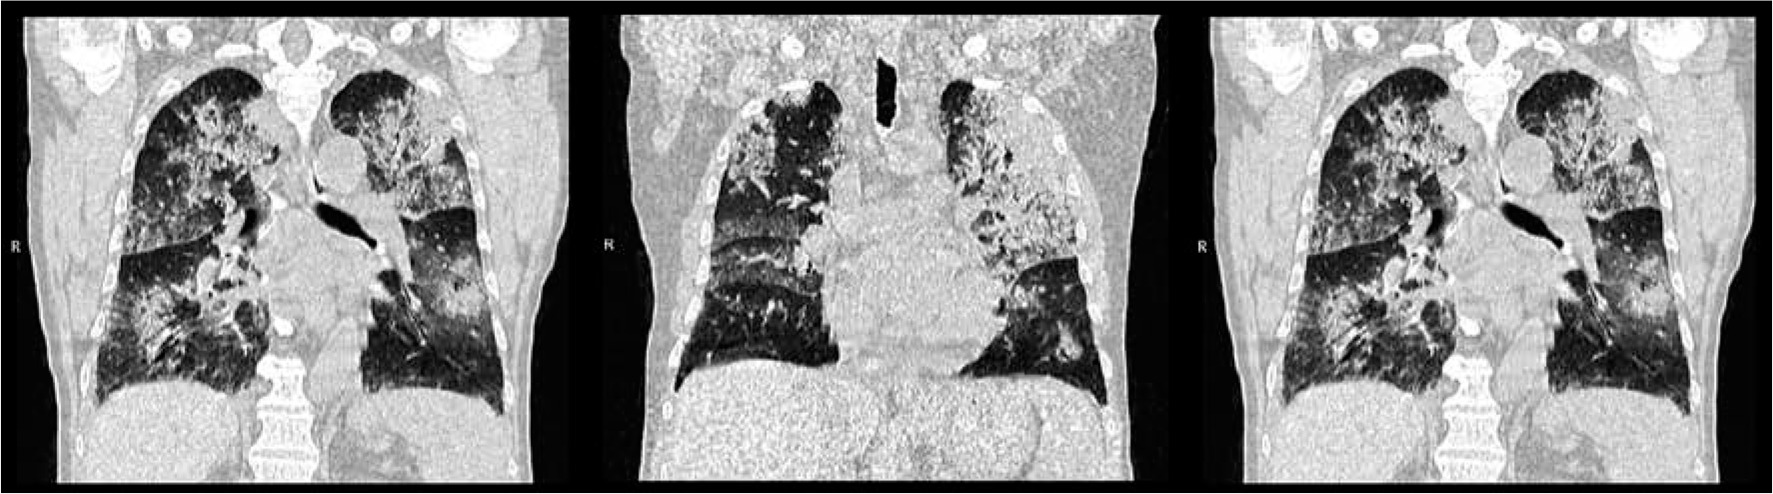
Figure 11
Computed tomography scans of a COVID-19-positive patient in coronal projection. Lungs were assessed in modified total severity scoring system (mTSS) at 18C
The total severity score (TSS) was then reached by summing the points from each of the five lobes. The TSS cut-off for identifying severe-critical type of 7.5 with 82.6% sensitivity and 100% specificity.
In this study, the authors included 78 patients with confirmed SARS-CoV-2 infection in rt-PCR, divided into four groups: minimal, common, severe, and critical disease (24 patients with minimal, 46 with common, six with severe, and two with critical disease). All CT images were reviewed by two radiologists with five and three years of experience in radiology.
The consistency of results of this method from two readers showed good repeatability with ICC – equal to 0.976 (95% confidence interval 0.962-0.985).
Chest computed tomography score
This method was presented by Li et al. and was published in Investigative Radiology in March 2020 [19]. The authors intended to find another objective method to identify significant radiological differences between severe and milder cases of COVID-19.
Similarly to the TSS scale, in this study both lungs were divided into five lobes, and each lobe was assessed individually. The abnormalities that were considered significant for the disease included the following: ground-glass opacity, consolidation, nodule, reticulation, interlobular septal thickening, crazy-paving pattern, linear opacities, subpleural curvilinear line, bronchial wall thickening, lymph node enlargement, pleural effusion, and pericardial effusion.
Each lobe could be awarded a CT score from 0 to 5, depending on the percentage of the involved lobe: score 0 – 0% involvement; score 1 – less than 5% involvement; score 2 – 5% to 25% involvement; score 3 – 26% to 49% involvement; score 4 – 50% to 75% involvement; score 5 – greater than 75% involvement.
The overall CT score was the sum of the points from each lobe and ranges from 0 to 25 pints. The cut-off value for identifying severe cases of COCID-19 of CT score was 7, with the sensitivity and specificity of 80.0% and 82.8%, respectively.
All the scans were assessed by two chest radiologists with 10 and 8 years of experience, who were blinded to the clinical data evaluated the CT findings in consensus.
Conclusions
The pandemic of SARS-CoV-2 continues to grow. Each day hundreds of thousands of newly diagnosed patients appear, not only blocking the treatment capability of hospitals and intensive care units, but also the diagnostic capacity of medical facilities.
There is a noticeable need for proper radiological assessment of patients freshly diagnosed with COVID-19 as well as the ones with ongoing disease. Objective evaluation of the course of the infection gives the possibility to choose the correct treatment and to classify the infected properly.
There are only a few tools that can be used to turn radiological reports into measurable results, but they are very promising. Quantifying the radiological data is crucial for standardisation of the outcome.
Radiology is one of the fastest developing medical fields. Its connection to modern technology is the reason why industry can help to set a milestone in diagnostics. One such promising branch of new technology in radiology is artificial intelligence, which is useful in finding patterns of specific diseases.
Without standardised and quantified results of chest imaging, there is no possibility to create neural networks for deep learning programs to help radiologist assess a rising number of examinations as well as to help clinicians acquire results much faster, in order to rapidly apply appropriate treatment.
Implementing and using scoring systems in our radiology departments is the right step to make.
Which method should we choose, then? Each of them has its advantages but also some imperfections.
There are still no adequate systems for evaluating the CXR images of COVID-positive patients.
The SARI CXR Severity Scoring System [10] was designed for clinicians in the pre-COVID era and is subjective for a reporting physician. In our opinion, it has a very limited use for tracking the course of the disease.
Although the RALE classification was designed in 2018 [12], its modified version has been reported to be used in ongoing pandemic. It has been proven to successfully identify the changes in the course of infection, even though the reporting radiologist assesses the entire lungs as a whole, without dividing them into sectors.
The only method invented especially for assessing the evolution of SARS-CoV-2 infection is the CXR Scoring System of Andrea Borghesi and Roberto Maroldi [7]. More research is needed to recognise this method as a standard, but the accuracy and facility of assessment as well as the initial results are very promising.
In the Table 1 we list all the above-mentioned CXR scoring systems and compare their features.
Table 1
Comparison between CXR scoring systems mentioned in the review
| CXR scoring systems | |||
|---|---|---|---|
| SARI CXR severity scoring system [10] | RALE clasification [12] | CXR score [7] | |
| Lung regions to consider | No specified region | 2 lungs | 6 zones |
| Number of intervals | 5 | 5 | 4 |
| Level of involved organ assessment | No | Yes | Yes |
| Character of abnormalities assessment | Yes | No | Yes |
| Clear treshhold for severe COVID-19 | No | No | Yes |
The main benefit of CT-SS, proposed by Ran Yang [16], is the high accuracy of assessing the abnormalities. However, the number of regions needed to be processed by a radiologist may cause difficulties during evaluation.
In comparison to the Chest CT Severity Score, the Total Severity Score presented by Kunwei et al. [18] requires a smaller number of regions to be assessed; it includes, however, more intervals to consider during evaluation.
Chest CT Scoring System of Li et al. [19] has a similar assessment algorithm to the TSS; however, the number of intervals for evaluation is even greater.
According to the authors of the CT-SS and TSS scoring systems, the inter-observer consistency in reading the radiological studies is excellent.
It is worth mentioning that in all cited systems the radiological studies were examined by at least two physicians.
Computed tomography is the best imaging method not only for assessing the involvement of the lungs, but it is also the best and the fastest method for evaluating the character of abnormalities.
In our department, we found the TSS system to be an optimal scoring method for diagnosticians to follow.
The character of abnormalities is not taken into account in the presented diagnostic algorithm. The abundance of specific patterns of pulmonary involvement may imply the time point in the course of the infection. The intensity of these abnormalities may not only be helpful in evaluating the stage of COVID-19, but it can also suggest the severity of the disease.
Therefore, we decided to modify the Total Severity Score (mTSS) scale and to include additional qualitative features of lung involvement: A – ground glass opacity, B – crazy-paving pattern, C – consolidations, X – character other than enlisted.
The overall result is the sum of the points from each of the five lobes and a letter that represents the most abundant abnormality in both lungs (e.g. 15C – the majority of the abnormalities were consolidations).
In Table 2 we enlist all the above-mentioned CT scoring systems and compare their features.
Table 2
Comparison between CT scoring systems mentioned in the review
| CT scoring systems | ||||
|---|---|---|---|---|
| CT-SS [16] | TSS [18] | Chest CT score [19] | mTSS | |
| Lung regions to consider | 20 segmental regions | 5 lobes | 5 lobes | 5 lobes |
| Number of intervals | 3 | 5 | 6 | 5 |
| Level of involved organ assessment | Yes | Yes | Yes | Yes |
| Character of abnormalities assessment | No | No | No | Yes |
| Sensitivity | 83.3% | 82.6% | 80% | No data |
| Specificity | 94% | 100% | 82.8% | No data |
| Mean inter-observer ICC | 0.936 | 0.976 | No data | No data |
Although there are insufficient data to definitively take one of the sides, the golden balance to aim at when it comes to choosing and implementing a specific method in radiology departments is to produce a clear scoring algorithm, obtaining a definitive cut-off threshold for identifying severe COVID-19 cases and reaching good repeatability between specialists.
Such inter-observer consistency is crucial in finding a standard scoring algorithm. The top feature of such a system should be the production of as many objective and repeatable results as possible, in order to obtain data in quantified form.
The future of radiology follows technological advancement. We started gathering data in quantified form not only to create the most reliable and comparable results to find the optimal treatment, but also to allow technological industry create new tools that will eventually elevate the level of modern medicine.