


Introduction
A frequent and often lethal complication of a venous thromboembolism is a pulmonary embolism (PE). The in-cidence in the US is about 112 per 100,000, with rates of about 1/5th of this in Asian countries [1], and overall increasing rates in recent years [2,3]. A PE causes partial or complete blockage of arterial blood flow to the lungs [4]. Patients present with variable symptoms, and the specific diagnosis of PE is difficult to reach based on clinical information alone [4]. Conventional computed tomographic pulmonary angiography (CTPA) is a non-invasive and highly accurate method for early detection of PE, leading to early treatment [1,5]. A previous meta-analysis reported that the overall sensitivity and specificity of CTPA were 82% and 94.9%, respectively [6]. Dual-energy CTPA has recently been proposed as a technique to aid in the detection of PE [7-12]. The addition of lung perfusion information from a postprocessing iodine distribution map can enhance the reading results, without excess radiation or acquisition time [1,8-10,12-14].
Currently, functional imaging of the lung is a standard component of nuclear medicine using lung scintigraphy. Many studies have found that a dual-energy CTPA with an iodine distribution map increased the sensitivity of the PE detection from 67% to 89%, as well as providing more information than lung scintigraphy [1,12,15-17]. Dual-energy CTPA demonstrates anatomy, thrombus, other pulmonary diseases if present, and perfusion information, while lung scintigraphy provides perfusion information alone [18-20]. Moreover, dual-energy CT uses a single iodinated contrast injection. Thus, there is no need for subsequent lung scintigraphy with an additional radiopharmaceutical injection, which may lead to more allergic reactions to the radiotracer and injection site reaction than a single iodinated contrast injection [20-23].
Many studies found correlations between perfusion defects in PE patients and adverse clinical outcomes [18,24,25]. Perfusion defects revealed by lung scintigraphy were associated with dyspnoea, shorter distances covered in the 6-minute walk test, higher pulmonary vascular resistance, and higher mean pulmonary artery pressure [25,26]. The extension of perfusion changes can be used as a predictor of haemodynamic changes in acute PE [26]. Knowing a perfusion defect is present can help localize a PE clot and its severity, which is beneficial for treatment planning. Thus, the quantification of perfusion changes in PE patients could become an integral part of risk assessment [18].
Nowadays, conventional CTPA studies are increasingly used by clinicians, but they cannot provide perfusion information as can dual-energy CTPA. Although perfusion studies have many advantages, the required technologies are not available in most middle to lower income countries. Thus, it would be useful if there was a way to use information received from a conventional CT to predict the extent of perfusion defect.
To our knowledge, only a few studies have used their own CT scoring system on conventional CTPA to evaluate the degree of pulmonary vascular obstruction, assess the severity of PE, and predict perfusion defects on lung scintigraphy [15,25,27]. In the current study, we correlated the PE details from conventional CTPA against perfusion details from iodine distribution images. The objective was to predict the perfusion defects by clot size and pulmonary vascular stenotic degree on conventional CTPA images. This measurement method is simple and easy to use for every level of radiologist, whether with few or many years of experience. The data are highly quantitative, and thus consistent interpretations are easier to reach among radiologists of different levels of experience.
Material and methods
Study population
Our retrospective study was approved by the Human Research Ethics Committee (HREC). A total of 186 adults aged 15 years or above were enrolled in the study, all suspected to have PE because of major symptoms such as dyspnoea, hypoxia, chest pain, or leg swelling. All of them underwent a CTPA using a dual-energy CT machine between 15 November 2018 and 15 September 2020. Their baseline demographics were retrieved from the Hospital Information System (HIS). A picture archiving and communication system (PACS) inquiry was performed by the principal investigator (P.C.) to retrieve all dual-energy CTPA examinations. We used qualitative quality scores for qualitative control [14]. Fifteen CTPA studies were excluded due to poor imaging quality (2 studies), missing workstation data (8 studies), and the presence of artificial embolized mate-rials (5 studies), leaving 171 PE studies for analysis.
Imaging protocol, imaging reconstruction, and post-processing images
Conventional computed tomographic pulmonary angiography
All examinations were performed as a fundamental CTPA chest study protocol on a single-source CT scanner with a single detector layer (Revolution CT 1.0; GE Healthcare, Milwaukee, Wis). The dual-energy CT technique was applied only in arterial phase images, while the venous phase was reconstructed as a conventional image.
All patients received intravenous iopromide (Ultravist 370 mg) infused via peripheral venous catheter. A dual-bolus intravenous contrast technique was used to perform both the pulmonary arterial (PA) and venous phases, in line with the current literature [28-30].
The region of interest (ROI) was at the level of the main pulmonary artery with a trigger threshold of 100 Hounsfield units (HU). The scanning length covered from the aortic arch to the dome of the diaphragm.
Iodine distribution map
The iodine distribution maps were generated on a workstation computer with specific dual-energy post-processing software (GE Healthcare with AW Server version 3.2) [31-33]. For the iodine maps, a slice thickness of 2 mm with a 2-mm increment of the pulmonary arterial phase image at 70 KEV was generated.
Imaging interpretation
Conventional computed tomographic pulmonary angiography
All images were independently reviewed by 2 thoracic radiologists (13 years each of attending thoracic radiology experience; S.N. and N.K.), who were completely blinded. The CTPA images were interpreted on the pulmonary arterial phase with soft tissue reconstruction and mediastinal window (window width [WW] 350-500 HU and window-level [WL] 40-50 HU) [34,35].
The measurements for all affected luminal diameters were obtained by P.C. from the axial images and made from inner wall to inner wall and perpendicular to the wall at least twice. The largest diameter on the transverse axial image was used.
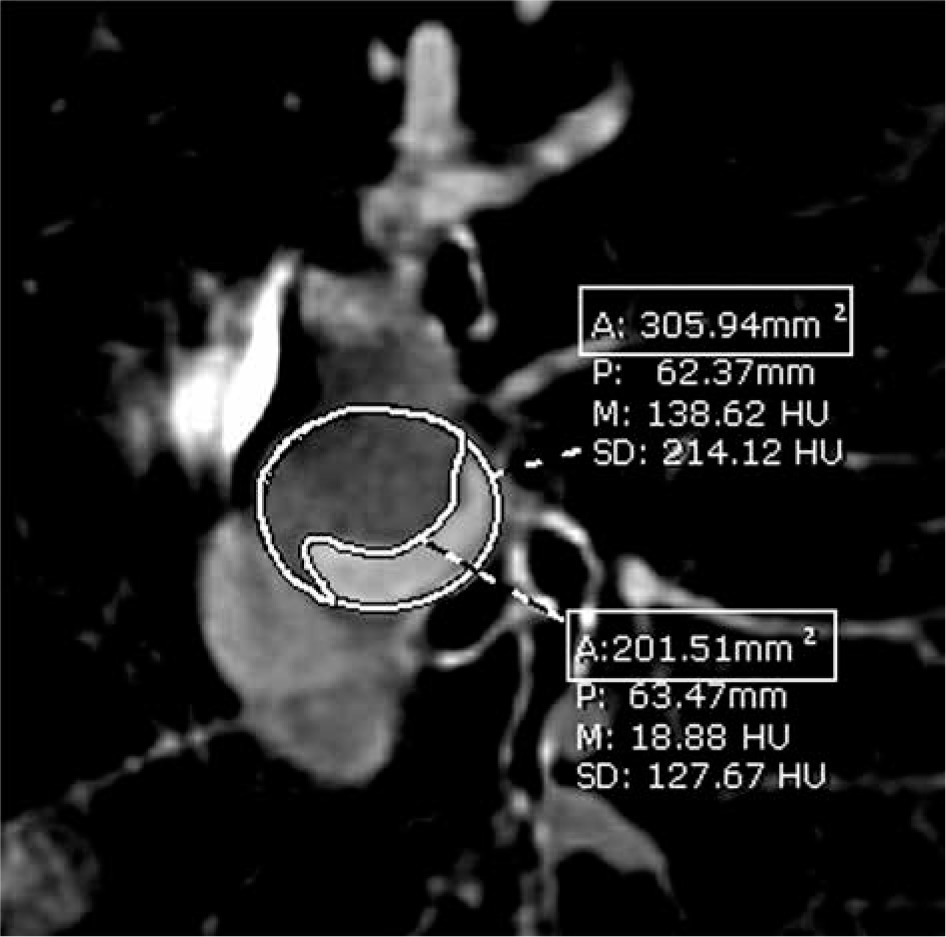
Each PE lesion was categorized by type, location, size, stenotic degree, and other pulmonary findings. Each clot size was classified either as large branch (main, lobar, or segmental PE) or small branch (subsegmental PE). The degree of stenosis was assessed on the cross-sectional view of the affected vessel. The expected percentage of obstruction was calculated from the value of the occluded area divided by the total luminal area using the area demarcated manually by the radiologist (Figure 1). The highest degree of stenosis of each size was used for analysis. Each radio-logist reviewed the images on 2 occasions separated by at least 2 days, then classified the degree of vascular stenosis into 5 categories by percentage reduction in vascular diameter as less than 25%, 25-49%, 50-74%, 75-99%, and 100% [27,36]. Any discrepancy between the 2 radiologists was reconciled by discussion until consensus was reached.
Iodine distribution map
Axial and coronal images were used for interpretation. A perfusion defect was defined as an area of low iodine distribution within the lung parenchyma demonstrating hypoattenuation on the iodine map. Patterns of perfusion defects were distinguished and classified into presence (triangular-shaped defect and peripheral location) or absence (normal lung perfusion, irregularly shaped defect, or band-like artifact) (Figure 2) [10]. The lowest density in each perfusion defect area by visualization was chosen for measurement of iodine concentration.
Figure 2
Pulmonary embolism on conventional computed tomographic pulmonary angiography (CTPA) and iodine distribution map. A CTPA with a mediastinal window shows a thrombus in the large branch of the right lower lobe (A, arrow), consistent with a triangular-shaped perfusion defect with peripheral location in the iodine distribution map (B and D, white frame). A band-like artifact with an irregular shape is also seen in the left upper lobe on the same image (B, dotted frame). The iodine concentrations using ROI analysis were measured (C). The value at the defect area (ROI 3) was 2.53 mg/cm3 and at the normal area (ROI 4) it was 26.77 mg/cm3. The iodine concentration ratio was 0.09
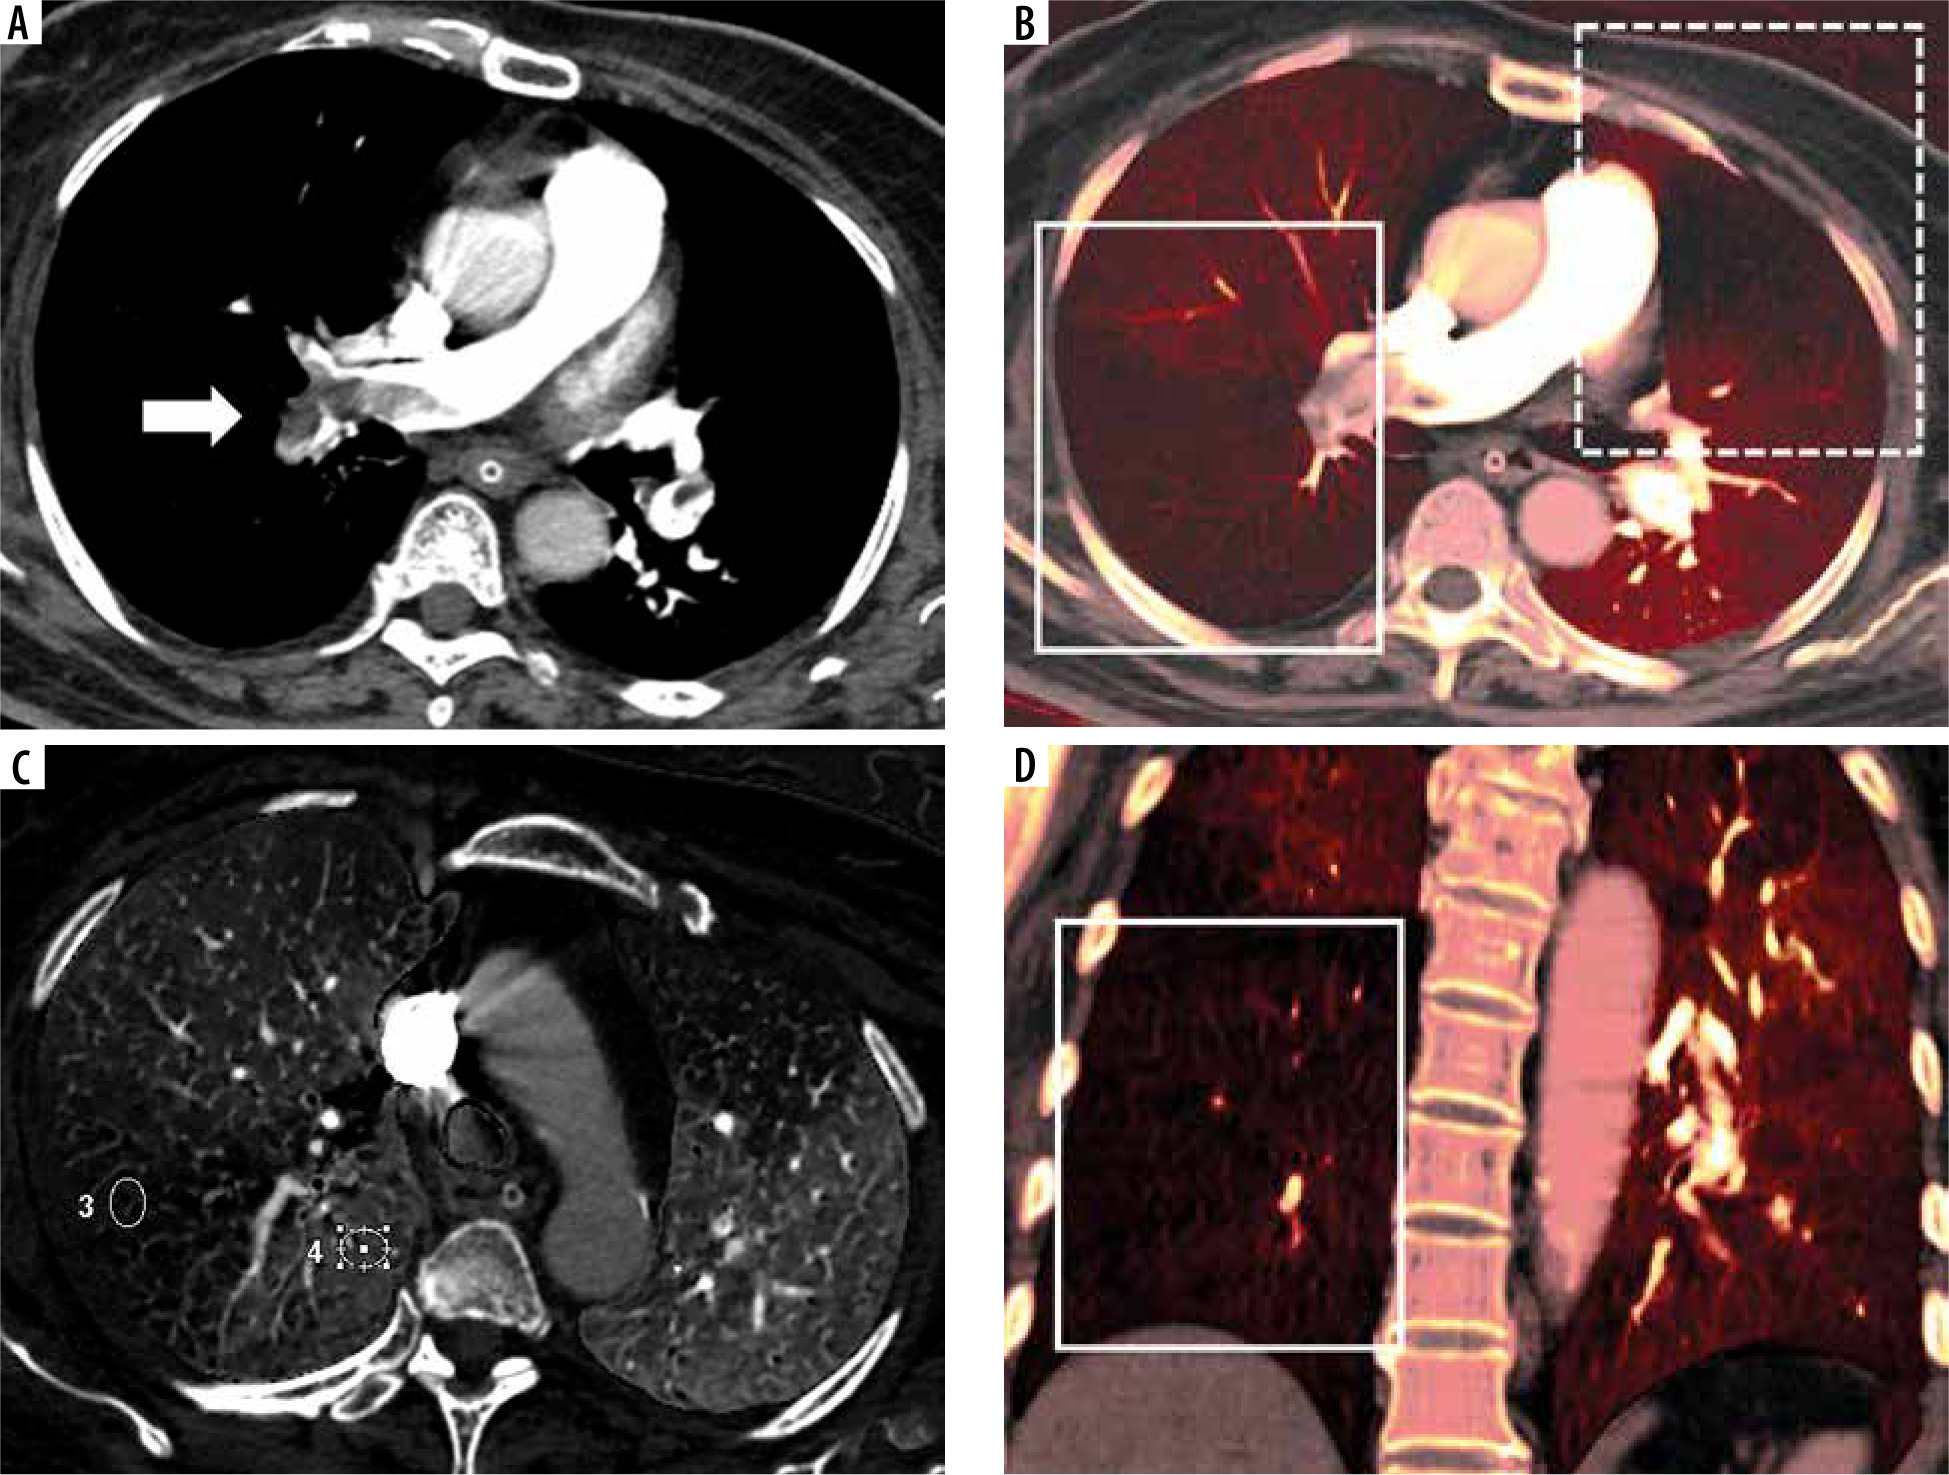
The iodine concentration was measured in milligrams per cubic centimetre (mg/cm3) by placing a 50 mm2 ROI at the same anatomical level (Figure 2), in order to assess the comparability between the scan with and without a perfusion defect. The iodine concentration ratio was calculated from the value at the defect area divided by the normal area.
Statistical analysis
Quantitative parameters are presented as mean ± standard deviation (SD) for continuous variables with normal distribution and median ± interquartile range (IQR) for those without normal distribution. The categorical variables were summarized using frequencies and percentages. The study analysis was computed by R program version 4.0.2 with RStudio server version 1.3.1073. Demographic and clinical characteristics were compared between the perfusion defect groups. The c2 test was used for categorical variables and t-test was used for continuous variables. Significant variables were noted as possible confounders. For further main hypothesis testing, lesions with and without perfusion defects were compared. Finally, GEE logistic regression was used to predict perfusion defects detected at each lesion, with the subject ID number being the repeating unit.
Results
From a total of 186 CTPA studies, only acute or chronic PE studies were enrolled, classified into 52 PE patients and 144 PE locations. PEs were detected in 16 patients and not detected in 36 patients. Of the PE locations, 45 lesions were rated as having a perfusion defect and 99 lesions were rated as no perfusion defect (Figure 3).
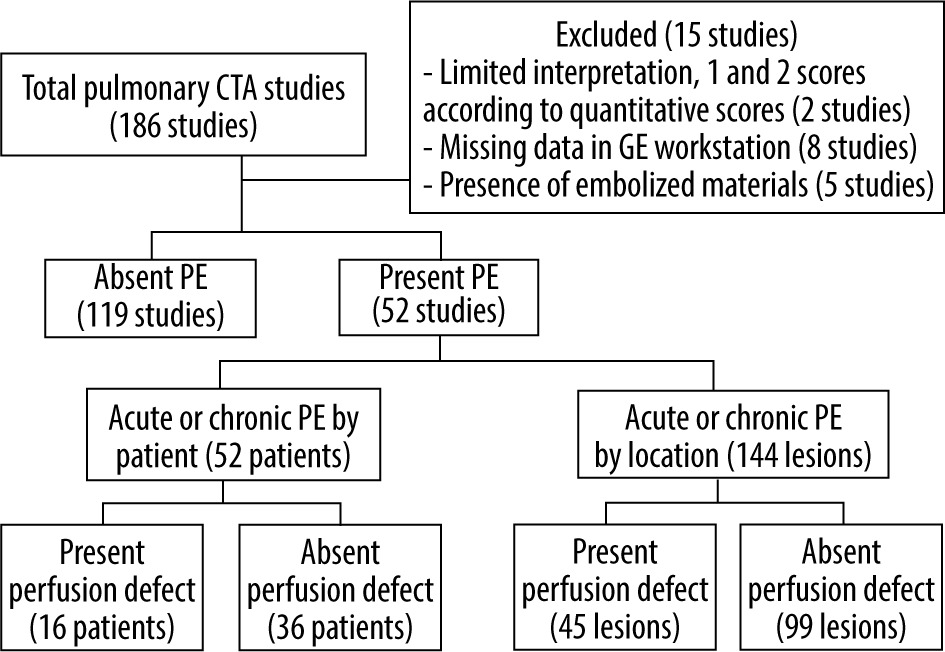
Table 1 shows the patient characteristics compared between the group with and without perfusion defects using univariate analysis. There was no evidence of association between gender, age, major underlying disease, presenting symptoms, timing of clinical presentation, blood pressure, heart rate, respiratory rate, oxygen saturation, body weight, choice of treatment, and clinical outcome within 60 days of diagnosis.
Table 1
Demographic and clinical characteristics by perfusion defect (n = 52 subjects)
Table 2 shows that there were no statistically significant differences in volume of contrast media, injection rate of contrast media, and quantitative quality score of the CT studies among the PE patients with and without a perfusion defect. Forty-five perfusion defect areas were measured for their iodine concentration. The mean and median concentrations were lower in the defect areas than in the normal areas. The iodine concentration ratios had a median of 0.11 and ranged from 0.01 to 0.61.
Table 2
Technical data and iodine concentration measurement
The inter-observer agreement calculations are shown in Table 3. All assessments of PE including detection, type, size, location, stenotic degree, and detection of perfusion defect had excellent agreement.
Table 3
Interobserver variability
A comparison of the CT findings between the PE patients with and without perfusion defect by PE location is presented in Table 4. The size of PE and the degree of vascular stenosis were significantly different between the 2 groups (p = 0.001 and p < 0.001, respectively). Lesions with higher degrees of vascular stenosis have higher percentages of perfusion defects. Other variables did not show statistically significant differences.
Table 4
Comparison of computed tomography (CT) findings by perfusion defect and pulmonary embolism (PE) location (n = 144 locations)
Table 5 summarizes the results of the generalized estimating equation (GEE) logistic regression model predicting the presence of perfusion defects. This multivariate analysis result confirms those from univariate analysis shown in Table 4.
Table 5
Generalized estimating equation (GEE) for perfusion defect
Discussion
Our study found no correlation between patient demographics, clinical characteristics, and anatomical data between the group of PE patients with and without perfusion defects. Univariate and multivariate analyses both found that size of PE and vascular stenotic degree could predict perfusion defect on conventional CTPA. The 2 significant predictors of perfusion defect were occluded vessels in both small and large branches together, or complete occlusion. Also, we found that lesions with higher degrees of vascular stenosis also have higher percentages of perfusion defect.
The clinical backgrounds and characteristics of our patients were similar to other studies, such as those of Sanchez et al. and Lee et al. [2,25]. The confirmed PE cases were predominantly found in women in the 6th and 7th decades of life. These elderly patients had higher prevalence of cardiac or pulmonary comorbidities due to a higher incidence of conditions associated with venous thromboembolic disease [37,38]. The women with PE were also older than the men, and they were more likely to have immobilization and congestive heart failure, which have been reported as significant risk factors for a thromboembolic event [39-42]. The common comorbidity in our study was malignancy, but there were no statistically significant differences in presenting symptoms, timing of clinical presentation, or choice of treatment. Even though our study conducted indirect assessments of the patients’ haemodynamic status from vital signs instead of clinical findings, as in a study by Sanchez et al., there were no significant differences in the vital signs between the groups with perfusion defects in the 2 studies [25]. This could be due to the populations of the studies having similar clinical backgrounds and characteristics.
The volume and rate of contrast medium injection were not associated with perfusion defects in our study. We had initially proposed that perfusion defects might differ by differing volumes and rates of contrast medium injection; however, the study findings falsified our hypothesis because these 2 variables were not significant predictors of perfusion defects. The main reason for this negative finding was probably due to the use of a standard protocol as the volume and rate of contrast injection were calculated based on each patient’s body weight [28-30]. To date there have been only a few studies reporting on quantitatively measured iodine concentrations [10,43]. The measurement was a feasible and reliable method to evaluate regional perfusion based on individual physiological variations. For these reasons, we created an iodine concentration ratio to reduce the effect of physiologic variation.
Interobserver agreement in our study was good, similarly to many prior studies, such as the one by Chae et al., which used subjective visualization for correlation of perfusion defects with the degree of pulmonary occlusion and location [24]. We used a simple technique for measurement and interpretation, including a vascular stenosis scoring system. With such high agreement, CTPA for diagnosis of PE should be reliable for general use by trained radiologists.
In this study, there was no significant association between perfusion defects and type of PE in the pulmonary arterial phase, a finding similar to that of a study by Hong et al. [44]. The Hong study also showed more enhancement of iodine attenuation at centrally located thrombi from the systemic collateral supply, which was found only in the delayed phase [44-46]. We did not perform delayed-phase dual-energy CT, which may have resulted in no association between perfusion defect and location of PE in our study. However, we chose a single pulmonary arterial phase in our routine practice to save time for the post-processing steps in our workflow. Unfortunately, we did not have a delayed-phase dual-energy CT during the study period, so we could not confirm whether it would have been useful.
Our study found that total occlusion of the pulmonary artery in conventional CTPA was associated with perfusion defects, a finding consistent with studies by Pontana et al. and Geyer et al. We found that pulmonary arterial occlusion involving both the large and small branches together was associated with perfusion defect rather than those small branches alone [8,10]. This result can be explained by noting that obstructed large vessels cause a large blood flow obstruction and decrease blood flow to the capillary bed, reflecting in increased perfusion defects in PE involving both large and small branches [19], while small vessel obstruction would promote systemic collateral supply in the normal lung via capillaries, resulting in fewer perfusion defects in PE involving only the small branches [47]. The evaluation of systemic collateral formation is important because it is a favourable prognostic factor for postsurgical outcome. Thus, the involvement of PE in only the small vessels may be an indicator of treatment success [44].
Lung scintigraphy has been used as a second-line diagnostic test because it has inferior spatial resolution to CTPA studies, inefficient for evaluation of anatomical data, and it takes a lot of time to perform [9]. Thus, an indirect method using conventional CT for assessment of pulmonary perfusion would be useful to provide additional information to improve diagnostic accuracy and predict clinical outcomes [18,24,25].
We found that perfusion defects could be predicted using conventional CTPA studies without any additional perfusion studies such as lung scintigraphy or iodine distribution map images. However, the imaging quality of the conventional CTPA study should be controlled, especially in small pulmonary arterial branches, including PE conspicuity, degree of pulmonary arterial enhancement, motion, and noise [14], because these common pitfalls in routine practice might cause limitations in interpreting the type and stenotic degree, leading to incorrect prediction of perfusion defects.
Our study had several limitations that should be noted. First, there were only data from a limited number of patients with pulmonary embolism, and no negative PE patients were enrolled from whom we could calculate the sensitivity and specificity. In addition, we did not perform delayed-phase dual-energy CT to evaluate lung perfusion. Further studies are recommended in both acute and chronic PE cases.