


Introduction
Magnetic resonance imaging techniques have constantly been developing in recent years. Researchers’ efforts are directed towards shortening the time of sequences, improving the resolution, and thus obtaining the most detailed images. Also, metabolic imaging such as magnetic resonance spectroscopy (MRS) has become the focus of many clinical and research centres. The information obtained during the spectroscopic study relates to the metabolic composition of tissues. Depending on the region of interest chosen, the study may refer to the observation of the metabolism of healthy tissues or those altered by disease. The main advantage of MRS is its relato be quite a high detection threshold (around 1 mM). To meet these limitations a new method of metabolic imaging named chemical exchange saturation transfer (CEST) has emerged. Initially it was mentioned referring only to the proton exchange process as early as in 1951 by Arnold and Liddel [1,2]. In 2000, for the first time named CEST, the method was shown by Ward and Balaban [3,4] as an alternative for known paramagnetic contrast agents. Since then it has become more popular and has been increasingly used in recent years. The aim of this work is to explain the physical basis of the CEST technique and to describe possible applications in clinical and research projects.
The basis of CEST technique
CEST is based on the phenomenon of chemical exchange between solute and water protons. Temporarily connected to the different chemical compounds, protons are constantly migrating and merging with water molecules. The speed of this process is determined by the parameter characteristic for each compound, called the exchange rate ksw (between two pools) [5]. The smaller pool contains exchangeable protons, and the larger pool reflects bulk water protons (Figure 1).
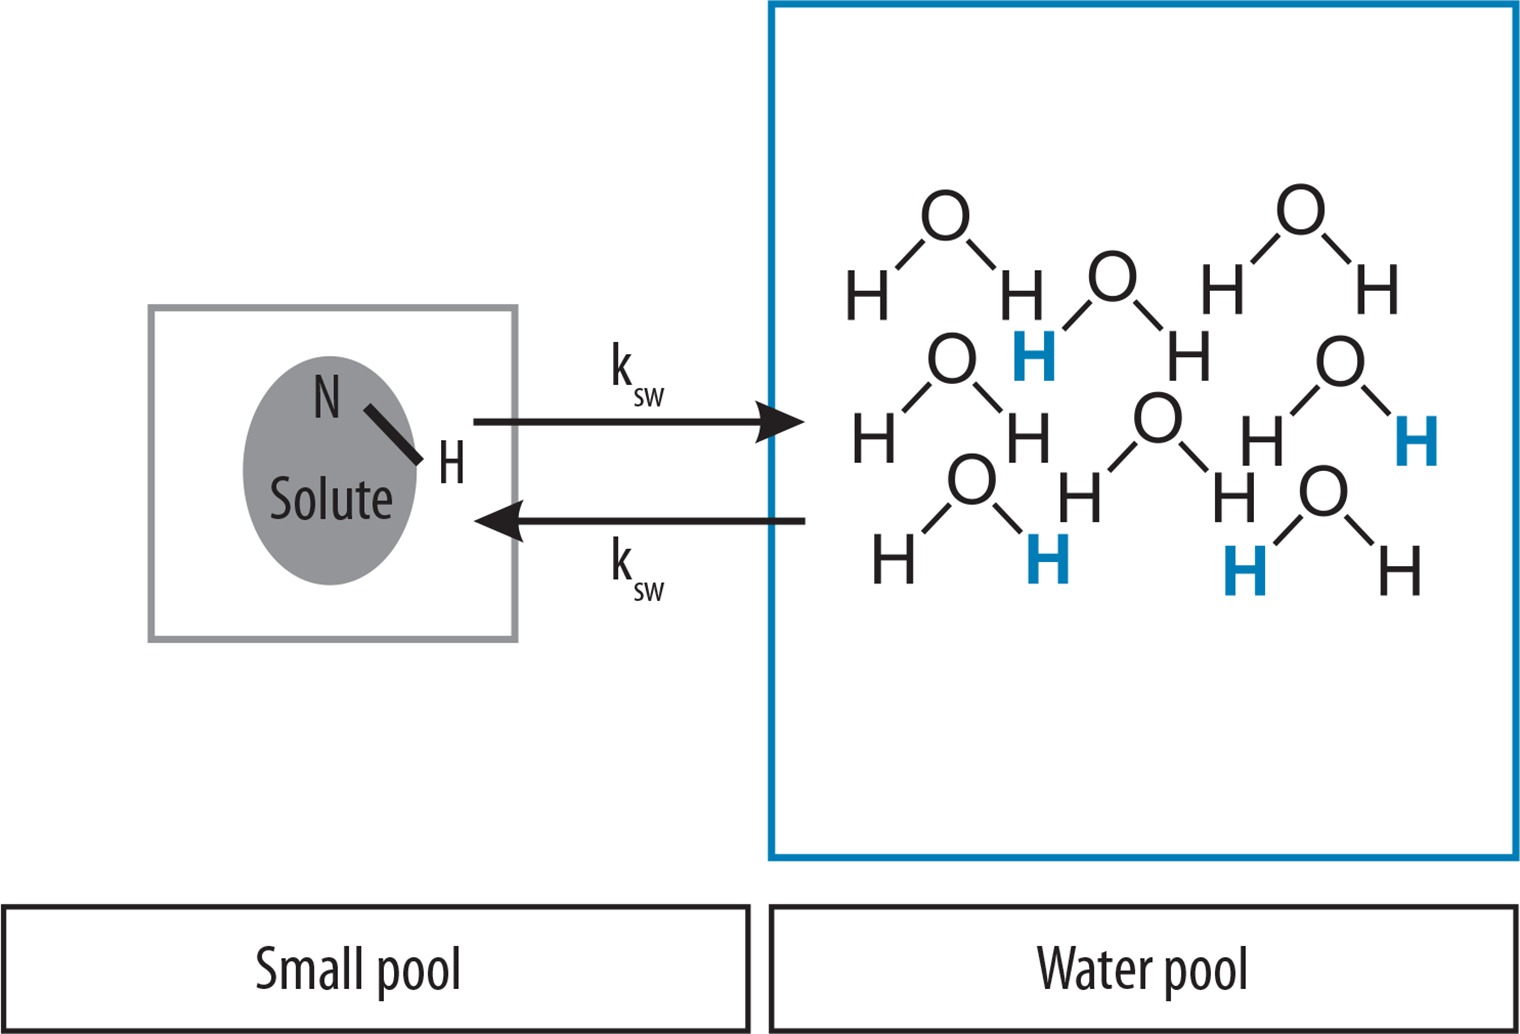
Exchangeable protons, due to the chemical environment, resonate in frequencies that are shifted with respect to the resonant frequency of water. During signal acquisition saturation pulses are transmitted at a frequency range that corresponds to chemical shifts of particular compounds. Respectively, saturation is transferred from the solute protons to the protons of the water, which results in attenuation of the total water signal. This signal loss is therefore proportional to the amount of compound with exchangeable protons. This gives an opportunity to indirectly measure the concentration of metabolites found in the tissue even at very small concentrations, in the order of μM or even less in LipCEST [6].
Data acquisition
There are several known schemes for the construction of the CEST sequence. Their type depends on the pattern of saturation impulses used. The most popular ones are those with rectangular, continuous wave saturation pulses. A magnetisation transfer prepared sequence starts with the saturation impulse followed by excitation, spatial encoding, and readout gradient involvement (Figure 2). During saturation labelled protons are continuously transferred to the bulk water pool leading to a build-up of water signal loss.
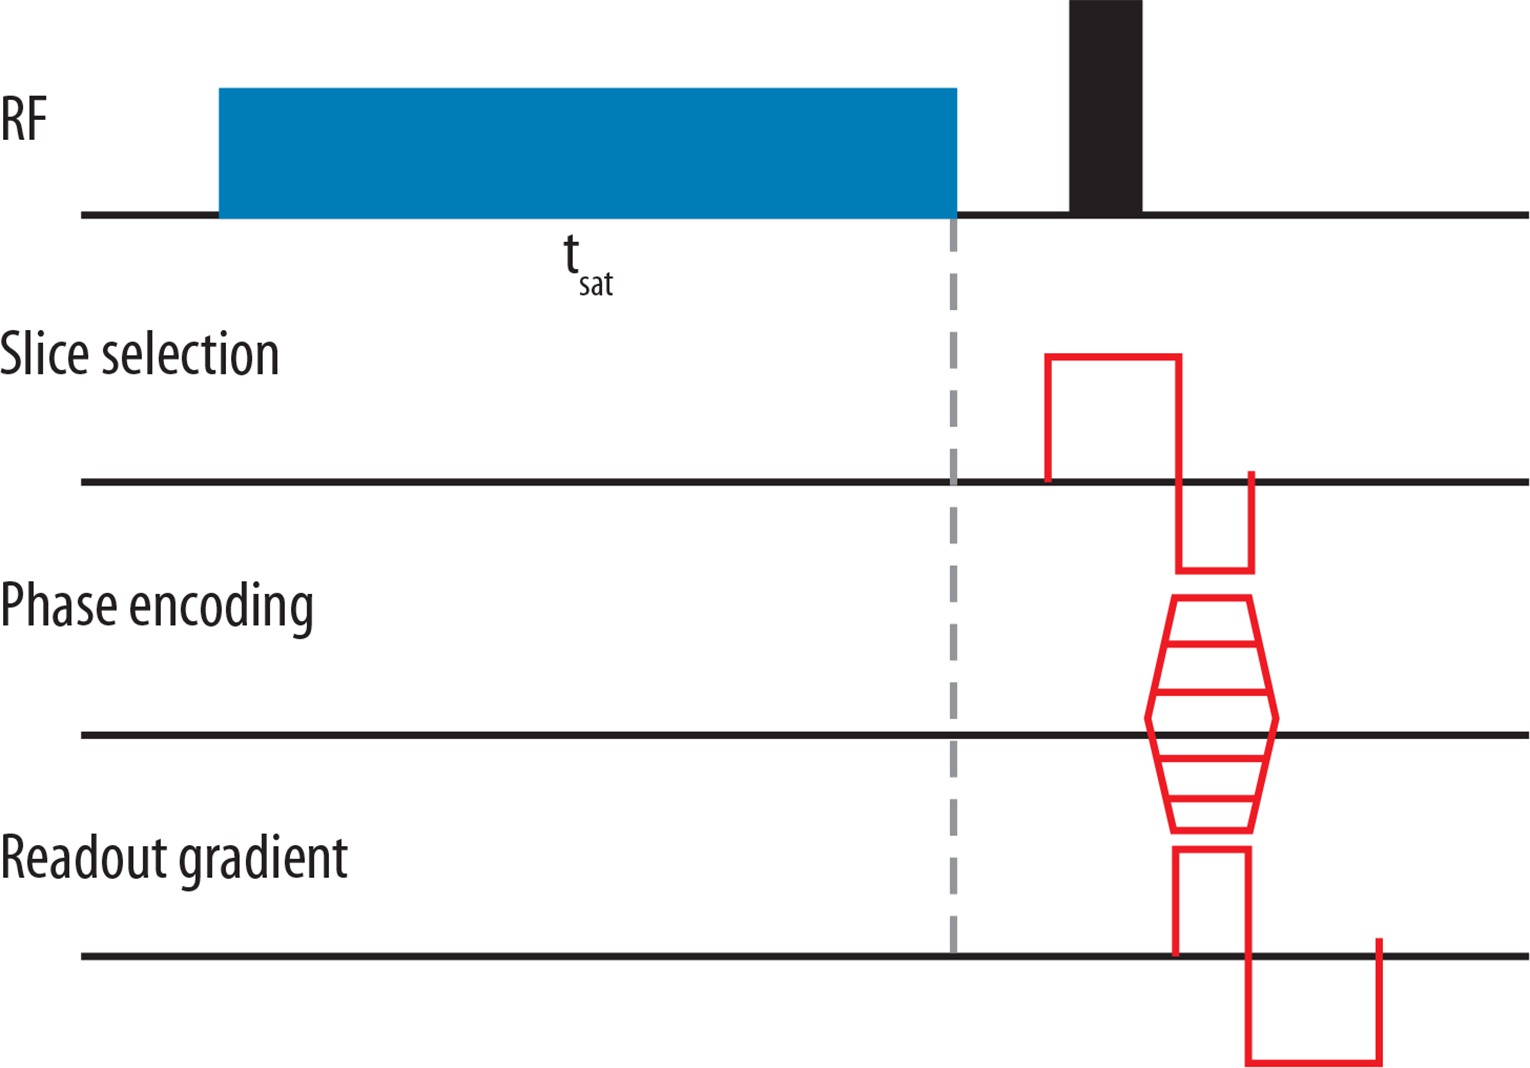
Pulses are tuned to the range of the frequency offsets from +Δω to –Δω from the water with the amplitude of B1 and duration time tsat (which should be much longer than T1). Over one acquisition only one frequency offset is required, so the scheme is repeated until the entire frequency spectrum is achieved [7,8].
Data interpretation
The interpretation of the CEST spectrum, called also the Z-spectrum or Z-spectroscopy [9], is complicated and presents many problems related not only to the need of understanding the physics of the phenomenon but also with the preservation of appropriately selected parameters of sequence acquisition. The main factors that may affect data interpretation are: field strength, B1 inhomogeneity [10-14], radio frequency (RF) pulse power optimisation [15], pH and temperature drift, the presence of magnetisation transfer effect [16], water direct saturation effect, and relaxation times [17,18]. For this reason, the acquisition is not limited to only one sequence during which data is collected to obtain the Z-spectrum. Typically, the protocol contains additional sequences such as magnetisation transfer (MT), water saturation shift referencing (WASSR), and one for T1 relaxation time measurement [19].
Most of the compounds analysed in the CEST experiment are located on the left side of the graph marked as positive frequencies in relation to water, while the right side mainly originates from the nuclear Overhauser effect (NOE) aliphatic compounds and lipids [20]. In contrast to the MRS spectrum in CEST plot 0 ppm frequency indicates the maximum water saturation point.
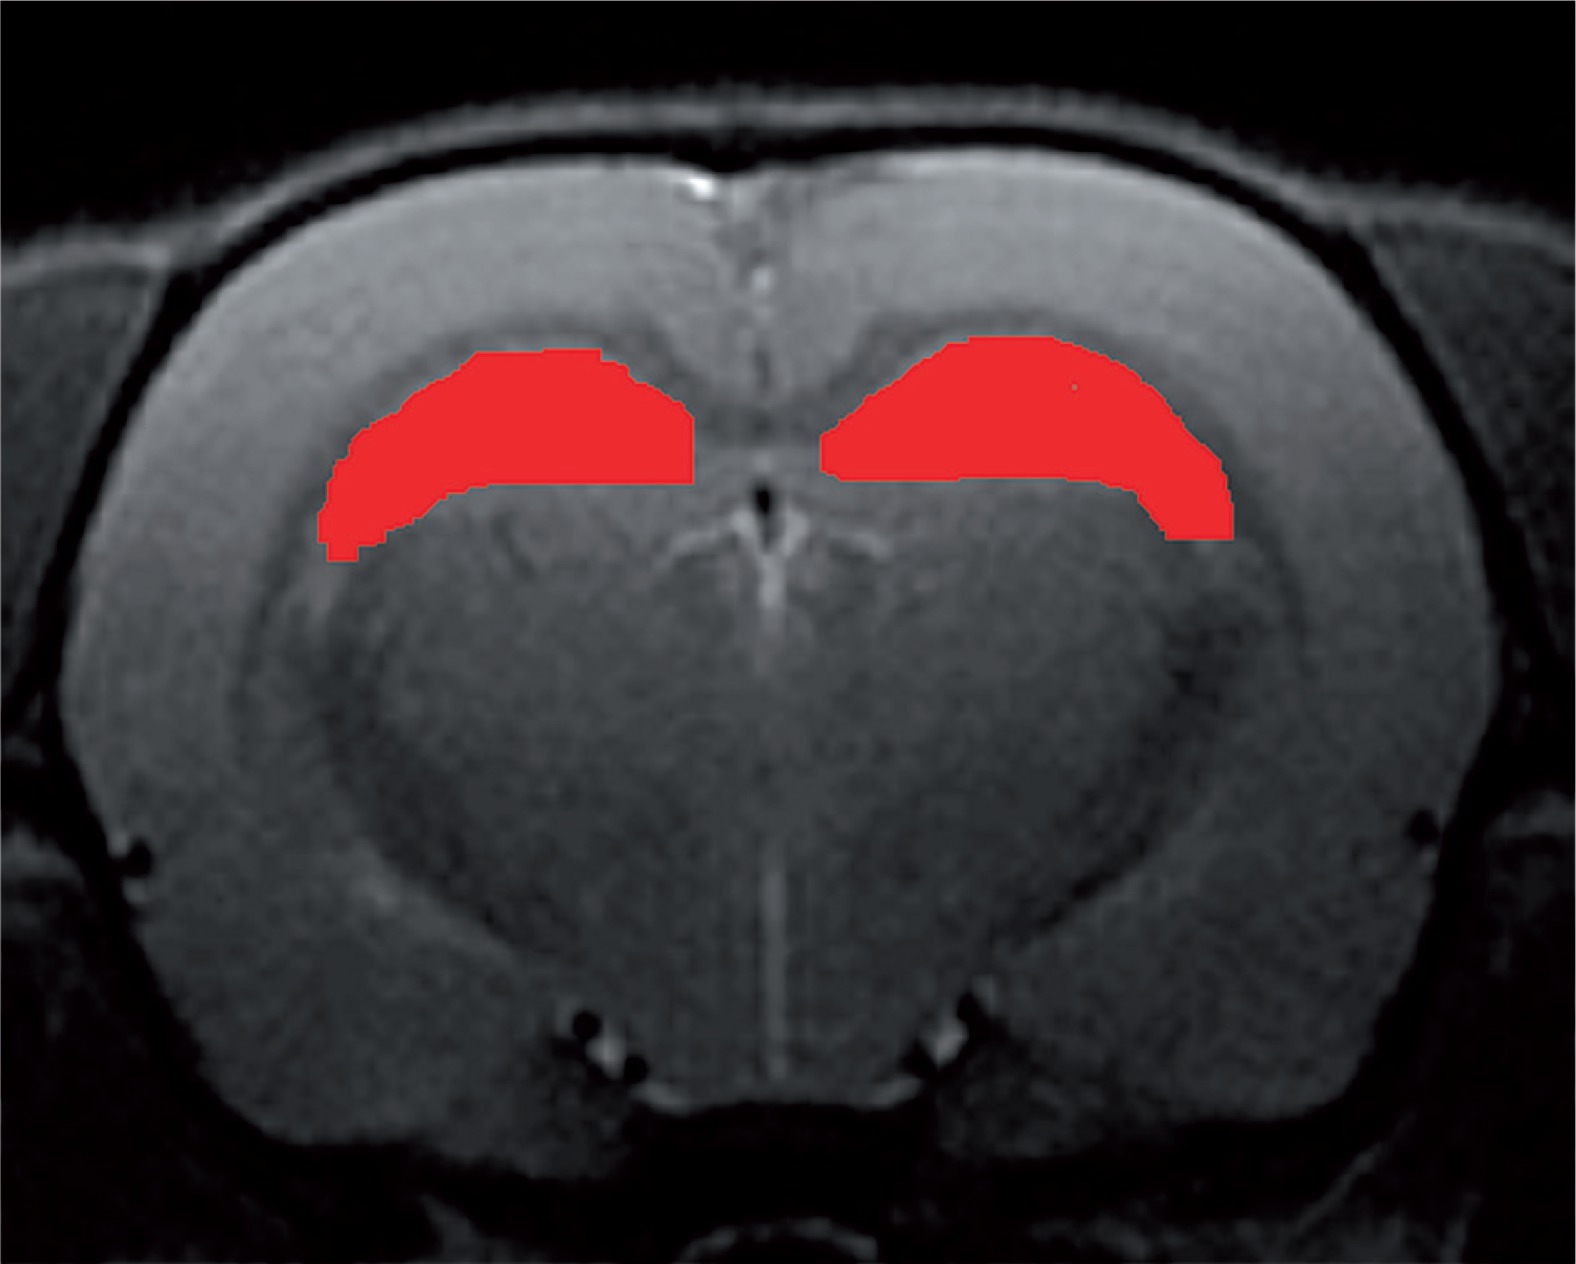
Figure 3 presents an example Z-spectrum obtained from in vivo study of rat brain (region of interest marked in Figure 4) after manual segmentation of hippocampus. Data were processed with B0 shift adjustment, B1 scale, and baseline correction.
Figure 3
In vivo Z-spectrum of rat hippocampus – compounds in the range of +6 ppm to –6 ppm from the water resonant frequency. Source: Spectrum obtained from CEST sequence, 7 T Bruker PharmaScan, animal system, Centre of Experimental Medicine, Medical University of Lublin
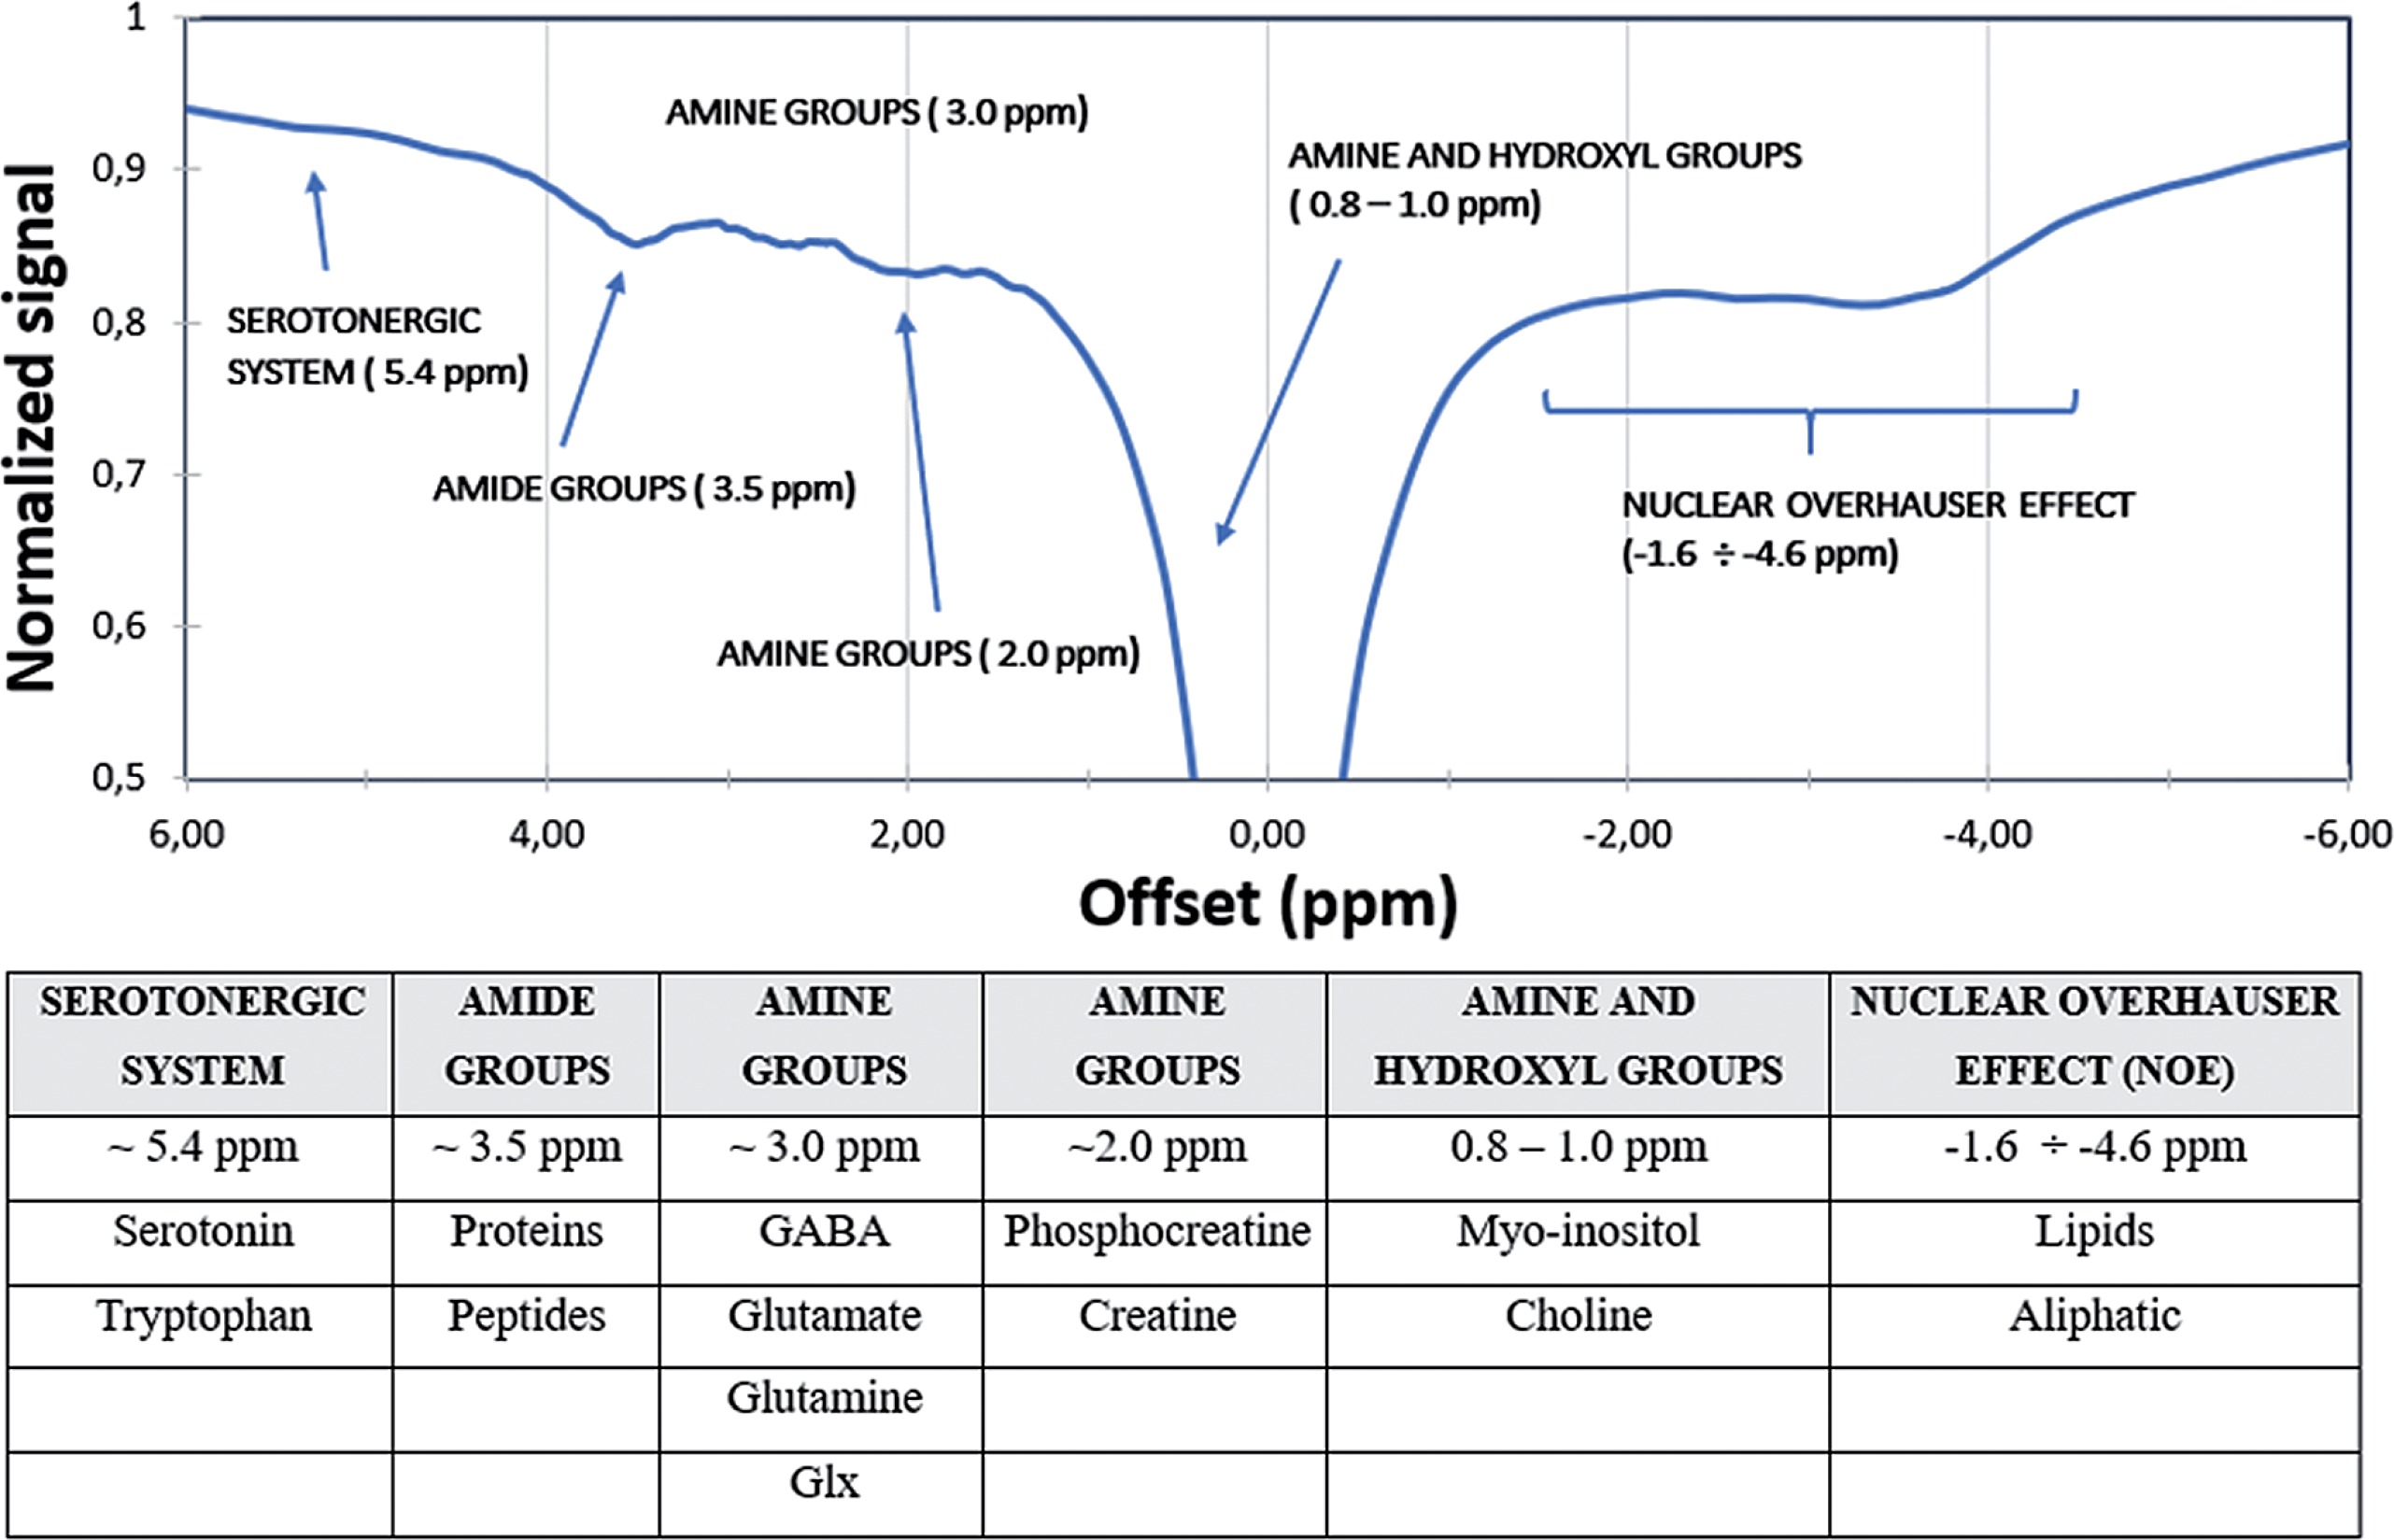
Figure 4
The region of interest of in vivo Z-spectrum analysis – manually segmented rat hippocampus. Source: T2-weighted RARE image from 7 T Bruker PharmaScan, animal system, Centre of Experimental Medicine, Medical University of Lublin
During the CEST analysis, one of the most important parameters, which is often calculated, is the magnetic transfer ratio asymmetry (MTRasym), sometimes called CEST asymmetry (CESTasym). It is expressed by the following formula:
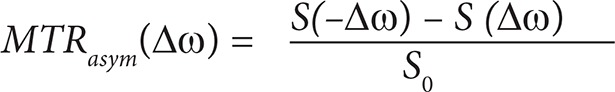
where (Dw) is analysed frequency offset, S(–Dw) and S(–Dw) refer to signal intensity at the positive and the negative side of the Z-spectrum, and S0 is the signal intensity without saturation. MTRasym measurement analysis provides information about the CEST contrast scale. One particular CEST peak, which is located at 3.5 ppm, refers to compounds which contain i.a. amide groups. This offset is related to amide proton transfer (APT), so asymmetry of this peak is also termed amide proton transfer asymmetry (APTasym) [21,22].
Different types of CEST
The CEST technique is often presented as an alternative way of obtaining the signal from molecules that have not been visible in known MR molecular imaging methods. Several major types of this method are described in the literature, and each of them enables imaging of very different types of compounds. The most popular types of CEST are described below.
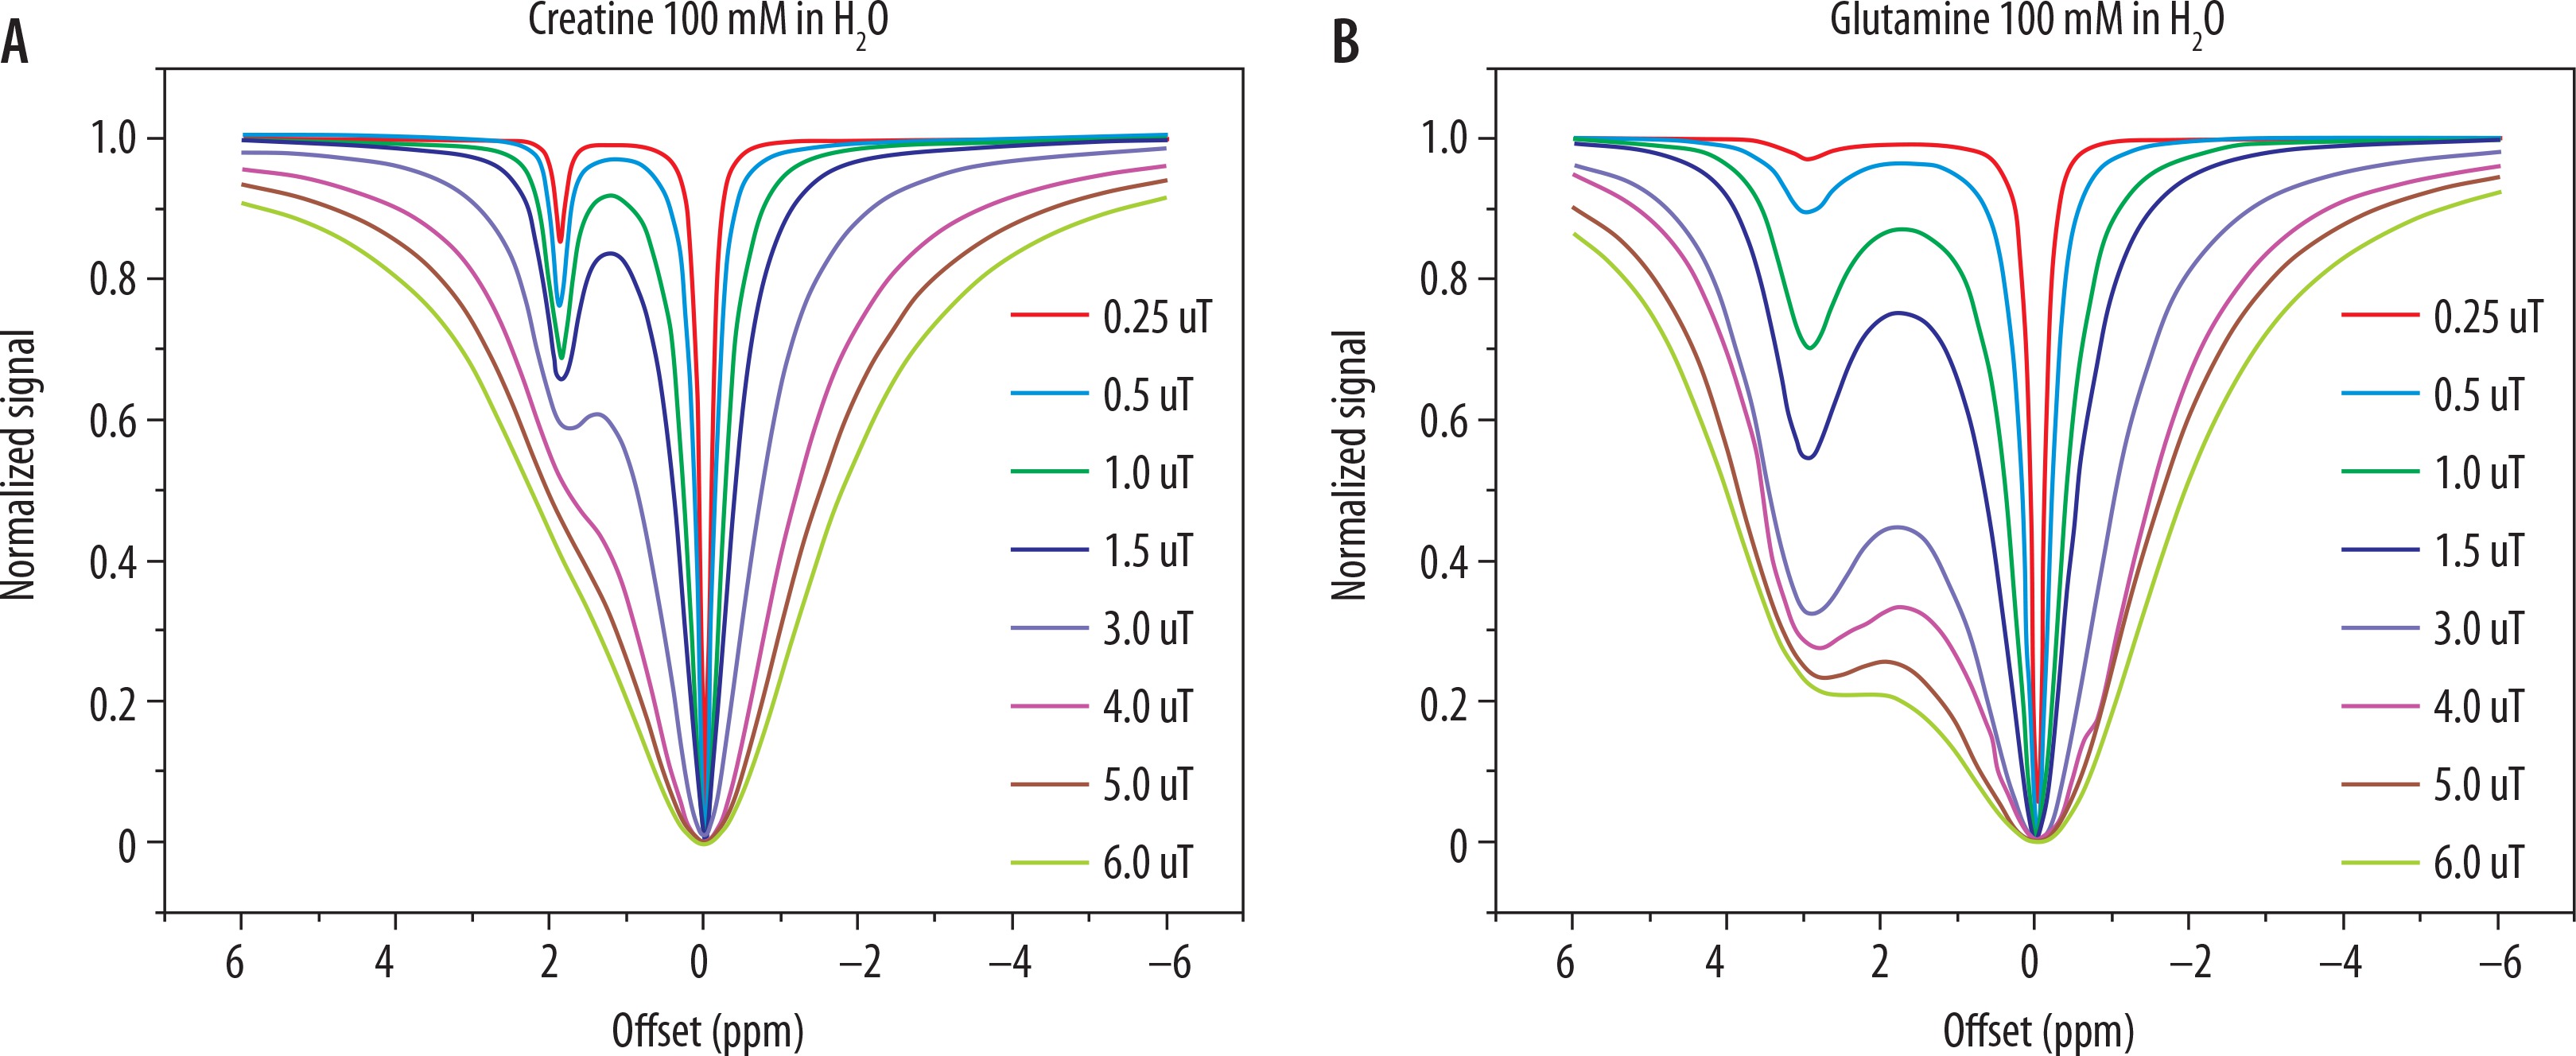
DiaCEST requires the use of long saturation pulses of relatively small B1 power amplitudes. It allows the signal from molecules to be obtained, whichare in the frequency range of 0 ppm to +7 ppm from the water [9,23]. Most of them are compounds that may be found in the tissues. Some of them are important markers of pathological or physiological processes. These molecules contain mostly amide, amine, hydroxyl, and imino groups. The interpretation of the Z-spectrum originating from living tissues may be difficult due to a possible, hard to distinguish overlap of CEST effects of separate metabolites. Therefore, a lot of research is being done with the use of phantoms for a better understanding of the nature of this phenomenon [24-27]. Exemplary spectra of single metabolites are shown in Figure 5.
Figure 5
Z-spectrum of two phantoms containing separate metabolites and their dependency on saturation pulse power: A) 100 mM of creatine dissolved in water; B) 100 mM of glutamine dissolved in water. Source: Data obtained from the phantom study, 7 T Bruker PharmaScan, animal system, Centre of Experimental Medicine, Medical University of Lublin
ParaCEST is another type of CEST, which refers to a group of exogenous compounds with weak magnetic properties that are characterised by high exchange rates and large chemical shifts in relation to water. Many of them have been proposed as an alternative to traditional gadolinium-based contrast agents, e.g. Mn2+, Eu3+, or Ln3+ complexes. They can also include hydroxyl, amide, or amine groups, and may be connected with molecules of bound water. ParaCEST can be used to detect the metabolites or the presence of nucleic acids and some ions [28,29].
In LipoCEST the spherical liposome is filled with a compound of high concentration (paramagnetic shift reagent), which changes by quick exchange the resonant frequency of water trapped in the liposome. Water in a confined space is shifted by about 4 ppm downfield to bulk water. The exchange of water inside the liposome with external water takes place slowly, which gives good conditions for Z-spectrum detection. Such a spectrum contains two peaks of water at a short distance from each other. Compounds that are paramagnetic shift reagents must have at least one water molecule that is able to exchange fast [30-32].
HyperCEST – this type of CEST does not rely on the proton exchange, as do the types presented so far, but on the exchange between whole molecules. Hyperpolarised atoms of xenon (129Xe) are visible in the spectrum in two different states: as free molecules and as molecules caged in host compound, like cryptophane [33,34]. They have different resonant frequencies, distant from each other by approximately 100 ppm, which results in good peak separation. During saturation of free atoms on their frequency offset magnetisation transfer is moved to the atoms associated with the host, which results in its signal loss, which is dependent on the amount of compound in the tissue. It is also worth mentioning that HyperCEST is very sensitive even for small temperature changes [35].
Possible CEST applications
There are several studies that have described application of the CEST method in imaging of pathologies of the nervous system, focused mainly on multiple sclerosis in the brain and spinal cord [14,36-38] and an animal model of Alzheimer’s disease [39]. This study presented a difference in the concentration of amide protons by ATPasym analysis in healthy tissues compared to those altered by disease. Also, gluCEST, which is based on a signal from glutamate and shows a CEST peak at 3.0 pmm, has been used in the diagnosis of epilepsy and neuroinflammation [40,41].
Another field of application for CEST method is oncology. Studies conducted in field 3 T show the possibility of distinguishing tumour progression from radiation necrosis in a study of patients with metastases after stereotactic surgery. Analysis of asymmetry in amide (MTR3.5ppm_necrosis = 8.2 ±1.0% and MTR3.5ppm_progression = 12.0 ± 1.9%, p = 0.0002) and NOE (NOE3.5ppm_necrosis = 8.8 ± 0.9% and NOE3.5ppm_progression = 12.7 ±1.16%, p = 0.0001) peaks delivered statistically significantly different results in different groups [42]. In a contrary examination in 9.4 T did not produce results that differ significantly in ATPasym in tumour and in normal tissue; only the NOE effect was decreased suggestively in tumours [43].
D-glucose is widely used in positron emission tomography (PET). However, its visualisation requires the use of a radiotracer not indifferent to health. CEST gives the opportunity to observe the glucose metabolism without additional exposure to radiation. MRI of glucoCEST showed strong uptake of glucose in tumours of head and neck and also a visible correlation of these results with PET studies [44,45].
The creatine CEST effect is detectable at around 2.0 ppm [46], which proved important in the imaging of muscle physiology. To show the importance of filed strength in CEST effect visualisation the same study was performed in 3 and 7 T magnetisation in a range of saturation power of 1.75-2.9 μT. During that examination the patient was obliged to perform a simple physical exercise (pressing on a pedal). The acquisition was done before and after the exercise. The results revealed an increased creatine signal in medial and lateral gastrocnemius muscles after physical effort [47,48].
New directions of using the CEST effect are constantly appearing. One of them was obtainment of Z-spectrum from human blood in 7 T from in vivo and in vitro samples. The authors suggest that the results of their research should be taken into consideration in the case of understanding pathologies in which changes in vascular volume occur [49].
Conclusions
CEST is a promising molecular imaging tool, which provides new opportunities for researchers and clinicians. It allows the imaging of signals from chemical compounds that cannot be captured in known classical imaging methods, even in a millimolar scale. Despite many technical difficulties in obtaining correct data, the method finds many applications in various fields of medicine. CEST method investigators are still developing this method to overcome known limitations and to provide some standards for clinical use.
The CEST method is mainly used in imaging metabolic markers of neurological disorders, but it is also applicable in oncology and in a demonstration of pathology and physiology of the musculoskeletal system.
In conclusion, CEST has great potential to be extensively explored. Thus, in the coming years, there is a high probability of an increase of interest and extension of possible applications of this method.