


Introduction
In December 2019, numerous cases of pneumonia of unknown cause were reported in Wuhan, Hubei Province, China. On January 7, 2020, a novel coronavirus, severe acute respiratory syndrome coronavirus-2 (SARS-CoV-2), was identified as the causative organism by Chinese experts by performing real-time polymerase chain reaction (real-time PCR) on patients’ respiratory tract specimens. It was subsequently named 2019-nCoV by the World Health Organization (WHO) [1]. There is also evidence that it can be transmitted through respiratory droplets and contact with infected patients as well as fecal–oral transmission [2,3]. Etiologically speaking, virulence of a pathogen may increase sharply during host shifts [4,5], and in contrast, the virulence may decrease through prolonged host-parasite interactions [6].
Coronavirus disease 2019 (COVID-19) is primarily transmitted through respiratory droplets and close contact, and the incubation period is usually between 1 and 14 days. The common symptoms include fever, dry cough, fatigue, and the gradual onset of shortness of breath. People who carry the virus are the source of infection, even during the incubation period. Early detection of the disease or the virus carrier is the key to prevent further spread. However, confirmation of the infection requires a nucleic acid detection kit. The virus can be identified in swabs, secretions, and sputum from the respiratory tract, blood, or feces [7].
Computed tomography (CT) scan is highly important in the diagnosis and follow-up of lung disease treatment. In a review of different studies, one may find that the imaging features of COVID-19 pneumonia are varied, from their natural appearance to diffuse changes in the lungs. In addition, different radiological patterns are observed at different times over the course of the disease. Since the onset of symptoms and acute respiratory distress syndrome (ARDS) was short-lived in the first cases of COVID-19 pneumonia, early detection of the disease is essential for the management of these patients [8].
Numerous studies have been performed regarding the findings of CT scans in COVID-19 patients and the results are inconsistent [3,8-46]. According to previous studies, lesions in patients with COVID-19 show ground-glass opacity (GGO) or mixed (GGO pulse consolidation or reticular) patterns, and are likely to have peripheral distribution, bilateral involvement, lower lobe dominance, and multi-lobe distribution [8-15]. In a systematic review and meta-analysis, a structured review of all documentation and their composition can provide a more comprehensive picture of all dimensions of the subject. One of the main goals of meta-analysis, which is a combination of different studies, is to reduce the differences between parameters by increasing the number of studies involved in the analysis process. Another noteworthy goal of meta-analysis is to find inconsistencies between the results and their causes [47-49]. The present meta-analysis was conducted to evaluate CT scan findings of COVID-19 at the time of admission.
Material and methods
Study protocol
The International Prospective Register of Systematic Reviews (PROSPERO) database and international databases were first reviewed to find relevant published or ongoing projects. All research steps were taken according to the Meta-Analysis of Observational Studies in Epidemiology (MOOSE) protocol [49] and the final report was based on the Preferred Reporting Items for Systematic Reviews and Meta-Analyses (PRISMA) guideline (Suppl Table 1) [50]. Each stage of the study was conducted by two independent authors. Disagreements were resolved by discussion or a third author was involved. We registered this review at PROSPERO (registration number: CRD42020178078) (Suppl Figure 1). Available at: https://www.crd.york.ac.uk/prospero/display_record.php?RecordID=178078.
Literature search
We searched the Web of Science: ISI, Medline-Ovid, Science Direct, Scopus, EMBASE, PubMed/Medline, Cochrane Library (Cochrane Database of Systematic Reviews – CDSR), EBSCO, CINAHL and Google Scholar databases using the following keywords: “2019 nCoV”, “Novel coronavirus”,“COVID-19”, “Novel coronavirus 2019”, “Wuhan pneumonia”, “Wuhan coronavirus”, “acute respiratory infection”, “COVID-19”, and “SARS-CoV-2”, “CT scan”, “Computed tomography”, “Radiology”, “Radiography”, “Clinical Characteristics”, “clinical features”, and “COVID-19”. An example of a combined search within PubMed is as follows: (“2019 nCoV”, OR “Novel coronavirus”, OR “COVID-19”, OR “Novel coronavirus 2019”, OR “Wuhan pneumonia”, OR “Wuhan coronavirus”, OR “acute respiratory infection”, OR “COVID-19”, OR “SARS-CoV-2”) AND (“CT scan” OR “Computed tomography” OR “Radiology” OR “Radiography” OR “Clinical characteristics” OR “clinical features” OR “COVID-19”).
The search was conducted on March 20, 2020. Additional studies were identified by reviewing the reference lists of relevant articles. No language restrictions were applied. Since the present study was based on a regular review of previous studies, approval of the organizational review board and patient satisfaction were not necessary. The research received no specific funding. Grey literature was found at medrxiv (https://www.medrxiv.org/) and manual search of related articles was also conducted.
Inclusion and exclusion criteria
Inclusion criteria were all cross-sectional epidemiological studies aimed at examining chest CT scan findings in COVID-19 patients from January 1, 2020 until March 20, 2020 without language restrictions. Exclusion criteria were as follows: 1. Non-random sampling; 2. Duplicate studies; 3. Studies on non-adult population (more than 10% of sample size being children); 4. Being irrelevant; 5. Sample size smaller than 10 participants; 6. Diagnostic intervention for COVID-19 other than laboratory confirmation; 7. CT scan findings have not been verified by at least one radiology expert; 8. Poor quality in qualitative evaluation; and 9. Case reports, review articles, and letters to the editor without quantitative data.
Study selection and data extraction
Two authors independently presented the results of the initial search with the title and abstract. At this stage, duplicate and unrelated studies were excluded. Duplicate studies were identified manually or using EndNote X9. Both authors then reviewed the full text of appropriate articles for the inclusion and exclusion criteria. Finally, the authors extracted the data independently from the articles. Any discrepancy between the data extractors was resolved by consensus or by a third author. It should be noted that when an article reported duplicate information from the same patients, both reports were combined to obtain the most complete data, but it was considered as one case.
The data summary form includes the following items: first author’s name and year of publication, country and province, article references, study design, mean age and standard deviation, average duration from onset of symptoms until admission, time of performing CT scan, COVID-19 detection method, patient description, sample (respiratory secretions, blood, etc.), sample location (nasal, pharyngeal, etc.), number of patients (total, male and female), number of patients referred to the intensive care unit (ICU), quality of articles, outcomes information: positive chest CT scan in COVID-19 patients, including the sensitivity of chest CT, bilateral pneumonia, predominant chest CT scan patterns [GGO, mixed (GGO pulse consolidation or reticular), consolidation, reticular, and presence of nodule], other chest CT scan features (thickened interlobular septa, vascular enlargement, air bronchogram sign, bronchial wall thickening, bronchiolectasis, fibrous stripes, crazy-paving pattern, thickening of the adjacent pleura, pleural effusion and lymphadenopathy), distribution of lesions (peripheral, central, and peripheral pulse central), lobes involvement (right upper lobe, right middle lobe, right lower lobe, left upper lobe, and left lower lobe) and number of involved lobes (one lobe, two lobes, three lobes, four lobes, and five lobes).
Qualitative evaluation
Based on the type of studies, the adapted Newcastle-Ottawa Scale (NOS) was used to evaluate the risk of bias [51]. Three categories were defined: studies with scores less than 6 were low-quality studies, studies with scores of 6 or 7 were medium-quality, and studies with scores of 8 or 9 were high-quality studies.
Statistical analysis
The I2 index (with values ranging from 0 to 100%) was used to evaluate the heterogeneity between studies; values above 75% indicate high heterogeneity, values within 50-74% indicate significant heterogeneity, values within 25-49% indicate moderate heterogeneity, and values below 25% indicate low heterogeneity [52,53]. In addition, p < 0.1 was also defined for heterogeneity. Meta-analysis was performed with at least three studies. In the case of low heterogeneity the fixed effects model, and otherwise the random effects model, was used to combine the studies. Results were reported as pooled prevalence and 95% confidence interval. To identify the cause of heterogeneity, we could not perform subgroup analysis or meta-regression due to limitations. Sensitivity analysis for meta-analyses with at least five studies was performed by omitting one study at a time to evaluate the consistency of the results. Funnel plots and the Begg and Egger tests were used to evaluate publication bias. All analyses were performed using comprehensive meta-analysis. P-values less than 0.05 were considered statistically significant.
Results
Description of included studies
We identified 2266 potential articles from databases. After removing duplicates, there were 766 articles left. After evaluating the titles and abstracts, 76 articles were removed for at least one of the following reasons: non-random sampling (n = 10), studies on non-adult population (n = 3), being irrelevant (n = 650), diagnostic intervention for COVID-19 other than laboratory confirmation (n = 3), CT scans findings not verified by at least one radiology expert (n = 2), poor quality in qualitative evaluation (n = 0), and case reports, review articles, and letters to the editor without quantitative data (n = 58). Finally, 40 eligible studies with 4598 patients with COVID-19 were used for meta-analysis. This process is illustrated in Figure 1. All studies were conducted in China and all of them were of good or moderate quality and the details of studies are summarized in Table 1. The mean age of the study participants was 50.52 years (95% CI: 50.87-52.17).
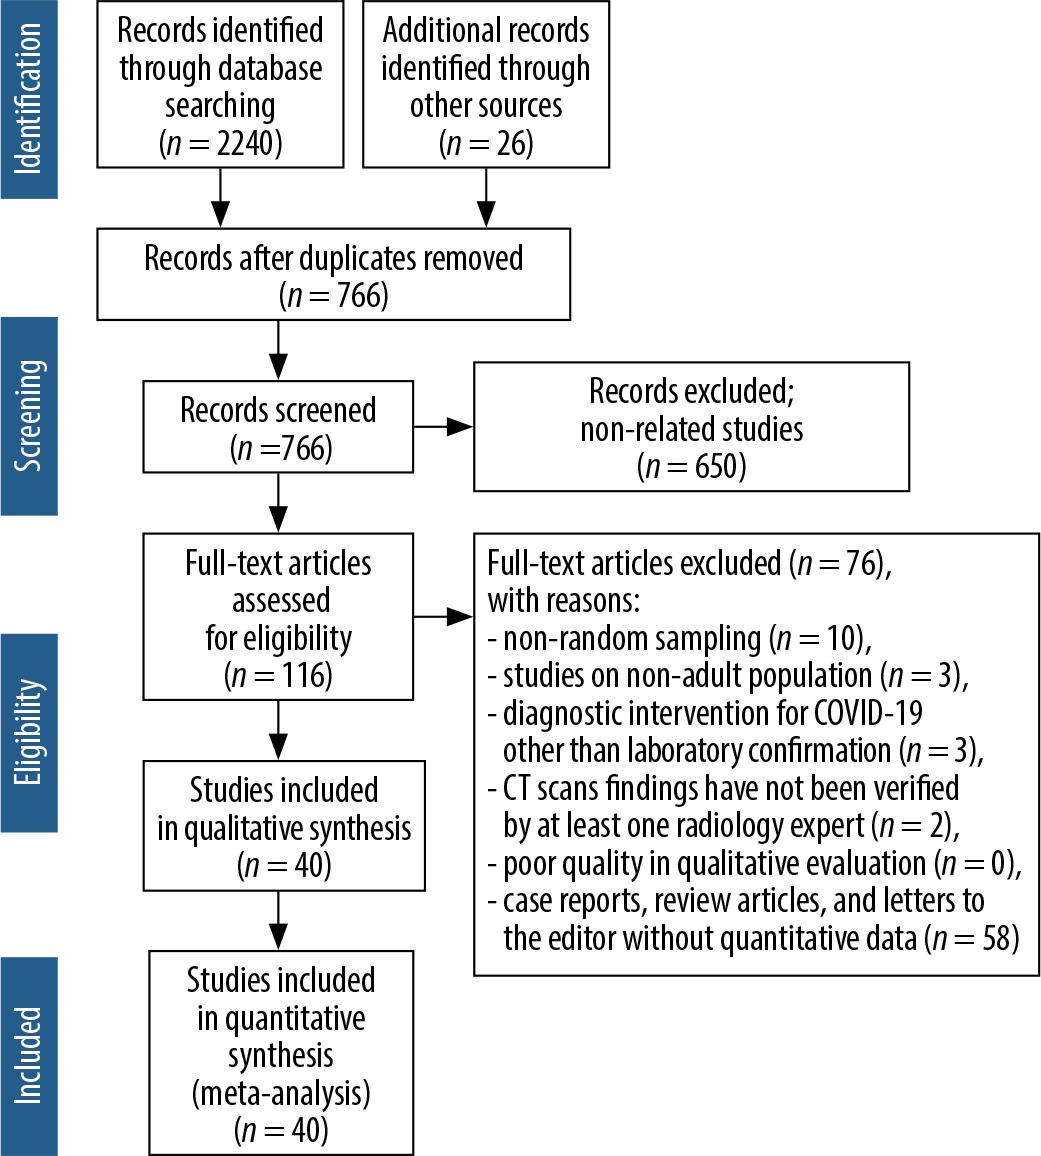
Table 1
Characteristics of articles entered into meta-analysis
| Ref. | First author, published Year | Source | Time assessment | Country/ Province | Population | Age (year) | The onset of symptoms to admission (day) | ICU/Isolate admission | Sample | COVID-19 confirmation | Sample size | Quality | ||||
|---|---|---|---|---|---|---|---|---|---|---|---|---|---|---|---|---|
| Mean | SD | Median | Range | All | Male /Female | CT(+) | ||||||||||
| [9] | Chen G, 2020 | medRxiv | On admission | China, Wuhan | Patients with 2019-nCoV pneumonia (severe and moderate) | 56.3 | 14.30 | Respiratory specimens | Next-generation sequencing or real-time RT-PCR | 21 | 17/4 | 21 | 7 | |||
| [8] | Huang C, 2020 | Lancet | On admission | China, Wuhan | Patients with 2019-nCoV pneumonia | 49.0 | 41-58 | 7.0 | 4-8 | 13/8 | Respiratory specimens or plasma | RT-PCR confirmed | 41 | 30/11 | 41 | 9 |
| [3] | Chen N, 2020 | Lancet | On admission | China, Wuhan | Patients with 2019-nCoV pneumonia | 55.5 | 13.1 | Throatswab specimens | RT-PCR confirmed | 99 | 67/32 | 99 | 9 | |||
| [10] | Yang W, 2020 | Journal of Infection | On admission | China, Zhejiang | Patients with 2019-nCoV pneumonia | 45.11 | 13.35 | 6.8 | 5 | 0/149 | Nasal and pharyngeal swab specimens | RT-PCR confirmed | 149 | 81/68 | 132 | 7 |
| [11] | Xu YH, 2020 | Journal of Infection | Not mentioned | China, Beijing | Patients with 2019-nCoV pneumonia | 43.9 | 16.8 | Not mentioned | Nucleic acid testing | 50 | 29/21 | 41 | 6 | |||
| [12] | Sh H, 2020 | The Lancet Infectious Diseases | On admission | China, Wuhan | Patients with confirmed COVID19 pneumonia | 49.5 | 11.0 | Throats wab | Next-generation sequencing or RT-PCR | 81 | 42/39 | 81 | 8 | |||
| [13] | Wang D, 2020 | JAMA | On admission | China, Wuhan | Patients with confirmed COVID19 pneumonia | 7.0 | 4-8 | 36/102 | Throats wab specimens | RT-PCR confirmed | 138 | 75/63 | 138 | 9 | ||
| [14] | Pan Y, 2020 | European Radiology | On admission | China, Wuhan | Patients with confirmed COVID19 pneumonia | 44.9 | 15.2 | Nasopharyngeal | RT-PCR confirmed | 63 | 33/30 | 63 | 8 | |||
| [15] | Xu X, 2020 | BMJ: British Medical Journal | On admission | China, Zhejiang | Patients with confirmed COVID19 pneumonia | 41.0 | 32-52 | 2.0 | 1-4 | Sputum and throat swab specimens | RT-PCR confirmed | 62 | 36/27 | 61 | 8 | |
| [16] | Li Y, 2020 | American Journal of Roentgenology | On admission | China, Wuhan | Patients with COVID-19 | 58.0 | 17 | Oropharyngeal swab | nucleic acid testing | 51 | 28/23 | 51 | 9 | |||
| [17] | Zhou S, 2020 | American Journal of Roentgenology | On admission | China, Wuhan | Patients with confirmed COVID19 pneumonia | 52.8 | 12.2 | Respiratory specimens | RT-PCR confirmed | 62 | 39/23 | 62 | 9 | |||
| [18] | Zhao W, 2020 | American Journal of Roentgenology | Not mentioned | China, Hunan | Patients with confirmed COVID19 pneumonia | 44.44 | 12.3 | Not mentioned | RT-PCR confirmed | 101 | 56/45 | 93 | 8 | |||
| [19] | Guan WJ, 2020 | MedRxiv | On admission | China, 31 provinces | patients with laboratory-confirmed 2019-nCoV ARD | 55/1044 | Nasal and pharyngeal swab specimens | RT-PCR confirmed | 1099 | 640/459 | 840 | 7 | ||||
| [20] | Ai JW, 2020 | medRxiv | On admission | China, Eastern cities | Patients with confirmed COVID19 pneumonia | Nasopharyngeal swab specimens | RT-PCR confirmed | 20 | 10/10 | 20 | 8 | |||||
| [21] | Feng Z, 2020 | medRxiv | On admission | China, outside Wuhan | Patients with confirmed COVID19 pneumonia | 44.0 | Nasal and pharyngeal swab specimens | RT-PCR confirmed | 141 | 72/69 | 7 | |||||
| [22] | Yuan M, 2020 | medRxiv | On admission | China, Wuhan | Patients with confirmed COVID19 pneumonia | 8.0 | 5-11 | Throat-swab specimens | RT-PCR confirmed | 27 | 12/15 | 27 | 8 | |||
| [23] | Qian GQ, 2020 | medRxiv | On admission | China, Zhejiang | Patients with COVID-19 | Throat-swab specimens | RT-PCR confirmed | 88 | 37/54 | 83 | 8 | |||||
| [24] | Cao W, 2020 | medRxiv | On admission | China, Hubei | Patients with COVID-19 | Nasal and pharyngeal swab specimens | RT-PCR confirmed | 128 | 60/68 | 8 | ||||||
| [25] | Liang Y, 2020 | medRxiv | Not mentioned | China, Beijing | Patients with confirmed COVID19 pneumonia | Throat-swab specimens | RT-PCR confirmed | 21 | 11/10 | 21 | 8 | |||||
| [26] | Huang Y, 2020 | medRxiv | On admission | China, Wuhan | Non-survivors patients with COVID-19 | 69.22 | 9.64 | Not mentioned | RT-PCR confirmed | 36 | 11/25 | 32 | 7 | |||
| [27] | Wu J, 2020 | Invest Radiol | On admission | China, Chongqing | Patients with COVID-19 | 44.0 | 11.00 | 7.0 | 4 | Throat swabs or lower respiratory tract | RT-PCR confirmed | 80 | 42/38 | 76 | 7 | |
| [28] | Kui L, 2020 | Chinese Medical Journal | Not mentioned | China, Hubei | Patients with COVID-19 | 55.0 | 16.00 | Sputum and nasopharyngeal swabs | Nucleic acid positive and RT-PCR confirmed | 137 | 61/76 | 7 | ||||
| [29] | Chung M, 2020 | Radiology | On admission | China, three provinces | Patients with COVID-19 | 51.0 | 14.00 | Bronchoalveolar lavage, endotracheal aspirate, nasopharyngeal swab, or oropharyn | RT-PCR confirmed | 21 | 13/8 | 18 | 7 | |||
| [30] | Song F, 2020 | Radiology | Not mentioned | China, Wuhan | Patients with COVID-19 | 49.0 | 16 | 4.0 | 1-14 | Not mentioned | RT-PCR confirmed | 51 | 25/26 | 50 | 8 | |
| [31] | Bernheim A, 2020 | Radiology | On admission | China, four provinces | Patients with COVID-19 | 45.0 | 15.60 | 1-15 | Bronchoalveolar lavage, endotracheal aspirate, nasopharyngeal swab, or oropharyn | RT-PCR confirmed | 121 | 61/60 | 94 | 8 | ||
| [32] | Xu Z, 2020 | Lancet | On admission | China, Guangdong | Patients with confirmed COVID19 pneumonia | 43.1 | 17.10 | Not mentioned | Not mentioned | 21 | 10/11 | 17 | 9 | |||
| [33] | Li K, 2020 | Investigative Radiology | On admission | China, Chongqing | Patients with confirmed COVID19 pneumonia | 45.5 | 12.3 | Throat swabs or lower respiratory tract/respiratory or blood samples | RT-PCR confirmed | 83 | 44/39 | 8 | ||||
| [34] | Zhang JJ, 2020 | Epidemiology and Genetics | On admission | China, Wuhan | Patients with COVID-19 | 8.0 | 6-11 | Pharyngeal swab specimens | RT-PCR confirmed | 135 | 68/67 | 134 | 8 | |||
| [35] | Wang Y, 2020 | Lancet | Not mentioned | China, Wuhan | Patients with COVID-19 | Not mentioned | Nucleic acid | 511 | 492 | 8 | ||||||
| [36] | Hu Z, 2020 | Science China Life Sciences | On admission | Nanjing, China | Asymptomatic carriers were laboratory-confirmed positive for the COVID-19 virus | 1/23 | Pharyngeal swab specimens | RT-PCR confirmed | 24 | 8/16 | 17 | 9 | ||||
| [37] | Haiyan Fu, 2020 | medRxiv | On admission | Kunming, China | Patients with COVID-19 | 2/34 | Respiratory specimens | RT-PCR confirmed | 36 | 16/20 | 22 | 8 | ||||
| [38] | Li J, 2020 | medRxiv | On admission | Patients with confirmed COVID19 pneumonia | 5.0 | 2.-7 | 58/240 | Throat swab | RT-PCR confirmed | 17 | 9/8 | 16 | 7 | |||
| [39] | Cai Q, 2020 | medRxiv | On admission | China, Hubei Province | Patients with confirmed COVID19 pneumonia | 47.0 | 33-61 | 32/266 | Nasal swab | RT-PCR confirmed | 298 | 149/149 | 298 | 8 | ||
| [40] | Jian-ya G, 2020 | medRxiv | On admission | China, Chongqing | Patients with COVID-19 | 6.0 | 3-8 | 7/44 | Not mentioned | RT-PCR confirmed | 51 | 32/19 | 51 | 7 | ||
| [41] | Cui P, 2020 | medRxiv | On admission | China, Wuhan | Patients with COVID-19 | 61.5 | 11.2 | Throat swab | RT-PCR confirmed | 35 | 0/35 | 35 | 8 | |||
| [42] | Cao M, 2020 | medRxiv | On admission | China, Shanghai | Patients with COVID-19 | 50.1 | 16.3 | 5.0 | 19/179 | Throat-swab specimens | RT-PCR confirmed | 198 | 101/97 | 195 | 6 | |
| [43] | Xu Y, 2020 | medRxiv | On admission | China, Chinese Han | Patients with confirmed COVID19 pneumonia | 25/44 | Pharyngeal swab specimens | RT-PCR confirmed | 69 | 35/34 | 69 | 7 | ||||
| [44] | Chen J, 2020 | medRxiv | On admission | China, Wuhan | Death cases with COVID-19 | 65.46 | 9.74 | 11.0 | 8-13.5 | 47/54 | Not mentioned | RT-PCR confirmed | 101 | 64/37 | 99 | 7 |
| [45] | Liu J, 2020 | medRxiv | On admission | China, Wuhan | Medical staff infected with COVID-19 | 8.5 | 4.3-15.0 | Throat-swab specimens | RT-PCR confirmed | 64 | 28/36 | 58 | 8 | |||
| [46] | Lei Y, 2020 | medRxiv | On admission | China, Chengdu | Tibetan patients with COVID-19 | 39.3 | 18.3 | 7/60 | Nasal and pharyngeal swabs or blood | RT-PCR confirmed | 67 | 39/28 | 47 | 8 | ||
Risk of bias
The risk of bias based on the NOS tool is shown in Table 1. Fourteen and 26 studies had moderate and good quality, respectively.
Sensitivity of chest CT findings for COVID-19
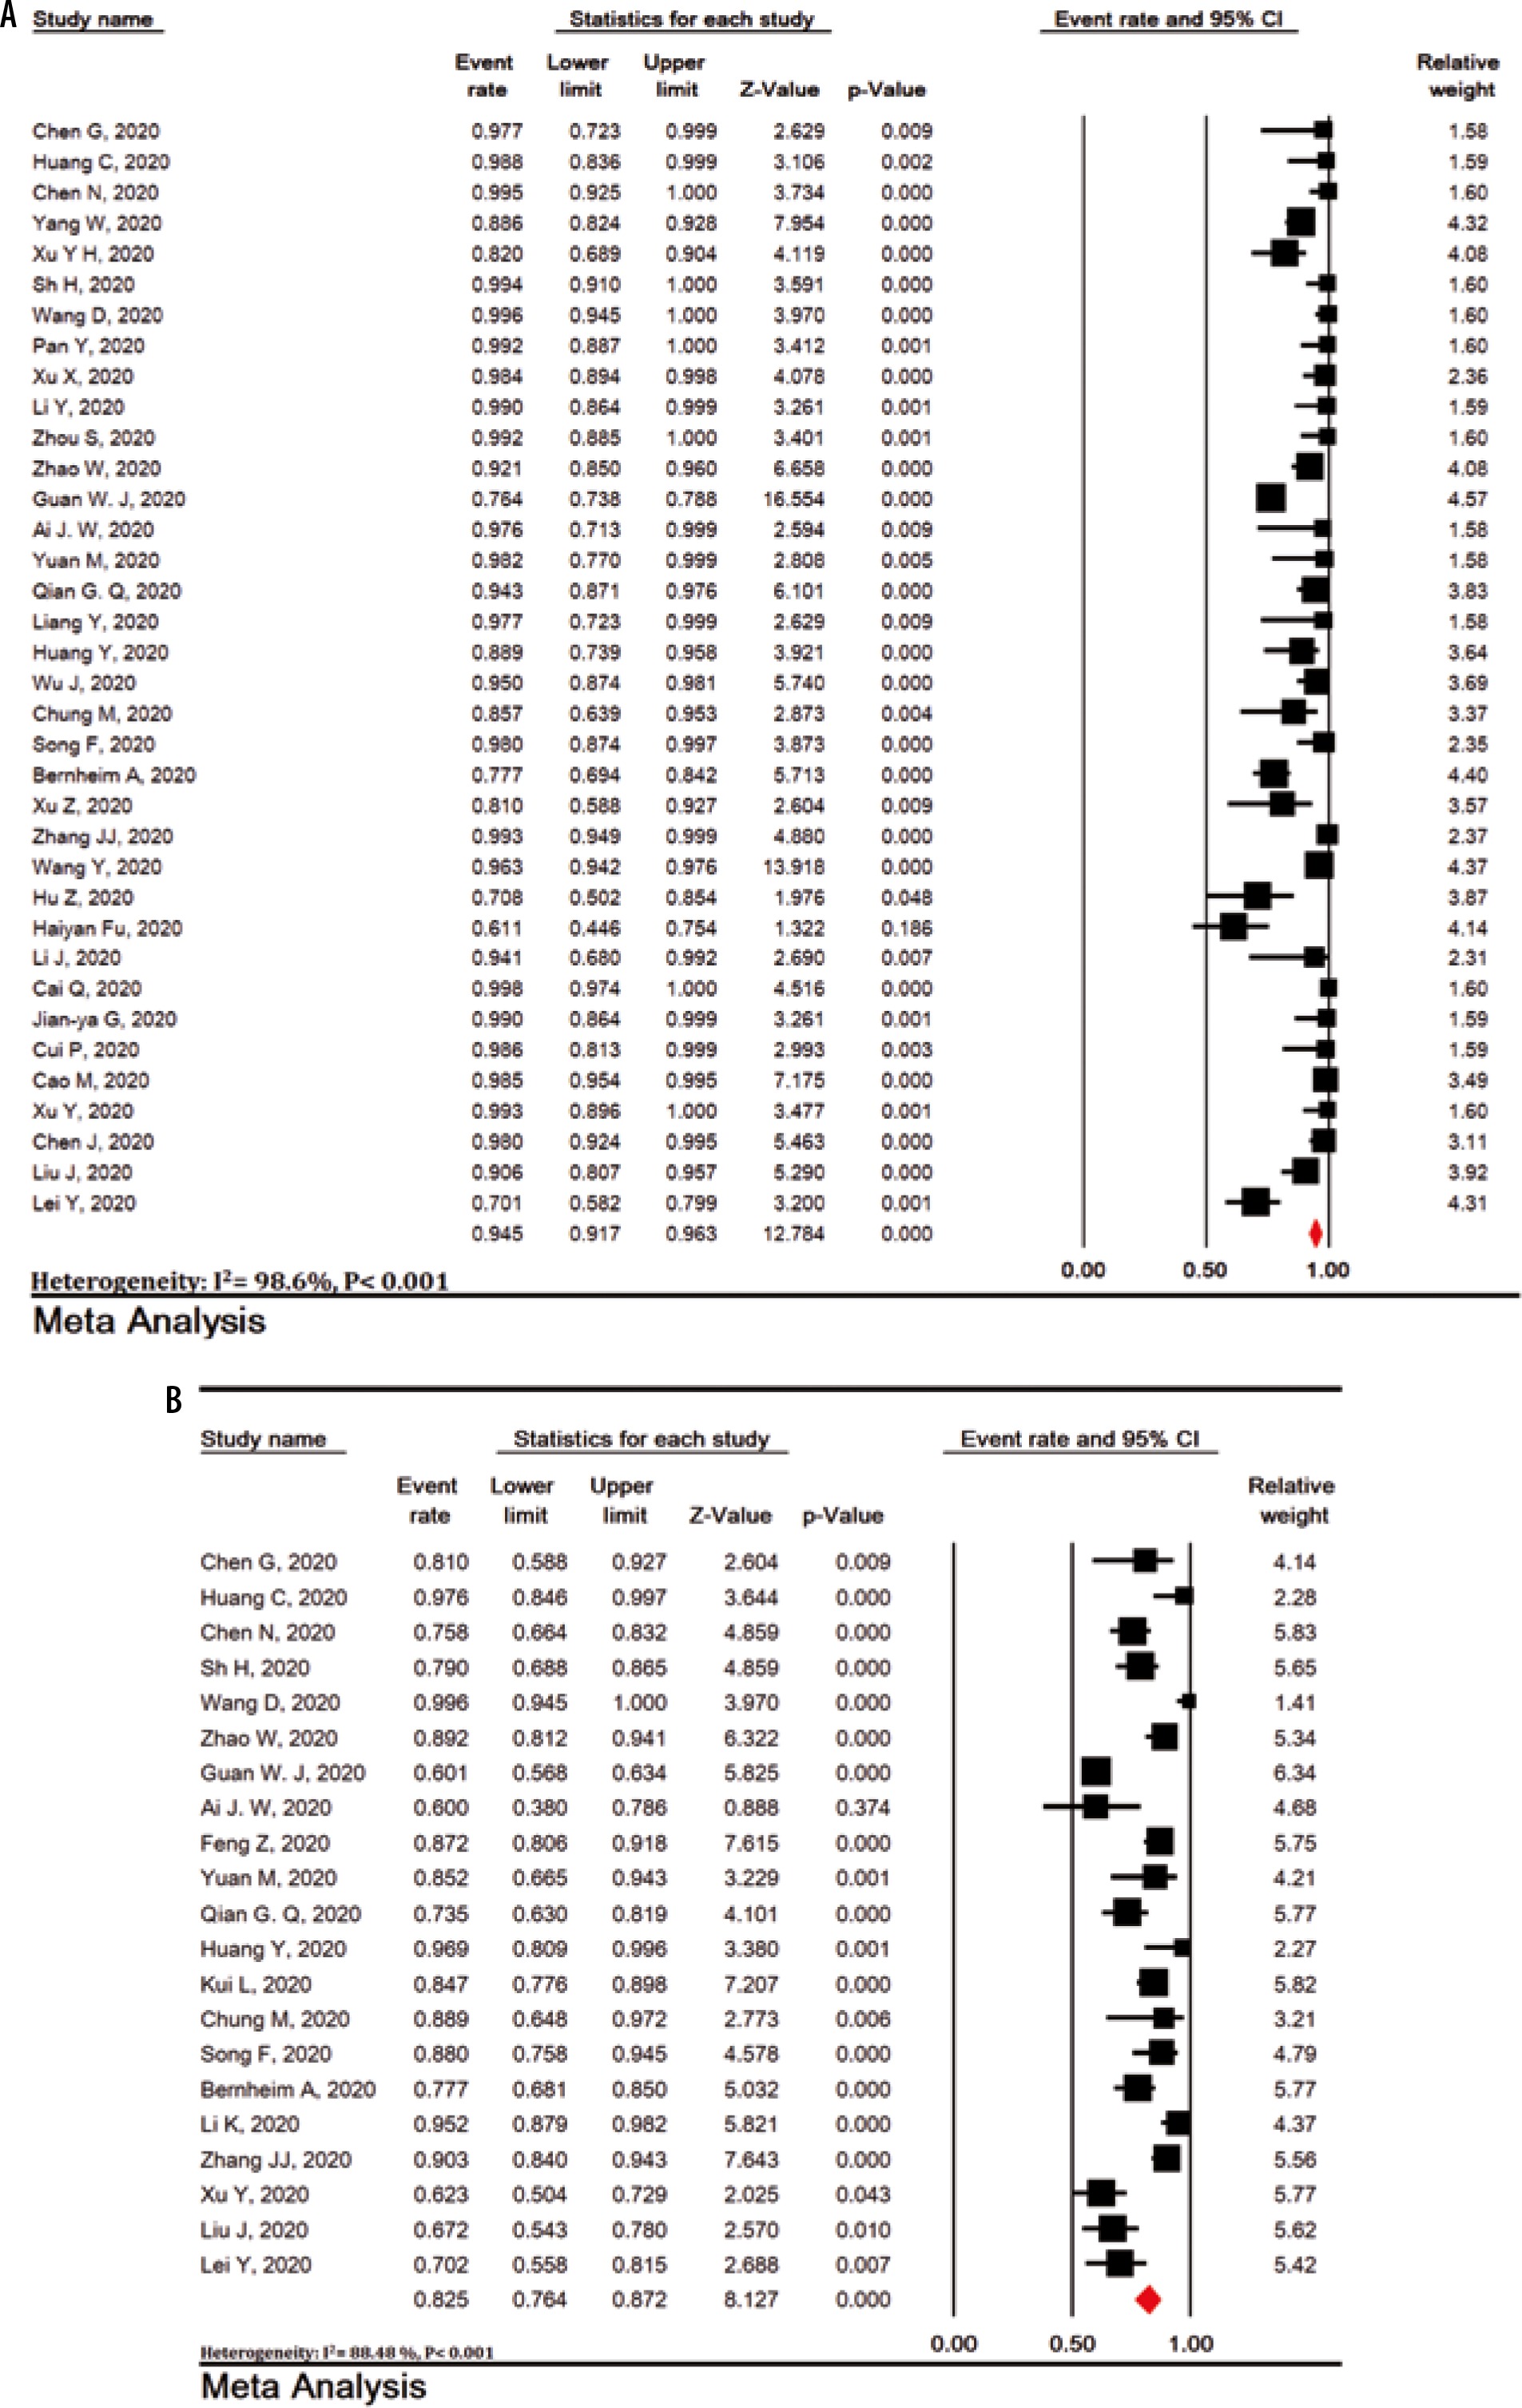
The sensitivity of chest CT scan in patients with COVID-19 was 94.5% (95% CI: 91.7-96.3; I2 = 98.6%). The lowest and highest estimates were for studies by Haiyan et al. (61.5%) and many other studies (100%), respectively (Figure 1A).
Bilateral lung involvement
Bilateral lung involvement in chest CT scan with COVID-19 pneumonia was observed in 79.1% of patients (95% CI: 70.8-85.5) (Figure 2B).
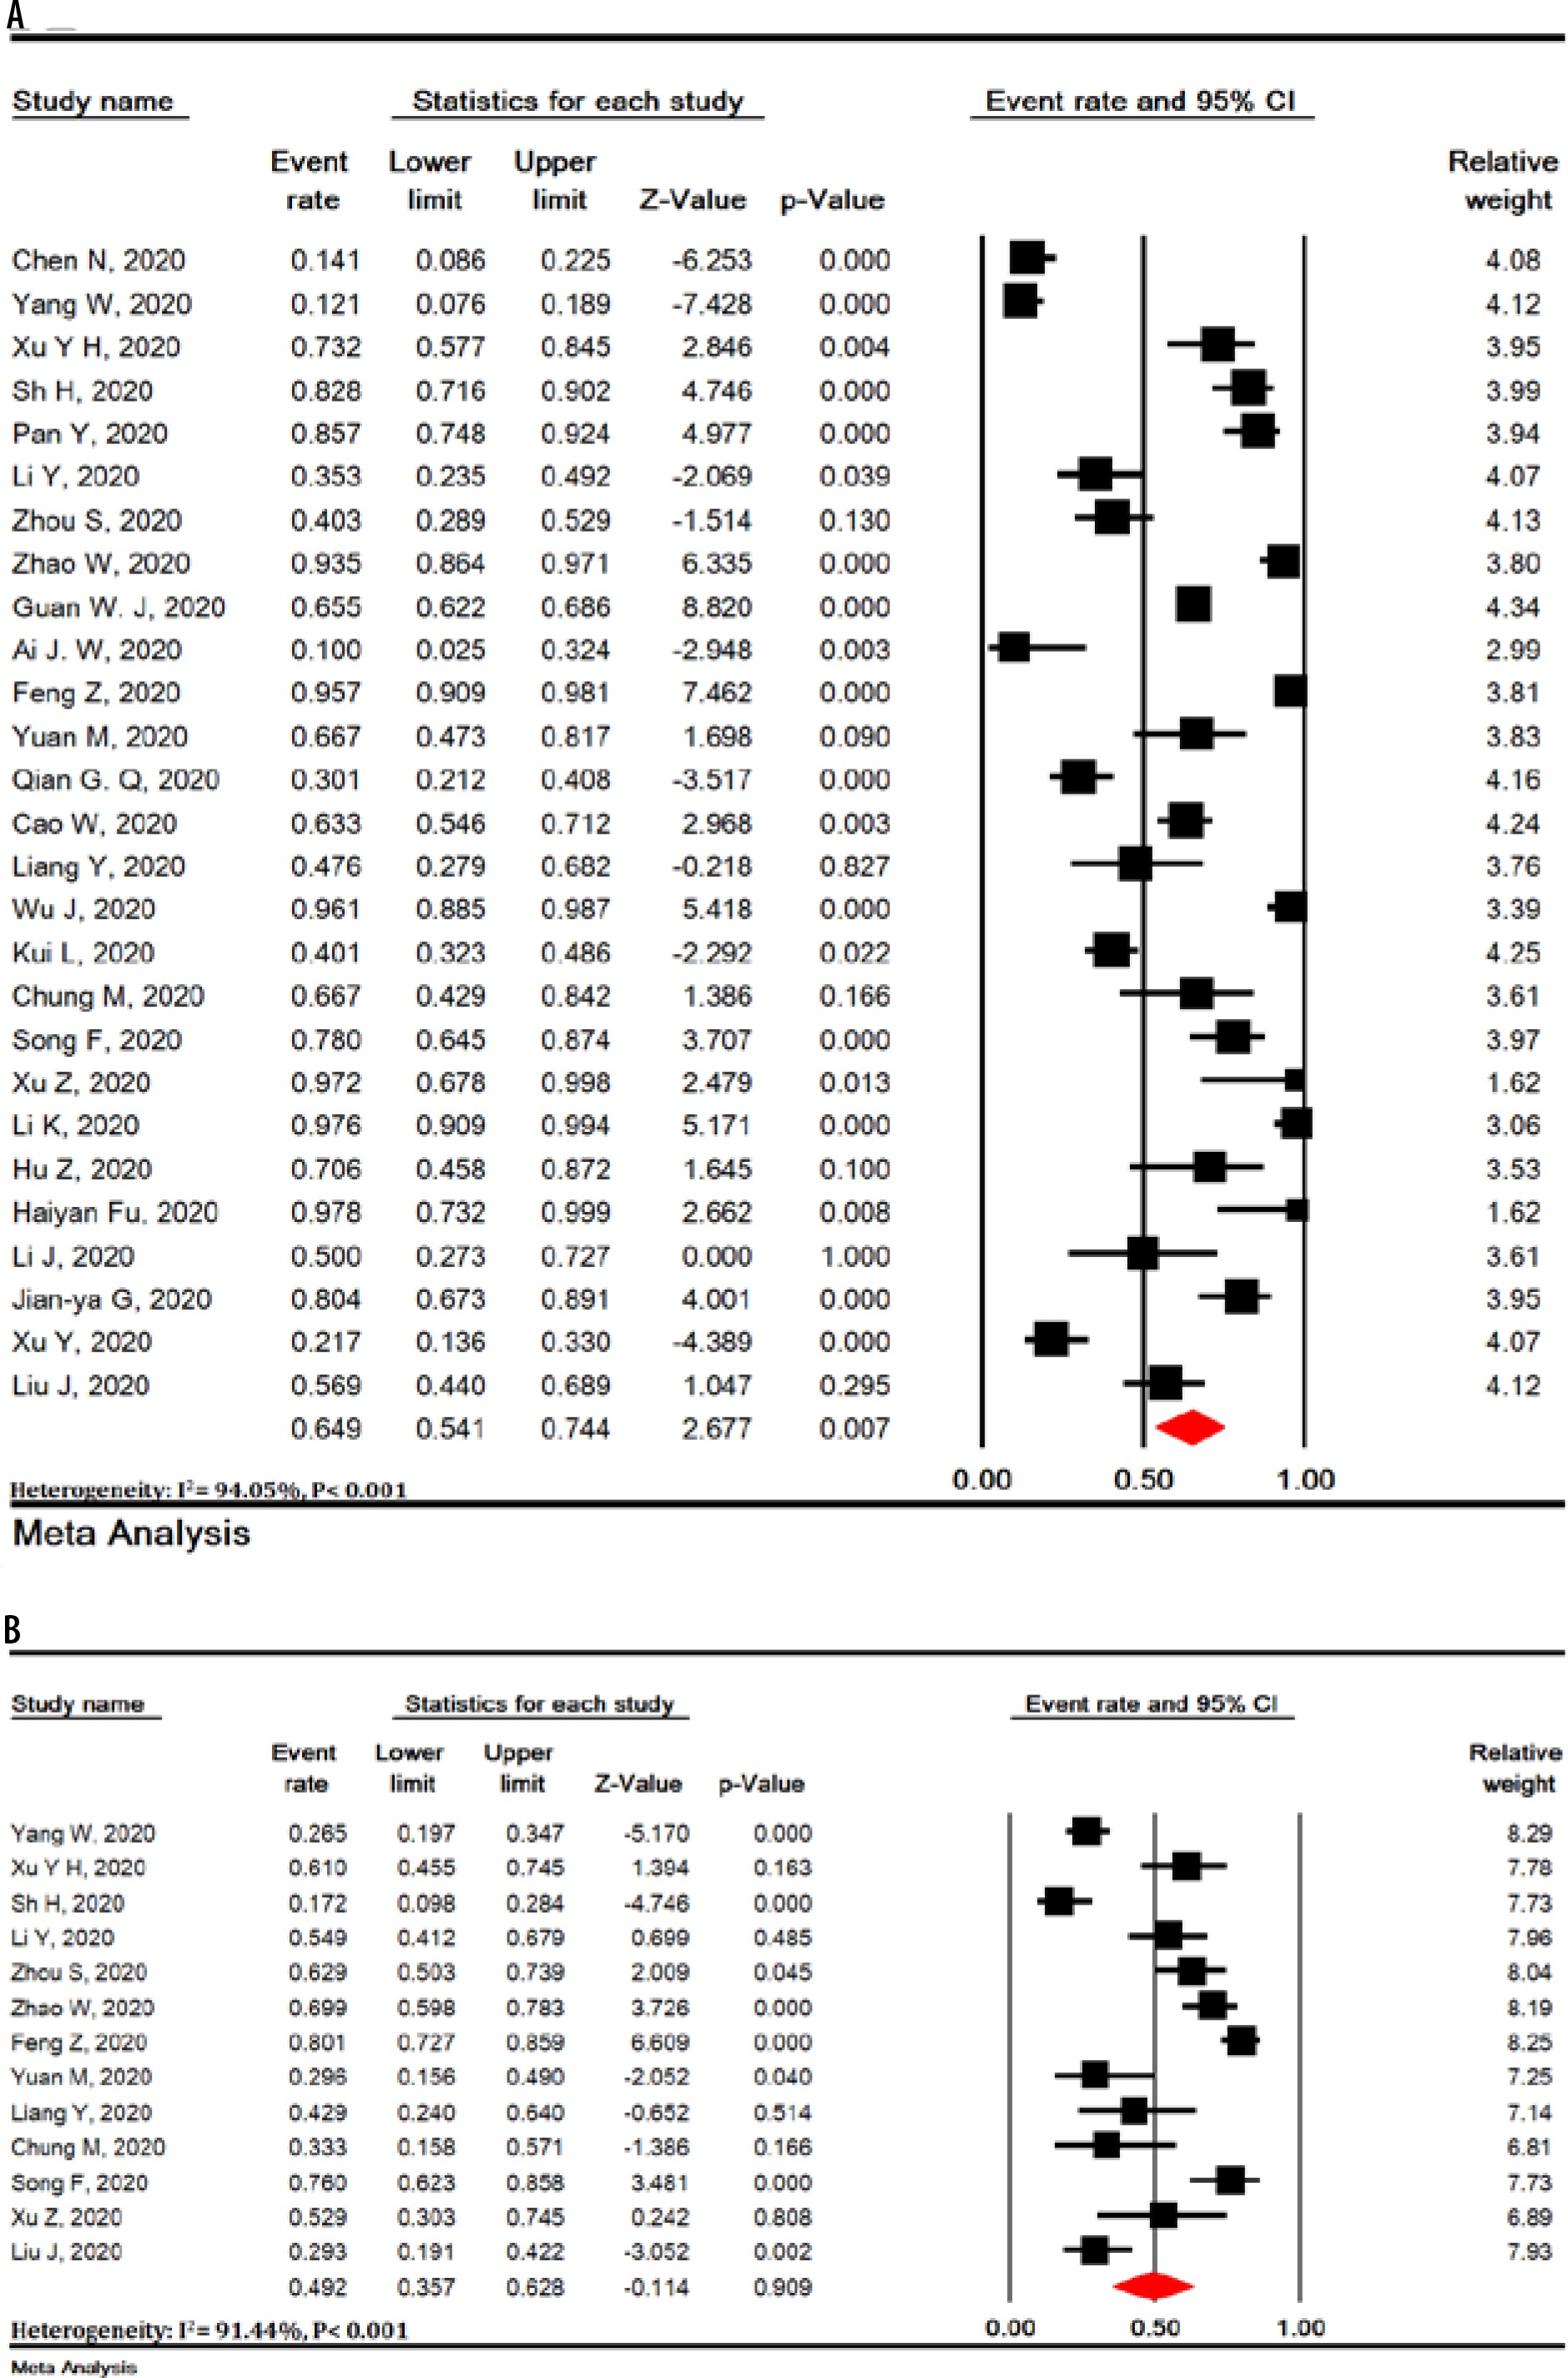
Predominant chest CT scan patterns
Pure GGO, mixed (GGO pulse consolidation or reticular), consolidation, reticular, and presence of nodule findings in chest CT scan of COVID-19 pneumonia patients were observed in 64.9% (95% CI: 54.1-74.4), 49.2% (95% CI: 35.7-62.8), 30.3% (95% CI: 19.6-43.6), 17.0% (95% CI: 3.9-50.9) and 16.6% (95% CI: 13.6-20.2) of patients (Figure 3).

Other chest CT scan features
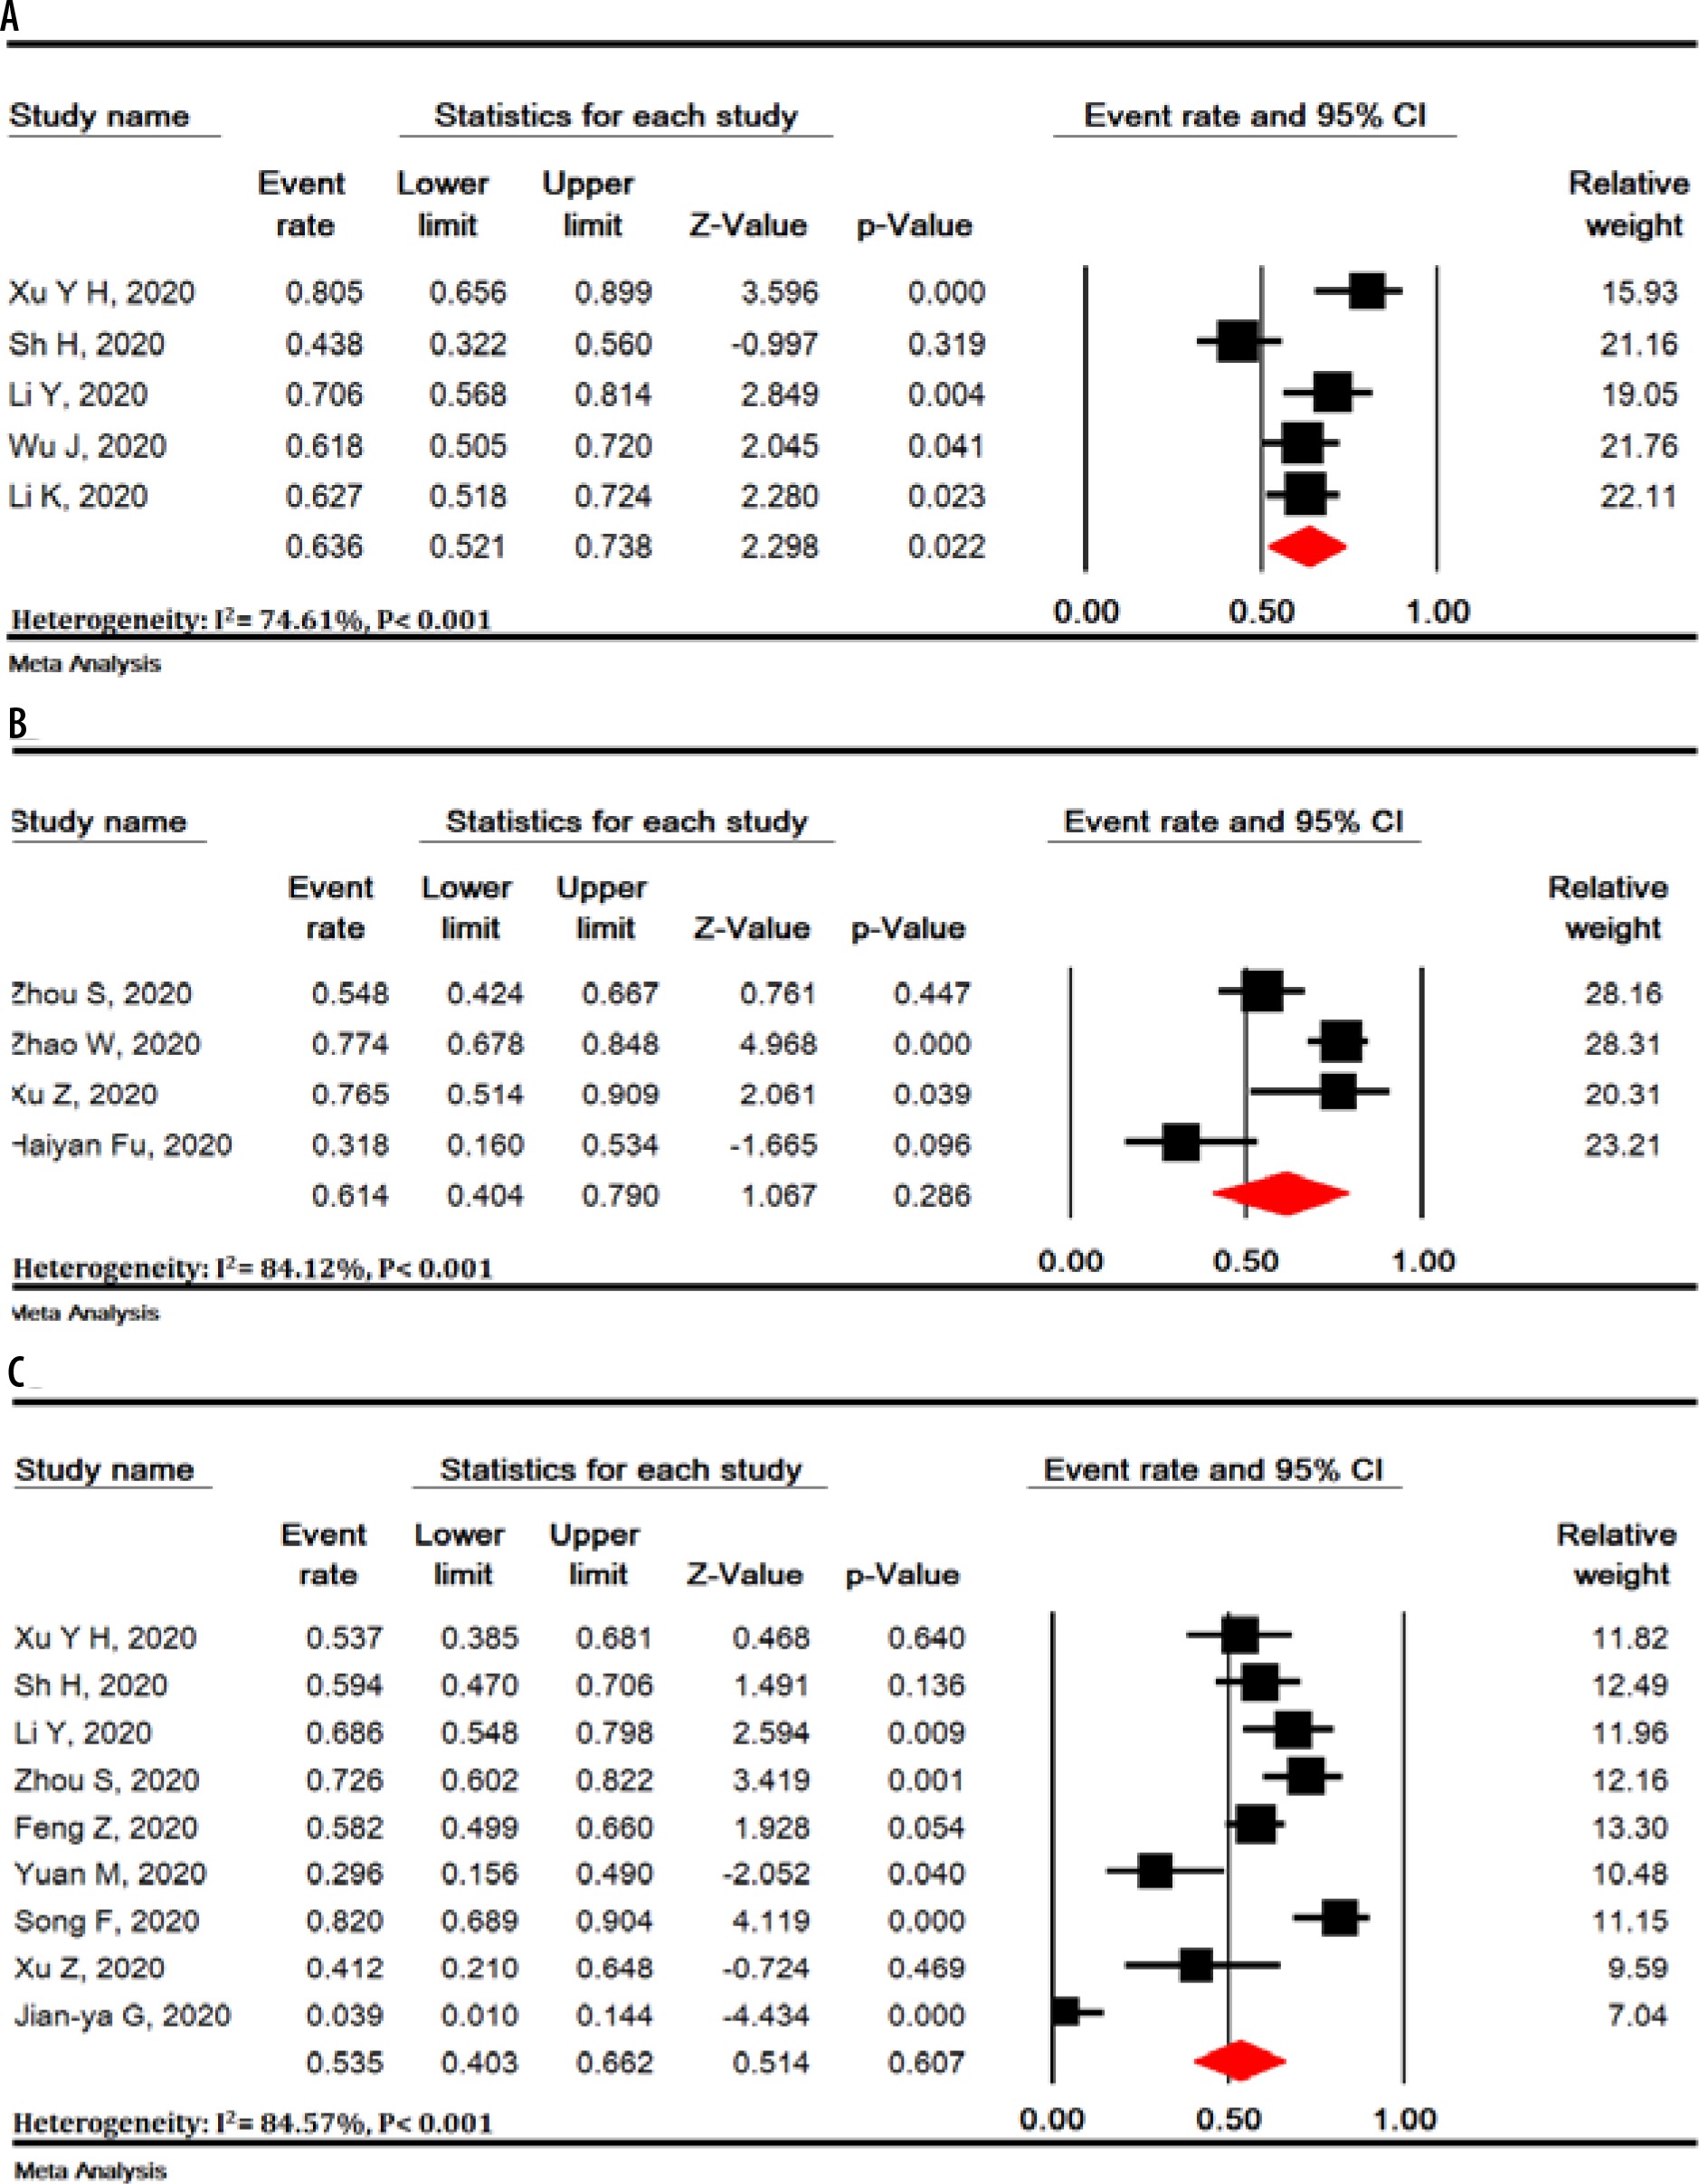
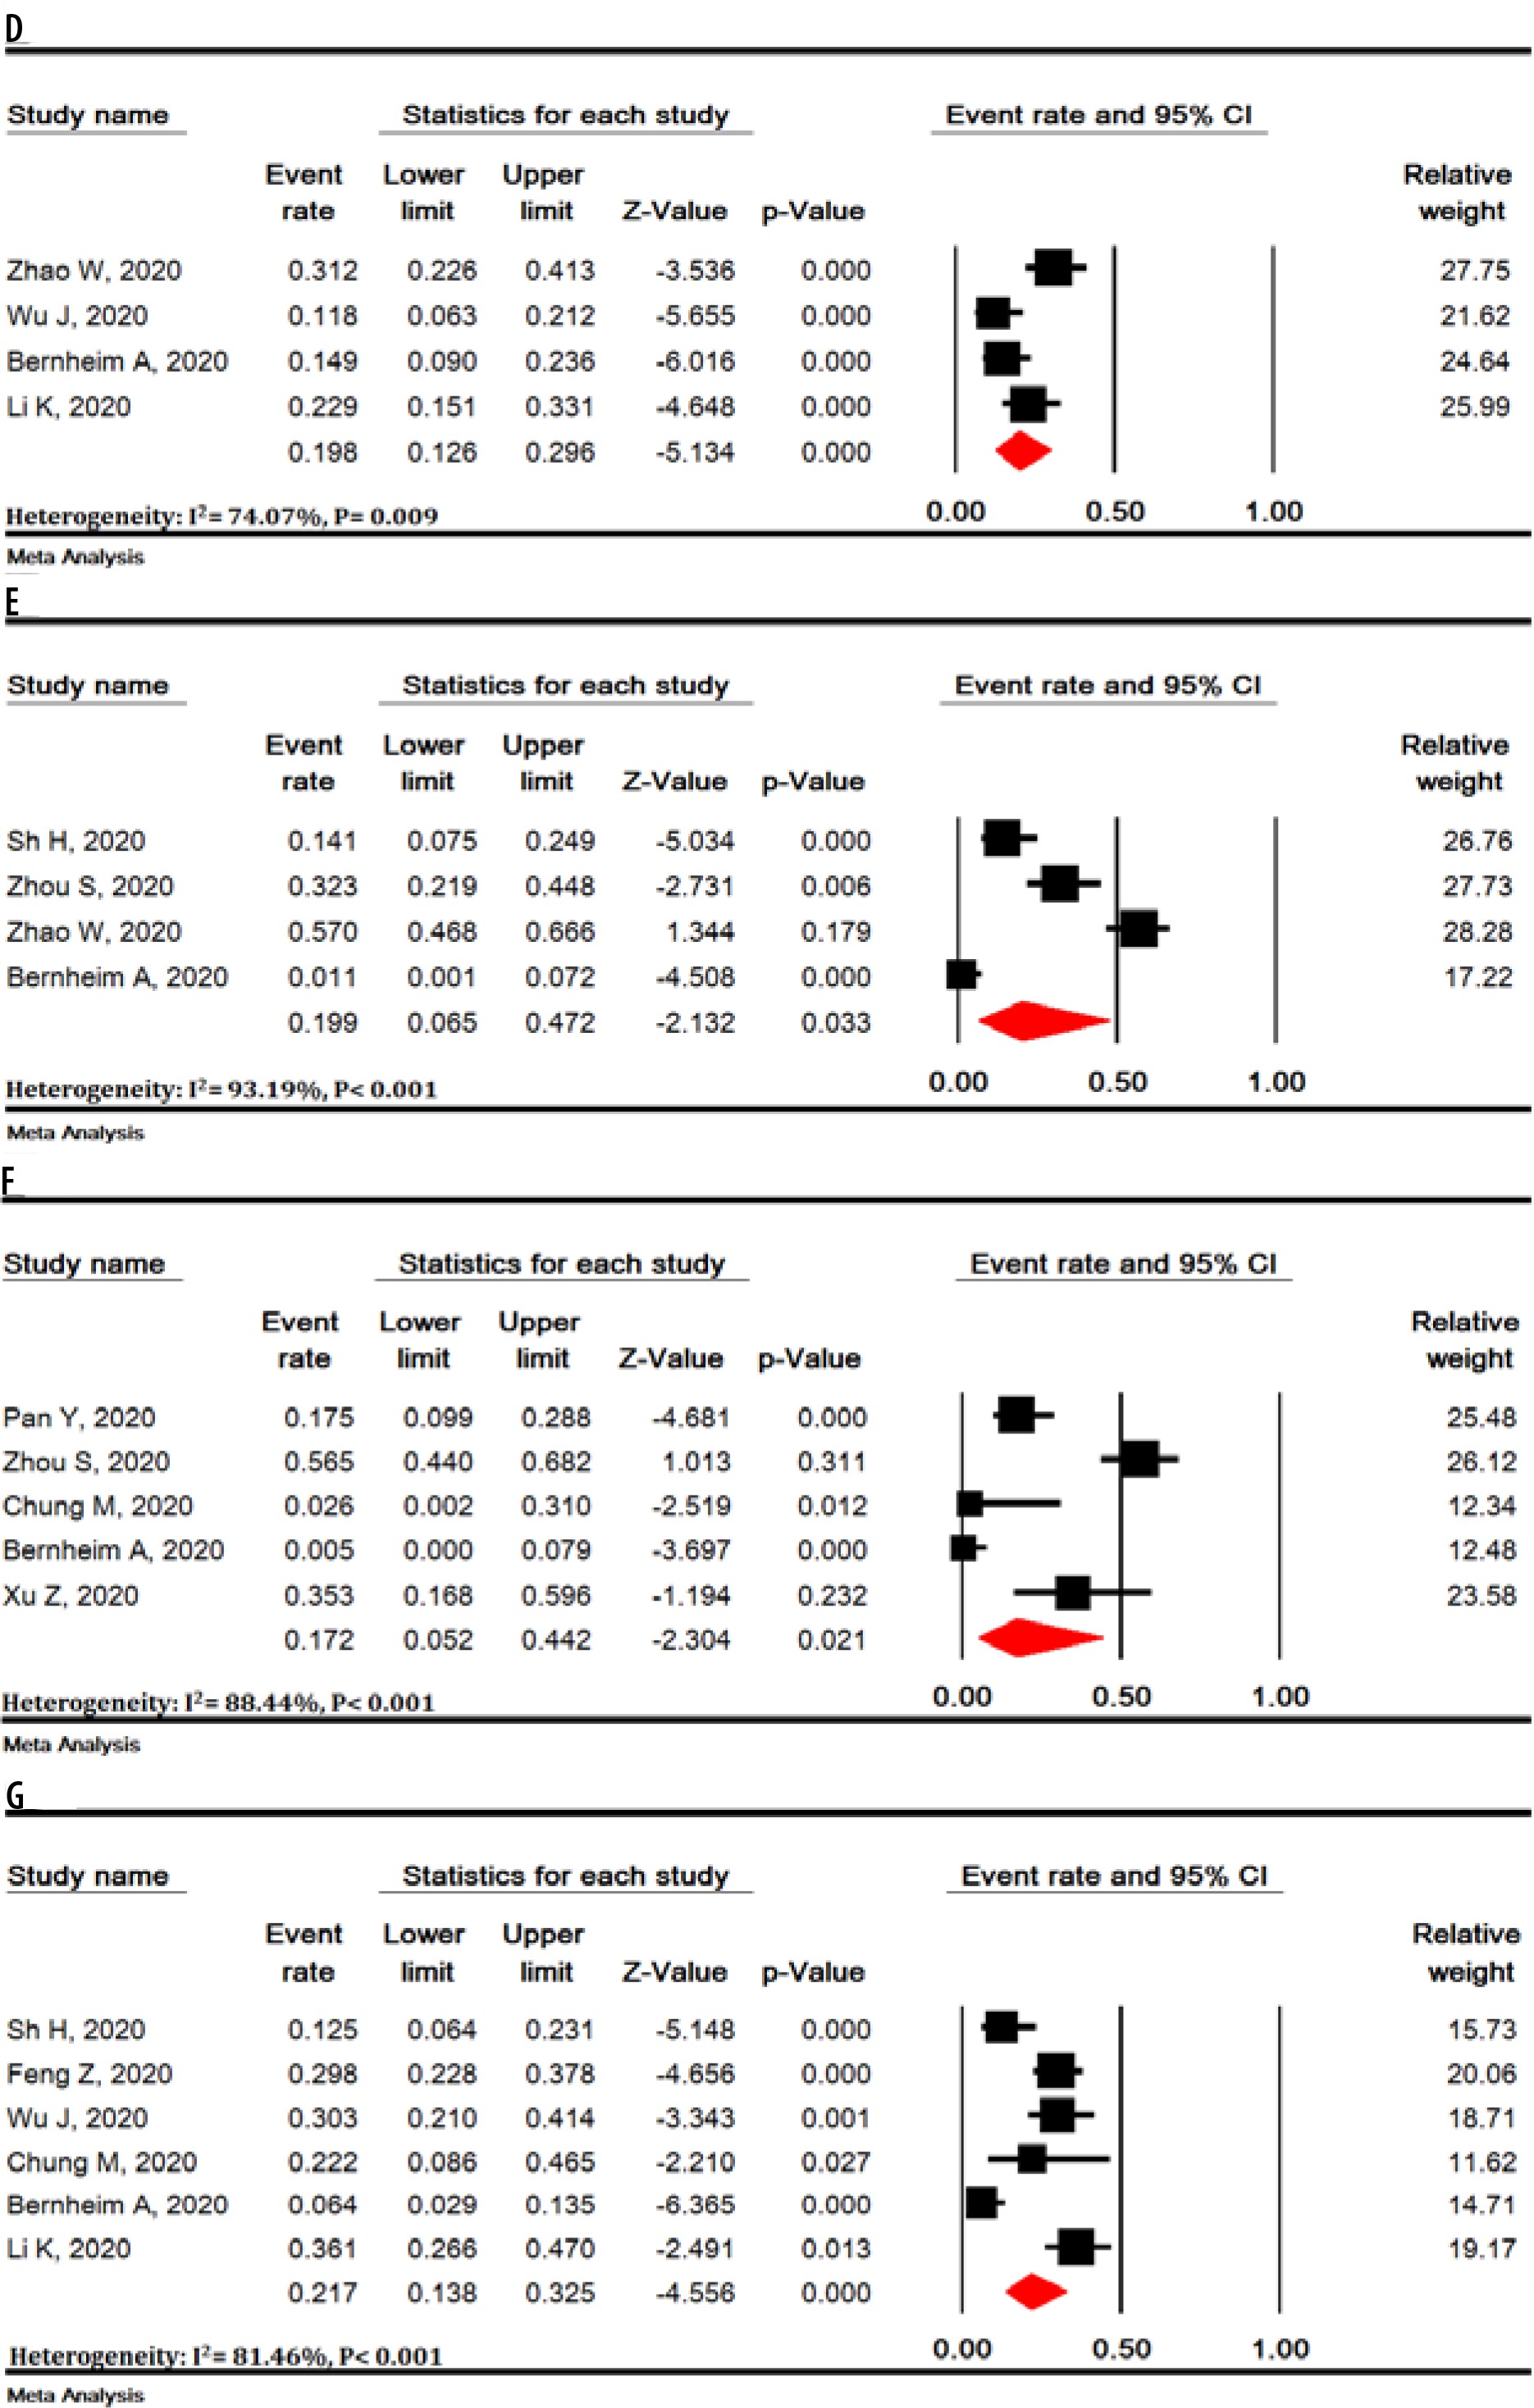
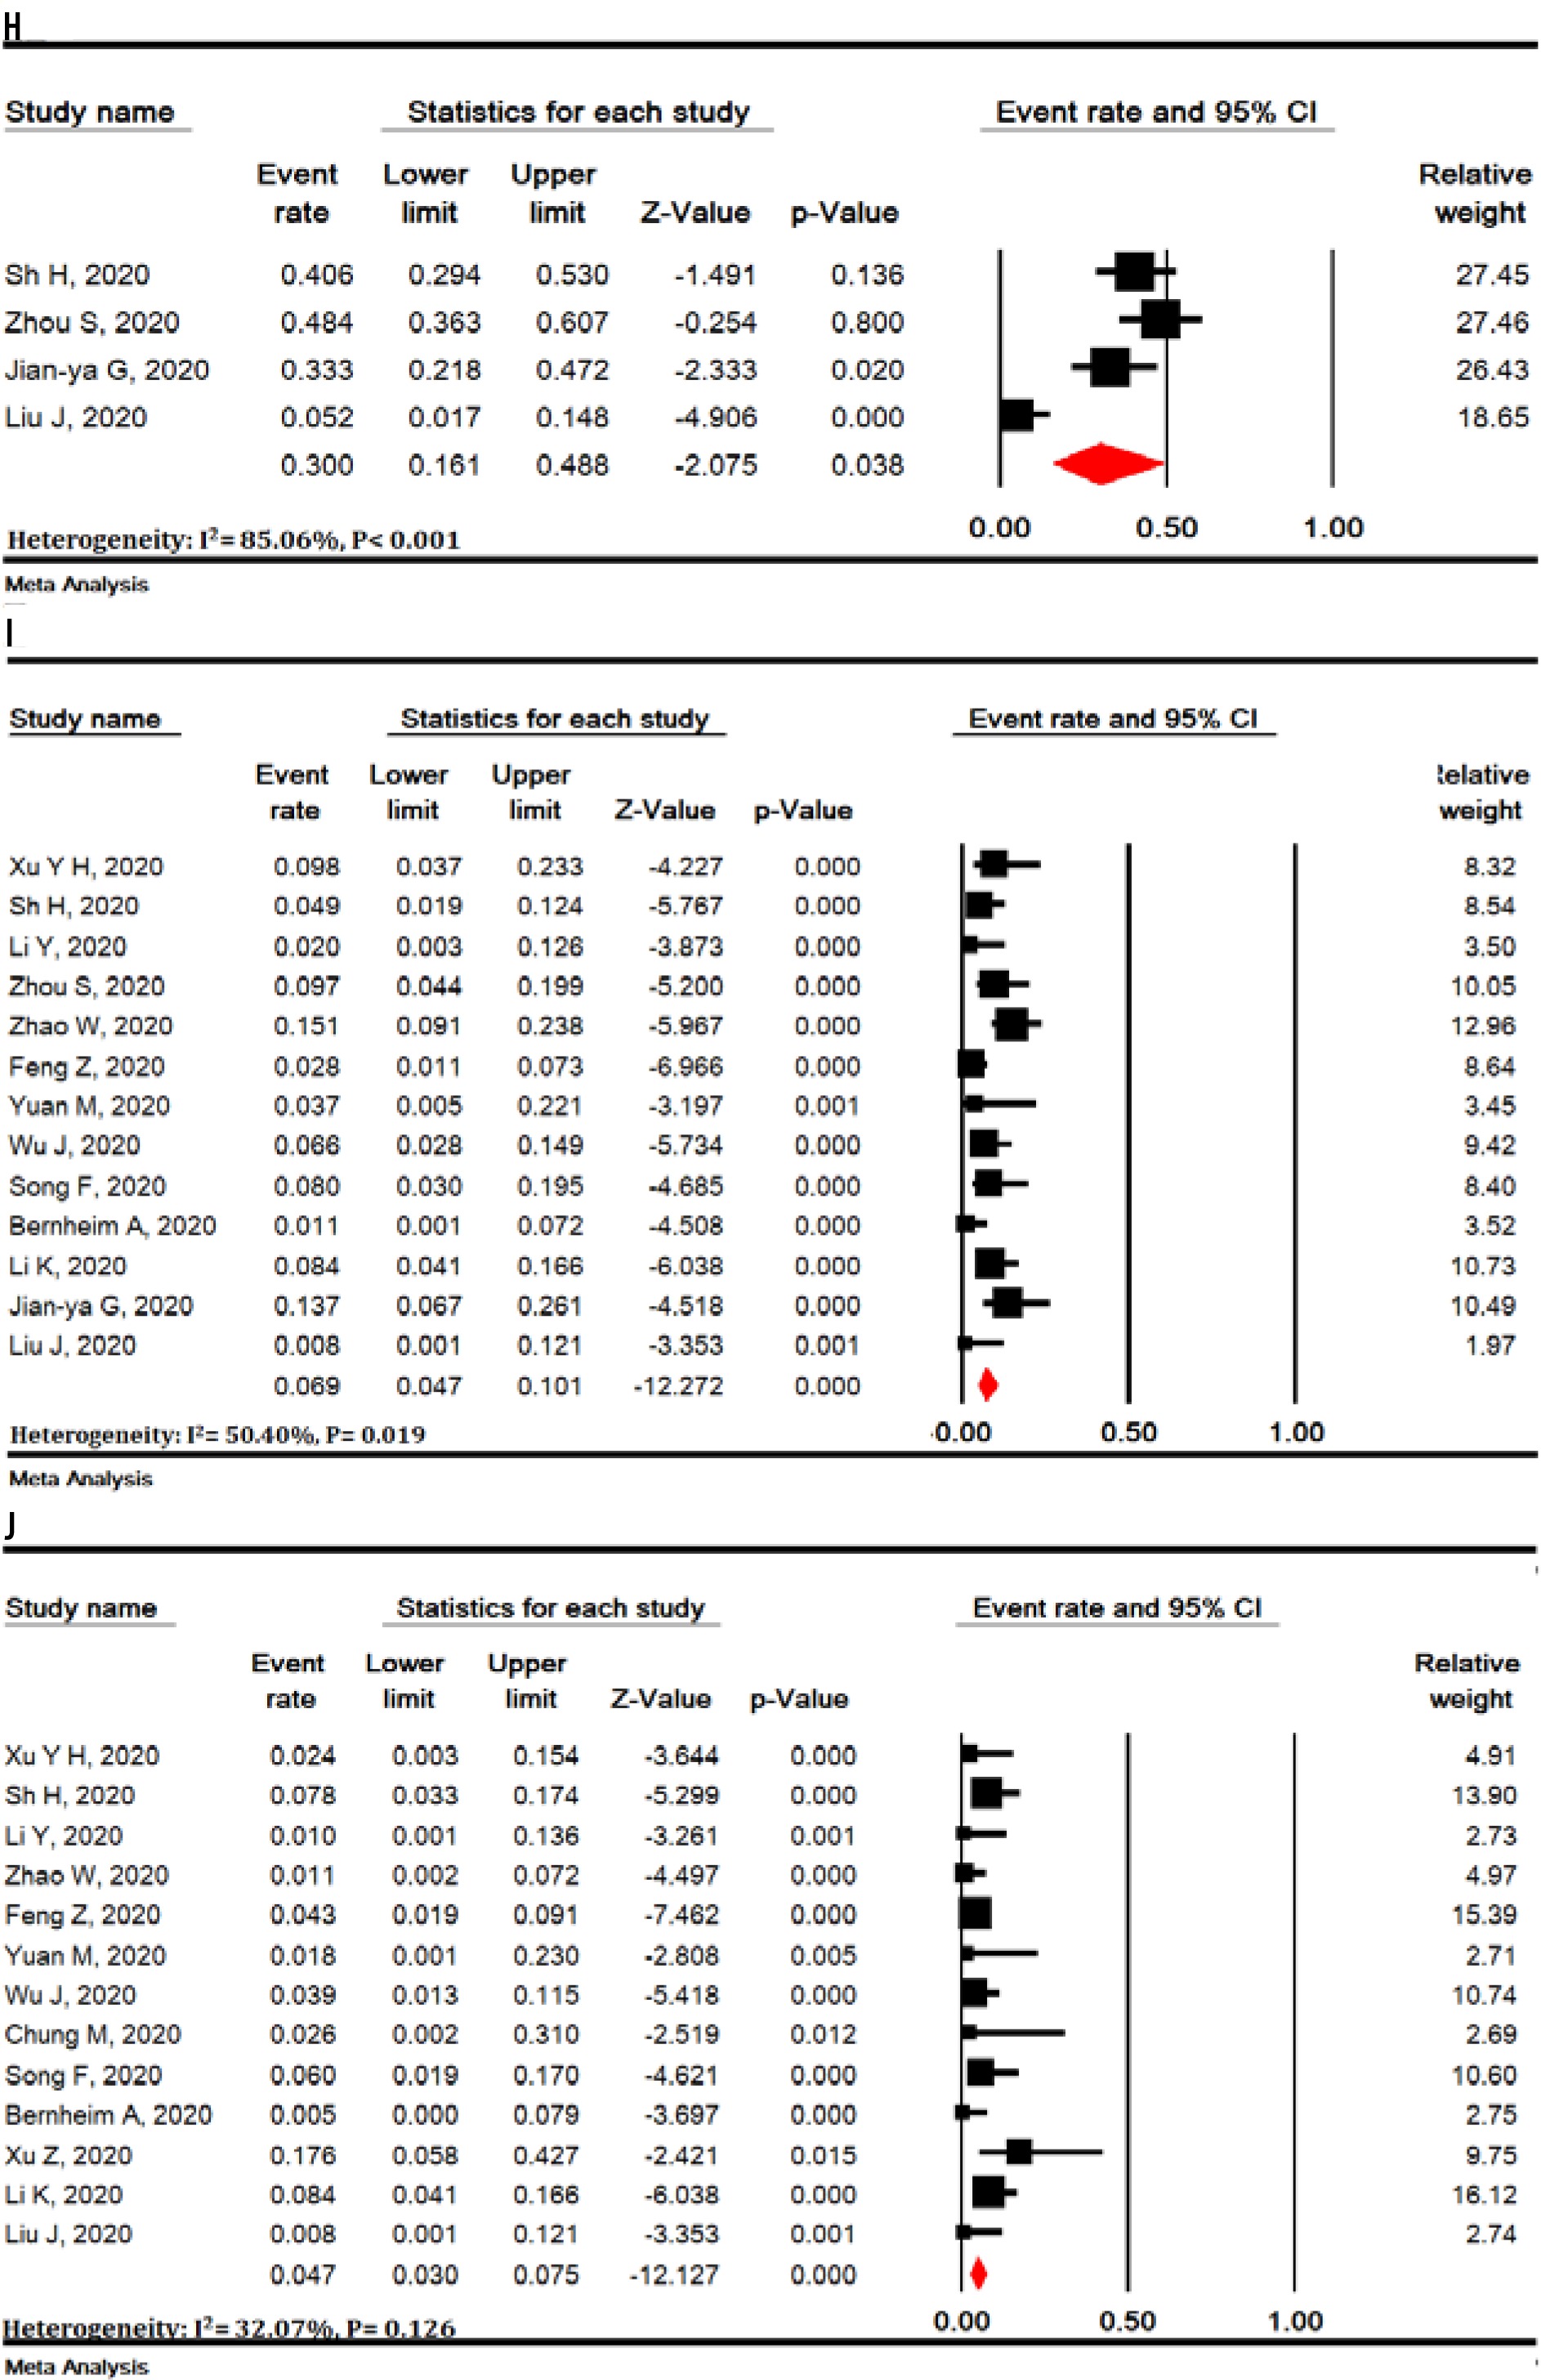
Other chest CT scan features are shown in Figure 4: thickened interlobular septa – 63.6% (95% CI: 52.1-73.8), vascular enlargement – 61.4% (95% CI: 40.4-79.0), air bronchogram sign – 53.5% (95% CI: 40.3-66.2), bronchial wall thickening – 19.8% (95% CI: 12.6-29.6), bronchiolectasis – 19.9% (95% CI: 6.5-47.2), fibrous stripes – 17.2% (95% CI: 5.2-44.2), crazy-paving pattern – 21.7% (95% CI: 13.8-32.5), thickening of the adjacent pleura – 30.0% (95% CI: 16.1-48.8), pleural effusion – 6.9% (95% CI: 4.7-10.1) and lymphadenopathy – 4.7% (95% CI: 3.0-7.5) (Figure 4).
Figure 4
Meta-analysis of thickened interlobular septa (A), vascular enlargement (B), air bronchogram sign (C), bronchial wall thickening (D), bronchiolectasis (E), fibrous stripes (F), crazy-paving pattern (G), thickening of the adjacent pleura (H), pleural effusion (I) and lymphadenopathy (J) findings in chest computed tomography scan of COVID-19 pneumonia
Lesions distribution
The distribution of lung lesions in patients with COVID-19 pneumonia was as follows: peripheral (70.0% [95% CI: 57.8-79.9]), central (3.9% [95% CI: 1.4-10.6]), and peripheral and central (31.1% [95% CI: 19.5-45.8]) (Suppl Figure 1).
Lobes involvement
Pulmonary lobes involvement in patients with COVID-19 pneumonia was as follows (Figure 5): right upper lobe (58.4% [95% CI: 33.6-79.5]), right middle lobe (49.7% [95% CI: 23.0-76.6]), right lower lobe (86.5% [95% CI: 57.7-96.8]), left upper lobe (64.5% [95% CI: 37.3-84.7]), and left lower lobe (81.0% [95% CI: 50.5-94.7]).


Number of involved lobes
In patients with COVID-19 pneumonia, the number of involved lobes was as follows (Suppl Figure 2): one lobe (58.4% [95% CI: 33.6-79.5]), two lobes (31.1% [95% CI: 19.5-45.8]), three lobes (10.5% [95% CI: 8.0-13.8]), four lobes (20.1% [95% CI: 15.4-25.9]), and five lobes (43.2% [95% CI: 34.2-52.6]).
Sensitivity analysis
Sensitivity analysis was performed for all meta-analyses and it showed that the overall result remains robust after the omission of one study at a time (Suppl Figures 3-7).
Risk of publication bias
Publication bias was evaluated for studies that showed positive chest CT scan of COVID-19 patients (Begg’s test = 0.774 and Egger’s test < 0.001) and for studies that showed bilateral lung involvement in chest CT scan of COVID-19 patients pneumonia (Begg’s test = 0.194 and Egger’s test < 0.001) (Suppl Figure 8).
Discussion
The present study is the first systematic review and meta-analysis that extensively examines chest CT scan findings in COVID-19 patients. Our study showed that chest CT scan has high sensitivity in the diagnosis of COVID-19. COVID-19 is a new disease with serious consequences for public health. Chest CT scan is an important part of disease detection for patients suspected of having COVID-19 infection and may help early detection of lung malformations for the purpose of screening highly suspected patients, especially those with negative initial reverse-transcription polymerase chain reaction (RT-PCR) screening [54]. In fact, given the limited number of RT-PCR kits in many centers and the likelihood of false negative RT-PCR results, the National Health Commission of China has encouraged clinical findings and chest CT scan [55]. Our review showed some imaging findings that are often seen in patients with COVID-19. The present study showed that 94.5% of COVID-19 patients had positive chest CT scan findings, while the frequency of bilateral lung involvement in chest CT scan of COVID-19 pneumonia patients was 79.1%. It is important to observe the high incidence of bilateral organizing pneumonia in these patients. This suggests that corticosteroids may be an option to suppress this immune response in lung parenchyma of COVID-19 pneumonia.
Viruses are a common cause of respiratory tract infection. Imaging findings of viral pneumonia are varied, and may overlap with other infectious and inflammatory lung diseases. Viruses in the same viral family have a similar pathogenesis, so chest CT scan may help identify distinct patterns and features in immunocompromised patients [56]. Meta-analysis of initial data suggests that chest CT scan findings for 2019-nCoV have many features similar to other viruses such as the middle east respiratory syndrome (MERS-CoV) and severe acute respiratory syndrome (SARS-CoV) [57].
In the present study, most pulmonary lesions include bilateral lung involvement with multiple lung lobes (predominantly right lower lobe and left lower lobe), with dominant distribution in the peripheral portion of the lungs. Studies have shown that influenza pneumonia tends to affect the lower lobes [56,58]. Wang et al. also showed that H7N9 pneumonia has a predominant distribution in the right lower lobe [58]. Both H1N1 and SARS pneumonia are more peripherally distributed [59,60], whereas no lobe infection is found in H5N1 influenza [61]. However, lung involvement with peripheral predominance has also been observed in SARS and MERS. Similarly, previous coronavirus pneumonias have a similar pattern. The dominant peripheral distribution for COVID-19 was shown in our study. Such a distribution is obvious at first glance. This feature of chest CT scan is caused by alveolar injury and pulmonary interstitial edema. We also observed some chest CT scan features of COVID-19 that differ from chest CT scan features of SARS and MERS. Unifocal involvement is more common than multifocal involvement in patients with SARS and patients with MERS [62,63]. However, contrary to what is seen in the chest CT scan of patients with COVID-19, multi-lobe involvement was more common than single-lobe involvement in the present meta-analysis. Thus, more than two lobes are likely to be involved in this disease. To the best of our knowledge, these findings have not been reported in the literature related to SARS and MERS.
Our results showed that the most common findings of imaging were pure GGO, GGO with mixed consolidation or reticular pattern, interlobular septal thickening, and consolidation. Reticular and nodular pattern were relatively small, which may be explained in the first stage of the disease. In H7N9 pneumonia, most cases showed consolidation [62]. Each of the chest CT scan patterns in our patients is nonspecific and may overlap with other microorganism infections such as H7N9 pneumonia, H1N1 virus infection, SARS, MERS, and avian influenza A (H5N1) [60-63].
GGO, consolidation, and interlobular septal thickening are the most common chest CT scan findings of H1N1 influenza pneumonia, too [59]. Based on the present meta-analysis, pure GGO is a common finding in about 65% of cases, and GGO with interlobular septal thickening/consolidation in 49% of COVID-19 pneumonia patients. Thus, these features of chest CT scan can be seen in most patients. This finding, along with the dominant distribution in the peripheral part of the lungs, is not common in other viral pneumonias [8,18,27,29,60,61].
In addition, we found that all features of chest CT scan that exist in the initial chest CT scan of patients with COVID-19, such as GGO and consolidation, and other chest CT scan features such as vascular enlargement, interlobular septal thickening, and air bronchogram sign, are also present in the chest CT scan of SARS and MERS. The low incidence of pleural effusion and lymphadenopathy noted in our data was also a feature of chest CT scan in previous studies about SARS [57]. This may be due to the inherent anatomical features of the lower lobe bronchus. The right lower lobe bronchus is tighter than other bronchi of the lung, and the angle between the right lower lobe and the long axis of the trachea is smaller, so it is more viral at early stages. Most likely, it attacks the bronchial branches of the lower lobe and causes infection.
Interestingly enough, we found that most patients have vascular enlargement lesions (61.4%) that may be caused by an acute inflammatory response. However, vascular changes are not similar to changes in malignant lesions such as lung adenocarcinoma that cause vascular dilatation or irregularity and vascular convergence, which may be due to chronic progression and tumor infiltration [17,64].
Angiotensin II converting enzyme is a key molecule involved in the development and progression of acute lung failure. COVID-19 induces direct lung injury by involving angiotensin converting enzyme, which contributes to the progression of alveolar injury [65]. This may explain the pathological mechanism of GGO and consolidation as well as rapid changes in chest CT scan findings. Our results support the observed process, according to which bilateral GGOs or mixed GGOs in chest CT scan should prompt the radiologist to recommend COVID-19 as a possible diagnosis [66,67].
Conclusions
In summary, this work is a meta-analysis on preliminary studies of chest CT scan findings about COVID-19, aimed at introducing the common imaging manifestations of the disease. Radiologists play an important role in rapid identification and early detection of new cases, which can be useful not only for the patient but also for public health surveillance systems. It is important to recognize the fact that the appearance of CT findings about COVID-19 has some similarities to other viral diseases, especially those in the same viral family (SARS and MERS). Future studies are recommended to determine how CT scans of COVID-19 patients change after treatment.
Limitations of this study include the following: 1. All studies were performed in China, and the severity of chest CT scan manifestations might be affected by ethnic factors; 2. Most patients were hospitalized patients and patients with milder symptoms or those who were not hospitalized, which may cause bias in the results; 3. In most preliminary studies, chest CT scan findings were not separately reviewed according to patients admitted to the ICU or the isolation ward; 4. Follow-up for chest CT scan during treatment until discharge was not included in our study; 5. Our results are based on CT findings during admission, but patients might have experienced symptoms before admission (because chest CT scan findings are influenced by the clinical course of the disease), and during this time the patient might have received antiviral or antibacterial drugs, or steroid therapy, and this might have affected the chest CT scan findings; 6. Since all studies were performed in 2020 in China with the same diagnostic method, we could not discover the cause of heterogeneity.
In conclusion, the most important outcomes in chest CT scan of patients with COVID-19 pneumonia were bilateral lung involvement, GGO or mixed (GGO pulse consolidation or reticular) patterns, thickened interlobular septa, vascular enlargement, air bronchogram sign, peripheral distribution, left and right lower lobes involvement, and one or five lobes involvement.
Our study showed that chest CT scan has high sensitivity in diagnosis of COVID-19, and may therefore serve as a standard method for diagnosis of COVID-19. Rapid detection may lead to early control of the transmission. By diagnosing viral pneumonia on CT scan, infected or suspected patients can be isolated and treated in a timely manner to optimize patient management, especially for hospitals or communities without RT-PCR test kits. However, chest CT scan is still limited in terms of identifying specific viruses. It is important that radiologists recognize whether chest CT scan findings for COVID-19 overlap with chest CT scan findings for diseases caused by different virus families, such as adenovirus.