


Introduction
Coronavirus disease (COVID-19) has been spreading worldwide since December 2019 from Wuhan, Hubei Province [1]. The virus called SARS-Cov-2 belongs to the Betacoronavirus genus, is composed of a positive single-stranded RNA, and has a 50-200 nm diameter [2,3]. Bats are the natural reservoir for coronaviruses [4]. By April 26th 2020, more than 2,355,853 cases (of which 947,693 in Europe) and 164,656 deaths worldwide had been reported due to this pandemic [5]. By March 16th 2020 in France, 124,114 cases had been confirmed, with 22,614 deaths [6]. Fever, cough, fatigue, diarrhoea, dyspnoea, and myalgia are the most common symptoms, but the patients’ condition can deteriorate rapidly, requiring intensive medical care [7,8]. Real-time reverse-transcription polymerase chain reaction (RT-PCR) is the standard reference to detect viral nucleic acid, but false-negative results have been reported and have led to a 66-80% sensitivity due to multiple factors, notably the quality of sampling [9]. Compared to RT-PCR, chest computed tomography (CT) is an easy-to-use and a faster method to diagnose and assess an early pulmonary COVID-19 infection [10]. Chest CT can also help to monitor the evolution and diagnose complications of COVID-19. Indeed, some authors have demonstrated the diagnostic value of chest CT in COVID-19 pneumonia describing compatible radiological signs [11-13]. Ai et al. evaluated chest CT diagnostic value in 1014 cases of suspected COVID-19 using RT-PCR as a reference, and they determined a sensitivity of 97% and negative predictive value of 83% [10]. Few authors have studied the prognostic value of chest CT. Yuan et al. found in a small sample of 27 patients (of whom 10 died) higher rates of consolidation and air bronchogram in the dead patients’ group [14]. In a retrospective study, Zhao et al. found pleural effusions and architectural distortions to be CT signs potentially correlated with severe deterioration in a small population of severe or deceased patients (14/101 patients) [15]. Yang et al. proposed a pulmonary inflammation load score, which was higher in patients with severe COVID-19 in comparison with patients who had a mild form of the disease [16]. However, despite these elements, few studies have shown whether there was a relation between some early chest CT signs and the need for invasive endotracheal ventilation (IEV).
In this study, our main objective was to assess whether some chest CT signs were associated with pejorative evolution (defined as a need for IEV or death), in COVID-19 patients.
Material and methods
Study design
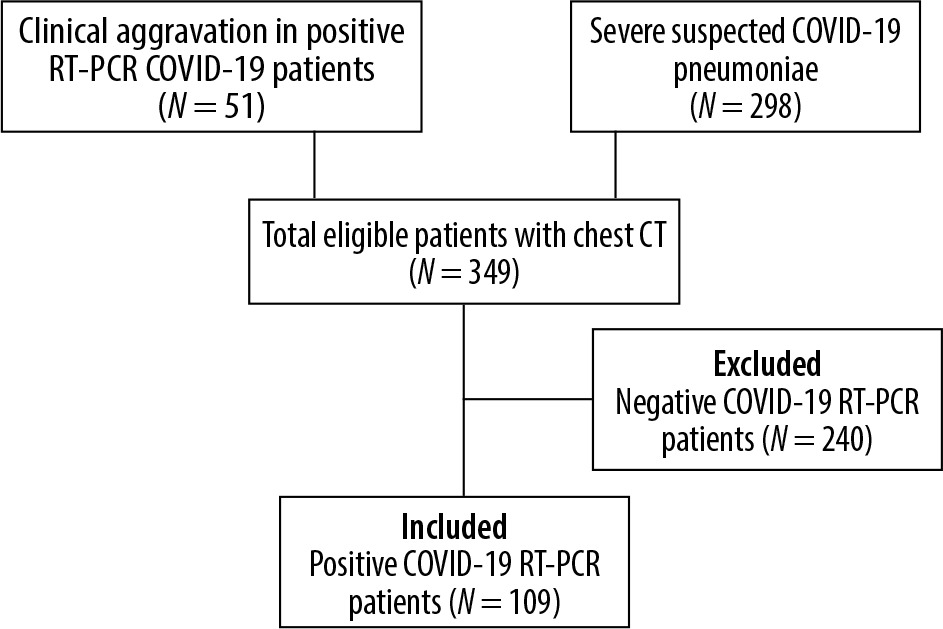
Ethical approval of this monocentric retrospective study was delivered by the review board of our hospital. We used the data of a cohort of 349 patients included from March 19th to April 28th 2020, which was created to study the diagnostic value of chest CT for COVID-19. The patients were included in the cohort if they had a chest CT, either for suspected COVID-19 pneumoniae with severe symptoms or for clinical deterioration during a COVID-19 infection that had been confirmed with a positive RT-PCR. We included in our study 109 patients who had a positive COVID-19 RT-PCR.
The patient selection and inclusion process are represented in a flow diagram in Figure 1. The clinical severity scale was assessed according to the Chinese Centre of Disease Control and Prevention describing four groups of severity in the COVID-19 disease: uncomplicated illness, moderate pneumonia with dyspnoea, severe pneumonia, and acute respiratory distress syndrome (ARDS) [17,18].
RT-PCR test and clinical synthesis
Coronavirus nucleic acid was collected with nasopharyngeal swab or/and bronchial aspiration. RT-PCR was performed using gene amplification RdRpE, and/or N (CNR Pasteur technic, AllPlex Seegene, Bosphore Anatolia; depending on availabilities). For patients who presented a high clinical probability of infection, two or three RT-PCR tests were performed if the previous results were negative, with a minimum of 48-72 hours between samples.
If one RT-PCR was positive, COVID-19 diagnosis was confirmed. In the case of multiple chest CTs, we used the one that was closest, timewise, to the first positive RT-PCR. All patients were included, whatever the time between positive RT-PCR and chest CT.
Primary outcome
The primary outcome was pejorative evolution, which we defined as use of IEV or death.
Chest computed tomography protocol
Chest CT was performed for all patients. Images were obtained in supine position by one of the two following CT scanners: an Aquilion Prime 160 (Toshiba, Japan) or a Somatom Force CT VB10 (Siemens Healthiners, Germany). The scanning parameters were as follows: tube voltage 120 kV, automatic dose modulation (30-210 mAs), matrix 512 × 512, pitch 0.35-0.99, slice thickness 0.5 mm, and field of view 500 mm × 500 mm. A 0.5 mm slice thickness was used after image reconstruction. When a pulmonary embolism was suspected, iodinated contrast media (300 mg/l) was intravenously injected (3 to 4 ml/s) according to patient weight, with bolus tracking in the main pulmonary artery. Reconstructed images were archived and transferred to the informatic network.
Chest computed tomography image analysis
Images were reviewed by two radiologists, according to the consensual signs described in COVID-19 [7], and a final decision reached by consensus. Clinical history was available for interpretation.
Chest CT signs were analysed according to the Fleishner Society glossary [19]: ground glass-opacities (patchy, nodular or mixed), crazy paving (thickened intralobular and interlobular lines in a ground glass opacity), subpleural curvilinear bands, consolidation areas, air bubble sign, vascular dilatation, traction bronchiectasis, reticular interlobular thickening, pleural effusion, pleural thickening, number of involved lobes, inferior predominance, laterality, lung localisation (subpleural, central or dual distribution), compatible CT aspect of acute respiratory distress syndrom, compatible CT aspect of organizing pneumonia, compatible CT aspect of cardiac failure, lymphadenopathy, emphysematous lesions, bronchial thickening, endobronchial secretion, centrilobular nodule, and total affected lung volume (0%, < 10%, ≥ 10 – < 25%, ≥ 25 –< 50%, ≥ 50 – < 75%, ≥ 75%). The cut-off values for lung volume involvement were chosen in accordance with the recommendations of the French Society of Radiology [20].
Compatible CT aspect of organising pneumonia (OP) was defined as consolidation (nodular, linear, perilobular, or peribronchovascular), subpleural curvilinear bands, halo sign, and/or atoll sign [21]. Traction bronchiectasis was defined as bronchial dilatations, with irregular contours, cylindrical, tubular, or fusiform, focalised in the areas affected by the ground glass opacities (GGO), consolidation, or crazy paving [22].
Statistical analysis
Statistical analysis was performed with Matlab® R2007b (MathWorks Inc., Natick, USA). Qualitative variables were reported with number and percentage, and quantitative variables with mean and standard deviation.
In the included patients, we compared the frequency and extent of COVID-19 chest CT signs, between the deceased and survivor groups and between the IEV and non-IEV groups.
The followings chest CT signs and patterns were analysed: GGO, crazy paving, consolidation area, subpleural curvilinear bands, traction bronchiectasis, vascular dilatation, air bubble sign, interlobular thickening, total volume (50-100% vs. < 50%), compatible aspect of OP, compatible CT aspect of ARDS, distribution (subpleural, central, and dual – i.e. central and subpleural), inferior localisation, and number of involved lobes (0 to 3 vs. 4 or 5 involved lobes). For statistical analysis, the 50% total volume involvement cut-off and the number of involved lobes (< 4 vs. ≥ 4) were chosen based on a previous study by Yang et al., which found that these cut-offs were associated with the severity of the disease [16].
Association between chest CT signs and pejorative evolution in COVID-19 patients was evaluated using vs. tests when applicable (all theorical numbers superior to 5) and Fisher’s exact test otherwise. All test results with a p-value < 0.05 were considered statistically significant.
Results
Clinical and population characteristics
From March 19th to April 28th, 2020 a total of 109 patients with a positive RT-PCR were included in the study. Their clinical and demographic characteristics are shown in Table 1. Among them, 73 (67%) had severe symptoms (severe pneumonia or ARDS as described above), 28 (25.7%) had IEV, and 11 (10.1%) died. The mean time interval between the RT-PCR test and chest CT was inferior to 1.5 days. Patients generally had chest CT on the same day or on the day after hospitalisation and a mean of 6.2 days after the first symptoms. Table 2 presents the chest CT signs of the 109 COVID-19 patients who had a positive RT-PCR. Seven (6.4%) patients did not show COVID-19 CT signs (normal CT or incompatible CT signs).
Table 1
Clinical and demographic characteristics of the 109 patients included
[i] Qualitative values are indicated as number and percentages. Quantitative values are indicated as mean and standard deviation. Comorbidity corresponds to the following: age > 65 years, chronic respiratory disease, dialysis, cardiac insufficiency NYHA 3 or 4, history of cardiac diseases (arterial hypertension, coronaropathy, stroke, cardiac surgery), cirrhosis (≥ Child B), diabetes with complications or requiring insulin therapy, immunosupression (chemotherapy, biotherapy, immunosuppressive corticotherapy, uncontrolled HIV or CD4 < 200/mm3, metastatic cancer, all types of graft), BMI > 40, or pregnancy.
Table 2
Chest CT signs for the 109 positive COVID-19 patients
Computed tomography signs and pejorative evolution
The frequency of chest CT signs and the calculated p-values of the corresponding c2 tests can be found in Table 3 (comparing the need for IEV and no-IEV groups) and Table 4 (comparing the deceased and survivor groups).
Table 3
Association between chest CT signs and use of IEV in comparison with the non-IEV group, among positive COVID-19 RT-PCR patients
Table 4
Association between chest computed tomography signs and death in comparison with the surviving group, among positive COVID-19 RT-PCR patients
Traction bronchiectasis and total affected lung volume ≥ 50% were significatively associated with mortality (p = 0.018, and p < 10-3, respectively), and IEV (p < 10-3).
Vascular dilatation (p < 10-3), air bubble sign (p = 0.039), interlobular (p = 0.026) and peribronchovascular thickening (p = 6.10-3), and the number of involved lobes ≥ 4 (p < 10-3) were associated with the need for IEV.
Discussion
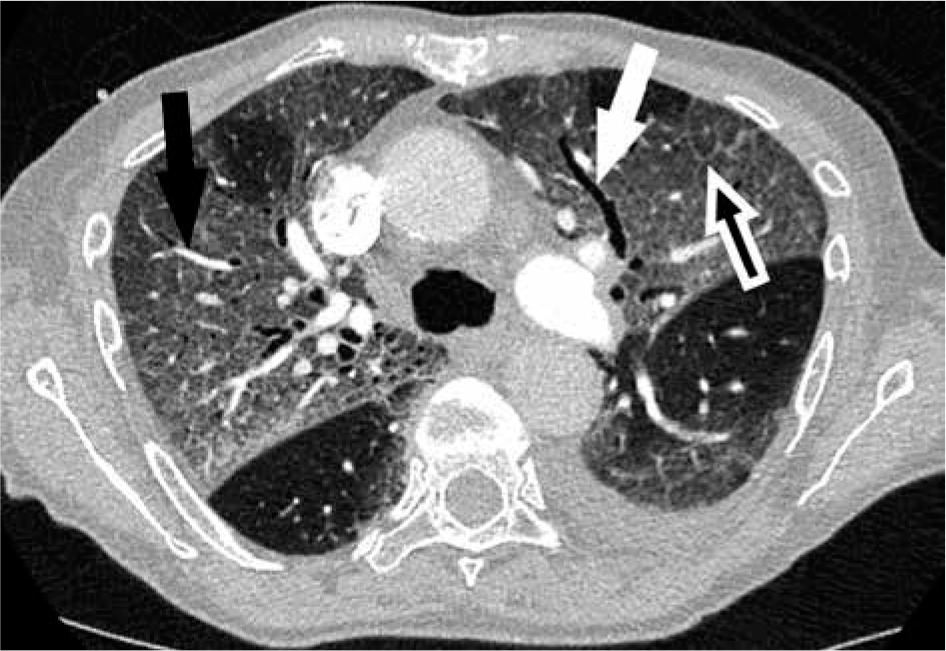
In our study, we found that traction bronchiectasis and total affected lung volume ≥ 50% (Figures 2 A, B and 3), were significantly associated with death, among positive RT-PCR COVID-19 patients. Also, vascular dilatation, traction bronchiectasis, and lesional expansion (total affected lung volume ≥ 50% or ≥ 4 affected lobes) were significantly associated with IEV. Semiological CT anomalies like traction bronchiectasis, vascular dilatation, and bubble sign are consistent with indirect signs of acute pulmonary fibrosis, and they could explain the rapid clinical deterioration of some patients. Indeed, vascular dilatation could be due to endothelial lesions with inflammatory vasodilatation or maybe to parenchymal retractions associated with fibrosis. The air bubble sign is more frequent in the IEV group and could correspond to a bronchioloalveolar dilatation due to fibrosing damage or a previous existing cyst revealed by the diffuse infection [22]. Our findings are consistent with those of a study that had a similar sample size, i.e. in 60 patients showed that at least four affected lobes was correlated with death in critically ill patients [23]. Feng et al. also demonstrated that more lung lobes were involved in the severe and critical groups than in the moderate group; their findings are also consistent with our study [24].
Figure 2
Chest computed tomography (CT) in positive reverse-transcription polymerase chain reaction COVID-19 cases. A) A 74-year-old man in intensive care unit hospitalisation (ICUH) with endotracheal ventilation, 11 days after first symptoms, massive traction bronchiectasis (white arrow) in the entire right lung, large areas of ground glass opacities (GGO) and subpleural consolidation, with ≥ 75% of total affected lung. Note a left anterior loculated pneumothorax and a left posterior pleural effusion drain. B) A 57-year-old man in ICUH, 13 days after first symptoms, dual distribution areas (subpleural and central) of GGO in the lingula and the right inferior lobe with traction bronchiectasis (black arrow) and vascular dilatation (white arrow), with 50-75% of total affected lung. C) A 67-year-old man in ICUH, 10 days after first symptoms, CT aspect of organised pneumonia (white arrow) with bilateral posterior subpleural curvilinear bands

Figure 3
Chest computed tomography of a 76-year-old man in intensive care unit hospitalisation, 10 days after first symptoms, bilateral, large, and patchy ground glass opacities with crazy paving (white underlined dark arrow), traction bronchiectasis (white arrow) and vascular dilatation (dark arrow), with 50-75% of total affected lung
We also observed patterns compatible with OP in more than 50% of patients (Figure 2 C). This concurs with a study by Copin et al. [25], which found an association between OP and fibrosis lesions in a pulmonary autopsy of a COVID-19 patient and described it as a specific histologic pattern of acute fibrinous and OP.
The significantly higher frequency of interlobular and peribronchovascular thickening in the IEV group could be due to alveolar interstitial oedema, similar to what can be observed in congestive heart failure, or due to the interstitial spreading of the inflammation [26]. However, unlike Zhao et al., lymphadenopathy and pleural effusion were not associated with a pejorative evolution in our cohort [15].
The frequency and type of chest CT signs are similar to previous studies except for consolidation and traction bronchiectasis, more prevalent in our study probably due to the clinical severity of our patients [13,22,27-29].
This study has some limitations. First of all, it was a retrospective study. Also, because only one CT scan was included per patient, no CT aspect evolution analysis could be performed; however, the rapidity of evolution of symptoms might be another predictive factor of pejorative evolution. Additionally, we decided to routinely review each COVID-19 scan collectively to maximise our diagnostic value for the patients; therefore, the interobserver agreement was not studied. Finally, it is possible that some signs are not associated with pejorative evolution because of the relatively small number of deaths in our cohort. All these points would be interesting to investigate in future studies.
Conclusions
Interestingly, the presence of traction bronchiectasis and focal vascular dilatations are associated with a pejorative evolution: pulmonary fibrosis lesions could play a part in the physiopathology of COVID-19 pneumonia. High values of affected lung volume were also associated with a pejorative evolution, which concurs with the current literature on the subject.