


Introduction
COVID-19 has been spreading rapidly throughout the world, affecting directly or indirectly almost every community, leading to the WHO declaring a pandemic on 11 March 2020 [1,2]. COVID-19 is a new disease caused by the SARS-CoV-2 virus and affecting mainly the human respiratory system [2]. This drip-transmitted coronavirus is present in human body fluids, such as nose and throat secretion, sputum, stool, tears, and blood. The time interval between the infection and the occurrence of symptoms is on average 5 days (range: 2-14 days). The disease is asymptomatic or mild in 80% of cases, with fever and cough being the most frequently reported symptoms. Other symptoms include headache, sore throat, fatigue, dyspnoea, muscle aches, taste disorders, chills, vomiting, weakness, and anorexia [3-6]. The basic reproduction number (R0) of SARS-CoV-2 ranges from 2 to 4 [5]. Most of the mild symptoms pass spontaneously, but in some cases various types of fatal complications occur, including organ failure, septic shock, pulmonary oedema, severe pneumonia, and acute respiratory failure (ARDS) [3]. In more severe forms, changes of the interstitial inflammation type occur in the lungs [4]. Severe or fatal cases are more common in the elderly and people with coexisting diseases [5].
Since the manifestation of infection in COVID-19 is highly unspecific, the diagnostic tests specific to this infection will be crucial due to the need for rapid confirmation of suspected cases, appropriate examination of patients, and disease surveillance [7]. According to the clinical recommendations, the basis for the diagnosis of SARS-CoV-2 infection are molecular methods detecting the genetic material of the virus (NAAT-nucleic acid amplification testing) [2,8-10]. The basic technique is reverse-transcription real-time polymerase chain reaction (rRT-PCR) [10]. Nucleic acid detection methods based on polymerase chain reaction (PCR) are characterized by fast detection, and high sensitivity and specificity – hence they are considered as the “gold standard” in virus detection [7].
The decision to test should be based on clinical data and epidemiological factors related to the assessment of the likelihood of infection [2]. Negative results in an infected person may be due to, among other things, poor sample quality (small amount of patient’s material), sampling too late or too early during the infection, inadequate sampling or storage, or technical reasons, such as virus mutation, or inhibition of the PCR reaction [8]. In contrast, positive results do not exclude bacterial infection or contamination with other viruses [7].
The materials recommended for diagnostics are nasopharyngeal swabs, swabs from the throat and nasal mucous membranes taken simultaneously, and swabs from the lower airways (sputum; only if the patient coughs it up uninduced), tracheal aspirates, or bronchoalveolar lavage (BAL) [10]. Both PCR and computed tomography (CT) do not have negative predictive values high enough to stop the isolation of suspected coronaviruses [6]. The value of imaging tests refers to those results that can be used to clinically establish a diagnosis or treat the patient. That value is diminished by negative aspects that include the risk of radiation exposure to the patient, risk of COVID-19 transmission to uninfected healthcare workers and other patients, consumption of PPE, and the need for cleaning and downtime of radiology rooms in resource-constrained environments [11].
Most countries do not include CT scan of the patient’s chest among the criteria for diagnosing COVID-19, indicating that the CT images obtained are non-specific and do not distinguish the disease from other pneumonias. A high-resolution CT [HRCT] scan is the recommended method [4]. An HRCT examination of the chest may be helpful in making a diagnosis and observation, and may reveal the presence of complications, such as ARDS (acute respiratory distress syndrome) and pleural effusion. A positive result of chest CT for COVID-19 has a sensitivity of 97% (using RT-PCR as a reference standard) and a specificity of about 25%. The CT image, despite its lack of specificity, together with a comprehensive clinical assessment, can be helpful in making an initial diagnosis of COVID-19. The final diagnosis needs to be confirmed in the RT-PCR test [4,6,10,12-14]. Only in exceptional cases, such as very long waiting time for the RT-PCR test result, suspected false negative RT-PCR result, or the occurrence of clinical symptoms suggesting COVID-19, may the clinician, together with a radiologist, consider an imaging test – assuming it would have an impact on patient management [4,13].
Other authors indicate that the combination of time-repeated RT-PCR tests with CT results may be useful or even necessary to confirm a COVID-19 diagnosis, when there is a serious clinical case for an initial negative RT-PCR result [11,15] or when COVID-19 detection tests are not available. Pointing to the delay in obtaining RT-PCR results, other scientists add that radiologists could assist in treating patients who report to hospitals during the pandemic, by identifying pulmonary symptoms of COVID-19 [16]. Many of the above-mentioned premises were present in the beginning of the COVID-19 pandemic.
In China, due to the dynamic nature of the infection, the coronavirus test was replaced by scans of the chest, and the features of ground glass opacities (GGO) and/or growing pneumonia became part of the official diagnostic criteria. The use of CT on such a scale was, to a large extent, due to the lack of RT-PCR sets, with a simultaneous, mass influx of patients [12,13]. However, the use of CT as the main diagnostic tool for COVID-19 (instead of RT-PCR) was later challenged. The fifth edition of “The programme for the diagnostics and treatment of new coronavirus-induced pneumonia (2019)” proposed by the National Health Commission of China includes the results of CT scans as a diagnostic criterion. However, in the next 2 editions (the sixth and seventh), this has been removed, reflecting the dynamic development of the pandemic situation [17].
Based on the collected and analysed clinical management guidelines, including diagnostic guidelines for COVID-19, the aim of this paper was to compare chest CT diagnostic test parameters with RT-PCR (reference) in the early diagnosis of COVID-19, after adoption of the specific criteria.
Material and methods
Research strategy
A systematic review of the scientific literature available at specialized databases (Medline, Embase, Cochrane Library) was performed to identify the primary studies comparing the sensitivity and specificity of the initial chest CT scan with the RT-PCR reference test in the early diagnosis of COVID-19. The review was conducted between 1 January 2020 and 9 September 2020, using the following keywords and logical operators: (coronavirus disease-19 OR SARS-CoV-2 OR COVID-19 OR COVID19 virus OR severe acute respiratory syndrome coronavirus 2 OR 2019 novel coronavirus disease) AND (tomography, X-ray computed OR CT OR computed tomography) AND (reverse transcriptase polymerase chain reaction OR RT-PCR OR RT-PCR).
Inclusion and exclusion criteria
The review included both full-text publications and abstracts on measurements of such parameters of the compared RT-PCR “gold standard” with CT diagnostic test as sensitivity and/or specificity. Study participants were patients presenting with symptoms indicative of pneumonia, such as fever, cough, other respiratory symptoms. All patients had COVID-19 infection confirmed with reference test RT-PCR, and in all patients a CT scan was performed as well. The time lapse between both tests could not be longer than 3 days.
Secondary studies and studies conducted in asymptomatic patients were not included in the review. Also, the cohort of patients in whom the tests were performed could not include less than 50 people, and studies on pregnant women and children were not included. In the case of CT scanning, studies performed using low-dose CT (LD CT) were excluded.
There were no language restrictions imposed.
Choice of studies
Titles, abstracts of retrieved articles and full articles were reviewed to meet the above criteria and the selection process was documented using the PRISMA (Preferred Reporting Items for Systematic Reviews and Meta-analyses) guidelines.
Data extraction
The search of studies was performed, and all potentially relevant publications were selected. The full text versions of papers were critically appraised according to the above listed inclusion and exclusion criteria. Data extraction was performed using a standard data extraction form. Information on country, number of patients, age, gender, time between onset of symptoms and diagnostic tests, diagnostic criteria, experience and number of CT interpreters, and type of CT apparatus were extracted from the included studies.
Assessing the quality of research
The methodological quality of each included study was assessed using the QUADAS (Quality Assessment of Diagnostic Accuracy Studies) tool [18].
The results obtained from separate studies were included in the meta-analysis. Based on the characteristics of the studies presented, the clinical heterogeneity was assessed, while the statistical heterogeneity was assessed using the I2 test. Meta-analysis was performed based on bivariate analysis [19].
In the meta-analysis, studies containing the following data needed for a contingency table were included: true positive (TP), true negative (TN), false positive (FP), and false negative (FN) values. The sensitivity and specificity were calculated from the above data using the 95% confidence interval. Summary receiver operating characteristics (SROC) curves were also prepared where possible to describe the relationship between test sensitivity and specificity. All analyses were performed using Meta-Disc 1.4 software.
Results
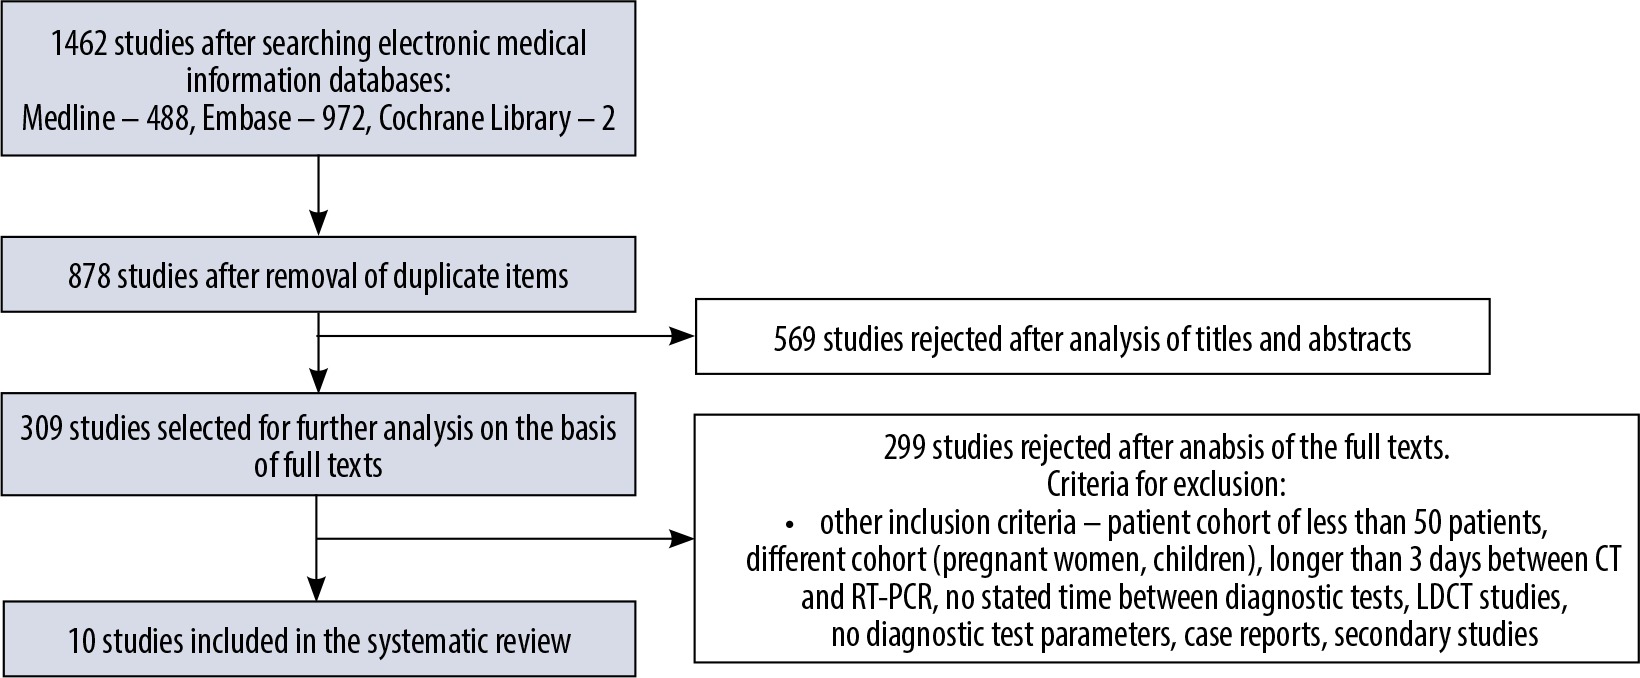
A database search yielded 1462 studies. After removing 1452 studies not meeting the inclusion criteria, 10 studies were eligible for analysis. The search scheme is shown in a PRISMA diagram (Figure 1).
Results of the study quality analysis and causes of systematic error
Detailed results of the quality assessment of the studies, performed with the use of the QUADAS tool, are included in Table 1. None of the included studies provides sufficient information, and none of the data provided is free of error in the selection of study participants. This may cause a spectrum bias at the outset of the study. None of the included studies is a randomised clinical trial. Only half of the included studies report analysing the results of the examined test without knowing the results of the reference test: Wen et al., He et al., Besutti et al., Gietema et al., and Kuzan [22,23,25,26,29]. In the studies of Long et al., Fang et al., Guillo et al., and Herpe et al. it was unclear [20,21,27,28], and in the study of Caruso et al. only the result of the reference test formed the basis for performing the examined test [24].
Table 1
Assessing the quality of research using the QUADAS tool [18]
| No. | Questions | First author [item number in References] | |||||||||
|---|---|---|---|---|---|---|---|---|---|---|---|
| Long [20] | Fang [21] | Wen [22] | He [23] | Caruso [24] | Besutti [25] | Gietema [26] | Guillo [27] | Herpe [28] | Kuzan [29] | ||
| 1. | Does the population included in the study match the population that will use the test in practice? | N | N | UNC | UNC | UNC | N | N | N | N | NJ |
| 2. | Are the patient inclusion/exclusion criteria clearly described? | Y | N | Y | Y | Y | Y | Y | Y | UNC | Y |
| 3. | Was the reference test used valid (sufficient to confirm or exclude the disease)? | Y | Y | Y | Y | Y | Y | Y | Y | Y | Y |
| 4. | Was the period between the study test and the reference test short enough to avoid a possible change in disease progression/severity? | Y | Y | Y | Y | Y | Y | Y | Y | Y | Y |
| 5. | Has the entire study population or a random sample from that population been tested with the reference test? | Y | Y | Y | Y | Y | Y | Y | Y | Y | Y |
| 6. | Did all patients undergo the same reference test, regardless of the results of the study test? | Y | Y | Y | Y | Y | Y | Y | Y | Y | Y |
| 7. | Was the reference test independent of (not a part of) the examined test? | Y | Y | Y | Y | Y | Y | Y | Y | Y | Y |
| 8. | Was performance of the test described in sufficient detail to allow repetition of the test? | Y | N | Y | Y | Y | Y | Y | Y | Y | Y |
| 9. | Was performance of the reference test described in sufficient detail to allow repetition of the test? | N | N | N | Y | N | Y | Y | N | Y | UNC |
| 10. | Was the test result interpreted independently of the reference test result? | UNC | UNC | Y | Y | N | Y | Y | UNC | UNC | Y |
| 11. | Were the results of the reference test interpreted without knowledge of the results of the examined test? | UNC | UNC | Y | Y | Y | Y | Y | UNC | UNC | UNC |
| 12. | Is the same clinical data available when interpreting the test results as would be available when the test is used in practice? | Y | Y | Y | Y | Y | Y | Y | Y | Y | Y |
| 13. | Have unclear / indirect test results been reported? | Y | N | Y | Y | Y | Y | Y | Y | UNC | Y |
| 14. | Have the reasons for exclusion/loss from the study been explained? | Y | N | Y | Y | Y | Y | Y | Y | Y | Y |
The results obtained indicate a high risk of information bias (prior knowledge of test results). The study by Fang et al. is of the worst quality. Most of the questions included in Table 1, containing results of the assessment of the quality of studies with use of the QUADAS tool, are not answered positively [21]. In the multicentre study described by Herpe et al. there are no transparently described portions of the data. In the study of Guillo et al. the obtained values of diagnostic parameters, such as sensitivity, specificity, or accuracy of the assessments performed by 2 radiologists interpreting the CT, the results differ between the abstract and the paper’s full text, which significantly affects the interpretation of the results (it is not clear which data are correct) [27,28].
Characteristics of the studies included in the systematic review
Four of the included studies were conducted in China, albeit in regions with different epidemiological situations, as highlighted in the Wen et al. study, which analysed the feasibility of using CT for early diagnosis in 2 centres located near the centre of the epidemic: the furthest and the closest to Wuhan [22]; and the He et al. study, which was conducted outside the epicentre of the epidemic [23]. In the Long et al. and Fang et al. studies, there are no precise data on the region of residence of the patients [20,21].
Of the 10 studies included in the review, 4 are prospective studies, led by Caruso et al., Besutti et al., Gietema et al., and the large multicentre study by Herpe et al. [24-26,28]. The remaining 6 studies are retrospective.
The smallest cohort of patients who underwent both chest CT scan and RT-PCR reference test was 51 [21] and the largest 4824 [28]; a total of 6528 patients were studied. The basic characteristics of the included studies are listed in Table 2. The studies are not homogeneous; the differences may be due to the selection of the population, the ways in which the reference test/test was performed, or the skills of the readers interpreting the imaging results.
Table 2
Baseline characteristics of studies eligible for the systematic review
| First author | Country | Time of collecting data | Study design | Sample size (n)/ Cases of COVID-19 Groups | Male/Female | Mean age (years) | Day symptom onset | Symptoms | Time interval between RT-PCR and CT | Sample | Radiologist (number, years of experience in chest CT imaging)] |
|---|---|---|---|---|---|---|---|---|---|---|---|
| Long [20] | China | 20.01.- 8.02.2020 | Retrospective | 87/36; Control (C) and COVID-19 group (D) | (C) 36/25 (D) 20/16 | (C) 47.1 ± 18.8 (D) 44.8 ± 18.2 | (C) 3.2 ± 1.6 (D) 2.6 ± 1.7 | Fever, COVID-19 pneumonia suspicion, exposure history | Initial presentation | No data | 2 (10; 15) |
| Fang [21] | China | 19.01.-4.02.2020 | Retrospective | 51/51 | 29/22 | 45 (39-55) | 3 days ± 3 | Fever, COVID-19 pneumonia suspicion, exposure and travel history | 3 days or less | Throat swab, sputum | No data |
| Wen [22] | China | 21.01.- 14.2.2020 | Retrospective | 103/88 | 48/55 | 46 (15); (12-98) | No data | Acute respiratory illness, exposure history | Within 3 days | Throat-swab, sputum, or alveolar lavage fluid specimens | 3 (8; 15) |
| He [23] | China | 10.01. – 28.02.2020 | Retrospective | 82/34 non – COVID-19 (nD) COVID-19 (D) | (nD) 32/16 [D] 17/17 | (nD) 37 (1-76) (D) 52 (8-74) | No data | Travel and exposure history, fever, dry cough | At the same time | Nasopharyngeal swab, oropharyngeal swab, endotracheal aspirate, bronchoalveolar lavage | 2 (17; 14) with specific training reviewed the CT images |
| Caruso [24] | Italy | 04.03.-19.03.2020 | Prospective | 158/62 | 83/75 | 57 ± 17 | No data | Fever, respiratory symptoms, exposure history, previously positive test result | After the RT-PCR swabs CT | Two nasopharyngeal and oropharyngeal swabs at an interval of 24 hours | 2 (15; 25) |
| Besutti [25] | Italy | 13.03-23.03.2020 | Prospective | 696; 423/454 highly suggestive CT, 97/127 suggestive CT, 31/115 non-suggestive CT (+)RT-PCR | 408/288 | 59 ± 15.8 | No data | Symptomatic patients with COVID-19 pneumonia | Within 3 days | Nasopharyngeal and oropharyngeal swabs | Radiologists |
| Gietema [26] | Netherlands | 13.03-23.03.2020 | Prospective | 193/83 | 113/80 | 66 [55-76] | 5 days medium | Symptomatic patients; respiratory symptoms | Upon arrival at the emergency department | Nasopharyngeal and/or oropharyngeal swab | 2 (senior resident; experienced chest radiologist) |
| Guillo [27] | France | 01.03.-28.03.2020 | Retrospective | 214/129 | 119/95 | 59 ± 19 | Median 7 days | Suspicion of COVID-19 pneumonia | Within 24 h | No data | 3 (radiology resident, senior radiologist experienced chest radiologist – 20 y) |
| Herpe [28] | France, | 02.03.-21.04.2020 | Prospective | 4824/2564 | 2669/2155 | 64 ± 19 | No data | Symptomatic patients, COVID-19 pneumonia, respiratory symptoms | Within 48 hours | Deep oropharyngel sampling | Many radiologists (different experience) |
| Kuzan [29] | Turkey | 17..03.-25.03.2020 | Retrospective | 120; laboratory confirmed [LC]: 69, clinically diagnosed COVID-19 (CD): 51 | (LC) 43/26 (CD) 24/27 | (LC) 50.9 ± 14.0 (CD) 50.9 ± 18.8 | No data | Respiratory symptoms, international travel history | At first admission; 1-3 days between tests | Combined swab, oropharynx and nasopharynx | 2 |
In the case of the Caruso et al. study, it is clearly emphasized that chest CT scanning was performed in patients with positive RT-PCR [24].
A study by Long et al. reports on a control group that included patients with pneumonia of other aetiologies (51 patients), which concluded that there were no statistically significant differences between patients with coronavirus pneumonia and controls in terms of gender, age, or time from onset of fever to medical consultation [20].
The study by Fang et al. is described in the least detail. It contains no information on exclusion criteria, loss of patients from the study, or how both the reference test and the imaging test were performed [21]. The studies reviewed provide information on the type of material collected from patients for RT-PCR analysis, which is important in terms of virus titre. In the study of Wen et al., throat tissue, sputum, or bronchoalveolar lavage fluid was collected, but the researchers did not report whether the way the material (containing different virus titres) that was collected for testing could have influenced the results [22]. The studies by Long et al. and Guillo et al. do not provide any data on the swab taken for the RT-PCR test [20,27] whereas in the study by Fang et al. in almost 90% of the cases the patients were swabbed from the throat, while in the remaining cases sputum was the source of coronavirus genetic material [21]. In other studies, patients were sampled from the oral cavity and pharynx and/or nasopharynx [24-26,28,29].
The researchers described how the chest CT scans of the patients were performed. However, in 3 studies the number of radiologists interpreting the chest CT scans, as well as their professional experience, were not addressed: Fang et al., Besutti et al., and Kuzan et al. [21,25,29]. The blinding of the study, i.e. whether the persons interpreting the CT scan had knowledge/suggestion of the possible outcome (confirmation of coronavirus infection), was also not clearly reported in all studies [21,23,27,28]. In the Caruso et al. study, the radiologists may have had knowledge of the RT-PCR test result [24]. However, in the study by He et al., additionally trained radiologists without knowledge of the RT-PCR test result had information on epidemiological history and clinical symptoms [23]. In a multicentre, nationwide French study by Herpe et al., radiologists at different centres interpreting patients’ obtained chest CT scans were blinded to the results of the RT-PCR test but were aware of suspected SARS-CoV-2 infection [28].
Data on diagnostic test parameters of the chest CT scan are shown in Table 3. All parameters were estimated with 95% CI.
Table 3
Computed tomography diagnostic test parameters in the acquired studies
| No. | Study | Parameters | ||||
|---|---|---|---|---|---|---|
| Sensitivity (%) (95% CI) | Specificity (%) (95% C) | PPV (%) (95% CI) | NPV (%) (95% C) | Accuracy (%) | ||
| 1. | Bessutti [25] Two levels of CT-based probability of COVID-19 pneumonia: Highly suggestive CT findings Highly suggestive + suggestive CT findings | 76.77 (73.0-80.2) 94.37 (92.1-96.1) | 78.62 (71.0-85.0) 57.93 (49.5-66.1) | 93.17 (90.4-95.3) 89.50 (86.7-91.9) | 47.11 (40.7–53.6) 73.04 (64.0–80.9) | No data |
| 2. | Gietema et al. [26] | 89.2 (80.4-94.9) | 68.2 (58.6-76.7) | 67.9 (61.4-73.7) | 89.3 (81.6–94.0) | No data |
| 3. | Guillo et al. [27] radiology resident (initial) body of the study abstract experienced chest radiologist body of the study abstract Note – different results in the body of the study and in the abstract | 79 (71-86) 79 (71-86) 72 (63-81) 81 (74-88) | 81 (74-88) 84 (74-91) 76 (67-84) 91 (82-96) | 91 (82-96) 88 (81–93) 93 (87-97) 93 (87-97) | 84 (74–91) 72 (63–81) 88 (81–93) 76 (67–84) | No data |
| 4. | Herpe et al. [28] | 90 (89-91) (2319/2564) | 91 (91-92) (2056/2260) | 92 (91-93) (2319/2524) | 89 (87-90) (2056/2300) | 90 (90-91) |
| 5. | Kuzan et al. [29] | 94.2 ( 85.8–98.4) | 21.57 (11.3–35.3) | 61.90 (58.2–65.5) | 73.3 (48.2–89.1) | 63.3 (54.1–71.9) |
| 6. | Long et al. [20] | 97.2 | No data | No data | No data | No data |
| 7. | Fang et al. [21] | 98 (90-100) | No data | No data | No data | No data |
| 8. | He et al. [23] | 77 (62-91) | 96 (90-100) | No data | No data | 88 (88) |
| 9. | Caruso et al. [24] | 97 (88-99) | 56 (45-66) | 59 (53-64) | 96 (87-99) | 72 (64-78) |
| 10. | Wen et al. [22] | 93 (85-97) | 53 (27-77) | 92 (83-96) | 42 (18-70) | No data |
The studies by Long et al. and Fang et al. refer to only one parameter: sensitivity, and both obtained values indicate a higher sensitivity of the CT test (97.2% and 98%) compared to the RT-PCR reference test (83.3% and 71%, respectively) [21,23]. In the study by He et al., there are no statistically significant differences between sensitivity for CT (77%; 62-91) and RT-PCR (79%; 66-93%) and for test specificity – CT (96%; 90-100%) vs. RT-PCR (100%) [23]. In contrast, a study by Wen et al. investigated whether different location from the epicentre of the pandemic (Wuhan, China) significantly affects the results, but found no statistically significant differences [22]. The study also performed consecutive RT-PCR tests in the case of a first negative result and found that the sensitivity of the first RT-PCR test was only about 42% but increased to 75% when the test was repeated; in contrast, we have a sensitivity of 93%; 85-97% with a specificity of 53%; 27-77% with a CT scan [22].
Only 3 studies have estimated the accuracy of CT, which ranged from more than 60% to 90% [25,28,29]. In contrast, it is difficult to analyse the data in the Guillo et al. study because of the different values included in the abstract and the body of the article regarding diagnostic test parameters. The researchers analysed the effect of radiologists’ experience on the results obtained, and, according to the abstract, better parameters were obtained by a radiology resident than by an experienced radiologist – an expert in chest examinations [27]. The other investigators also estimated PPV and NPV to determine the feasibility of using chest CT as a screening test.
A quantitative analysis (meta-analysis) for thoracic CT scans, on the other hand, could only arise from 5 consecutive studies included in the review, in which measures of TP, TN, FP, and FN were reported [23,24,26,28,29]. Data from the study by Besutti et al. were not included in the meta-analysis due to the lack of a single criterion to qualify patients with or without COVID-19 (CT findings judged by a radiologist to be highly suggestive of COVID-19, as suggestive and not indicative of COVID-19) [25]. In the remaining included studies, the outcome was clear: COVID-19 positive or negative. Sensitivity analysis was applied to determine the heterogeneity of the included studies. The data required to prepare the meta-analysis are included in Table 4.
Table 4
Measures of diagnostic tests from studies included in the meta-analysis
The meta-analysis for the RT-PCR assay could only be finalized based on 2 studies: He et al. and Herpe et al. due to lack of primary data in the other publications [23,28].
The results of the meta-analysis are presented below as forest plots charts, separately for sensitivity and specificity of chest CT (Figure 2).

Also presented below is also the SROC curve, which allows for a combined estimation of the sensitivity and specificity of the tests (Figure 3). The area under the curve (AUC) is 0.96, which would indicate great potential for the use of CT, but in this case the value obtained should be approached with caution due to the high statistical heterogeneity of the tests: I2 = 82.8. The diagnostic value of the OR is 47.29.

Due to the high heterogeneity of the studies (I2 = 98.3%), a sensitivity analysis was carried out by excluding at the beginning a study that could significantly affect the obtained result of the analysis. The results are presented in Figure 4.
Figure 4
Forest plots of pooled sensitivity of (A) chest CT and pooled specificity of (B) chest CT after analysis of sensitivity [1]

After excluding the study by Kuzan et al., which had the lowest specificity value, only a slight improvement in specificity was obtained (from 0.87 to 0.89), while maintaining the same sensitivity (0.91). In both cases, we also have a parameter I2 below 50%, which indicates a high homogeneity of the studies (I2 = 24.1%, I2 = 26.4%) In turn, as regards the specificity of the studies analysed, most of them are characterised by large values of standard deviation (the ranges do not overlap), although their distributions are symmetrical. The I2 value after exclusion of the study with the highest heterogeneity (mean and standard deviation values did not coincide with those of the other studies) above 90% (I = 98.3; I2 = 97.3) demonstrates the high statistical heterogeneity of the included studies in terms of specificity estimation.
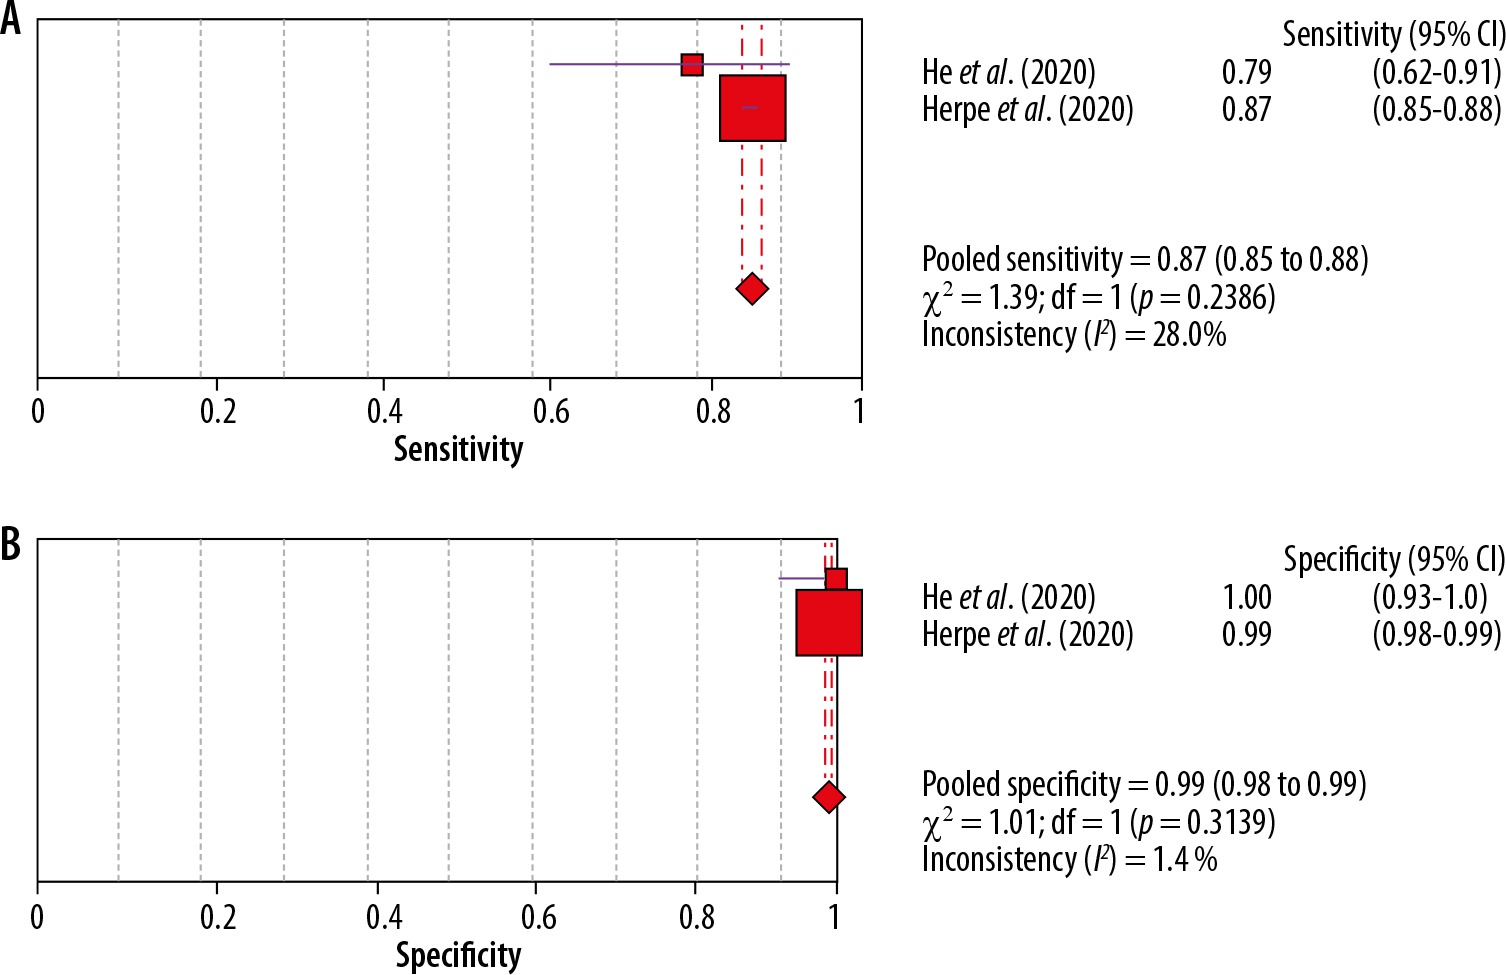
Further sensitivity analysis showed that the remaining studies are also characterised by high heterogeneity, and therefore only 2 studies, presented in Figure 5, are included in the final analysis.
Figure 5
Forest plots of pooled sensitivity of (A) chest CT and pooled specificity of (B) chest CT after analysis of sensitivity [2]
With this selection of studies, we obtain similar results for sensitivity and specificity; the studies are homogeneous.
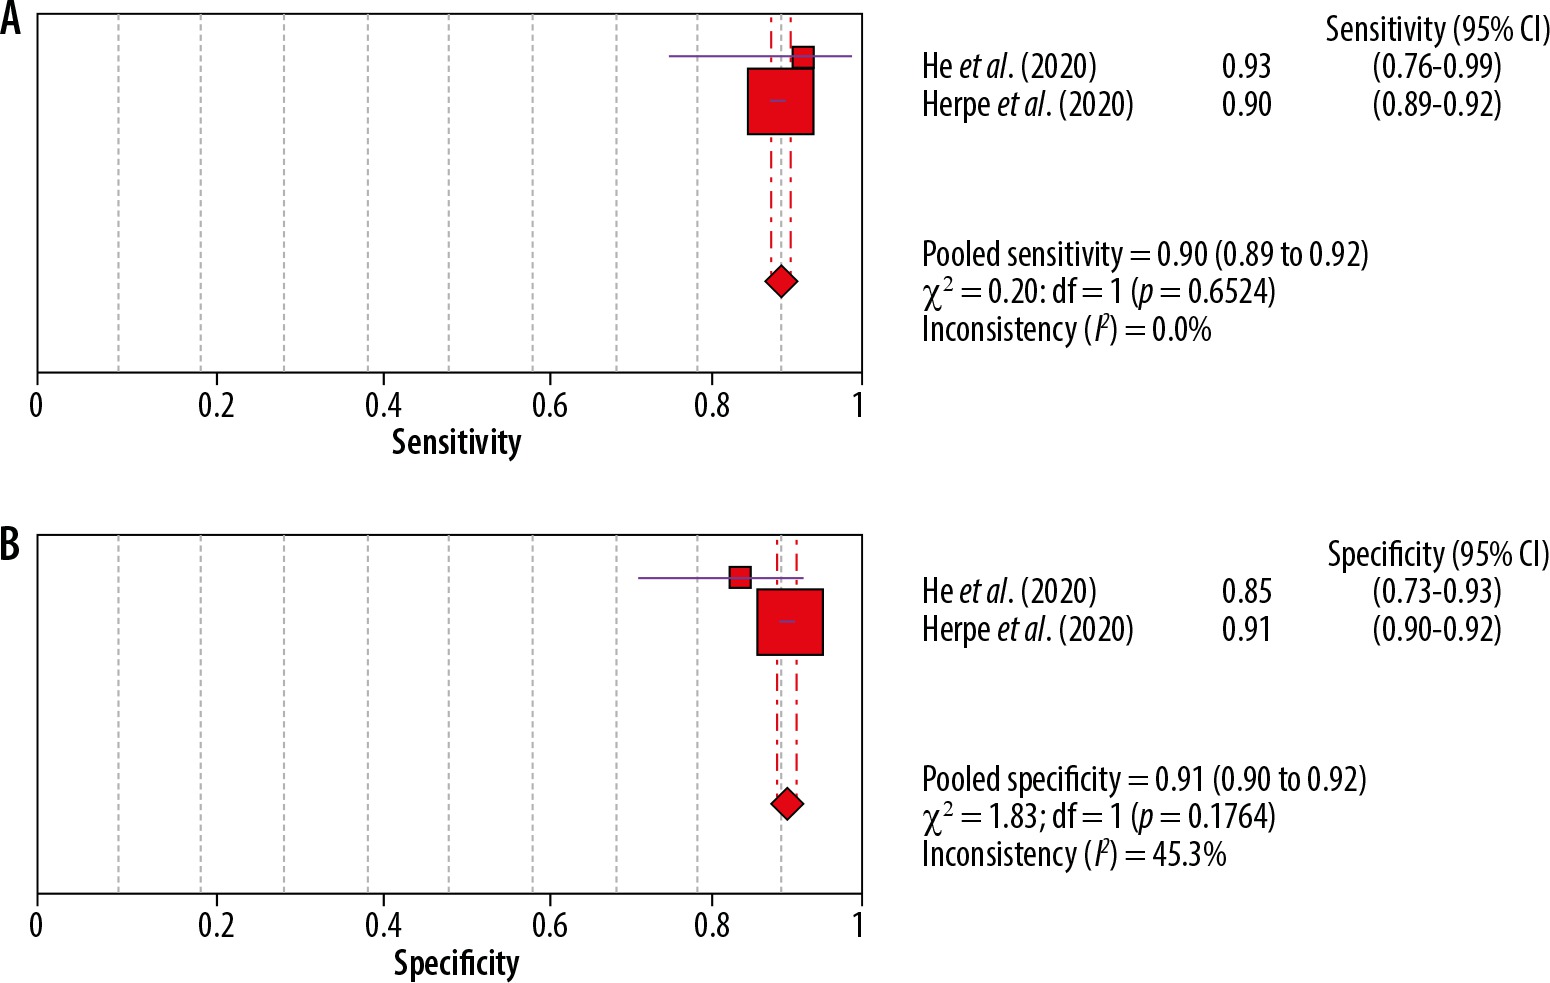
A meta-analysis was also performed for the RT-PCR assay, and forest plots were prepared separately for sensitivity and specificity of the included studies. Due to the analysis of only 2 studies, it was not possible to prepare the SROC curve. The results are presented in Figure 6.
For the RT-PCR test, the specificity is very high, with a mean value of 0.99, the included tests are homogeneous (I2 = 1.4%), while the sensitivity is lower (0.87; I2 =28%). The diagnostic OR value is 604.78%.
Discussion
The sensitivity of the CT studies included in the systematic review ranges from 72% to 98% and the specificity from approximately 22% to 96%, with the included studies being statistically homogeneous for sensitivity estimates and statistically heterogeneous for specificity. The results of the meta-analysis, on the other hand, indicate that the sensitivity of the RT-PCR reference test is lower (87%) than its specificity (99%), while the chest CT scan of patients achieved a sensitivity of 91% with a specificity of 87% (95% CI). However, it should be noted in this case that the studies included in the meta-analysis indicate strong heterogeneity. The sensitivity analysis showed an increase in the specificity of the chest CT scan (up to 91%) but, of course, at the expense of sensitivity (90%). In this analysis, the results of a large multicentre (26 hospitals) study were included, in which sensitivities of 90% and specificities of 91% were obtained. The results were not influenced by the location of the centres in regions of different severity of the epidemic.
The results obtained in terms of sensitivity are similar to other available literature data [30-33]. A meta-analysis by Kim et al. (2020) showed that the pooled sensitivity was 94% for chest CT and 89% for RT-PCR. In contrast, the overall specificity was lower than in our study, at 37% for chest CT [30].
The inclusion criteria for the meta-analysis of Kim et al. were less restrictive than in our analysis. The main differences included the minimal cohort of patients studied (5 patients), including asymptomatic patients, into the study, as well as the lack of a specific time between the reference and study tests performed [30]. A total of 68 studies were included in the analysis, but the researchers queried scientific publication databases for the sensitivity and/or specificity of CT scanning, RT-PCR reference test, or both diagnostic tests whereas our analysis only includes studies in which patients had both reference and the imaging test used in the specified interval between them.
Other available systematic reviews with meta-analyses also did not refer to the elapsed time between the reference and study tests, although Adams et al. highlighted that the 6 studies included in the analyses embraced only patients with confirmed SARS-CoV-2 virus presence in the RT-PCR test, and not all studies included symptomatic patients. The pooled estimates were 94.6% for sensitivity, while 46.0% for specificity with specificity [31].
In contrast, a systematic review with meta-analysis of the parameters of various diagnostic tests by Böger et al. yielded a CT sensitivity of 91.9% with a low specificity of 25.1% [32].
Duarte et al., preparing a systematic review with meta-analysis, evaluated diagnostic test parameters during the first week of symptoms. The researchers obtained 81.4% sensitivity and 100% specificity for the RT-PCR test, while the chest CT scan had a sensitivity of 95.3% and specificity of 43.8% [33].
Waller et al. conducted a systematic review of studies relating to the diagnostic capabilities of chest CT of patients to evaluate them for high or low risk of error to verify the true sensitivity of this method. The researchers focused on only one parameter of the test, namely sensitivity, considering this to be the main advantage of CT scanning. The QUADAS-2 tool was used to assess the quality of the studies, and the exclusion criteria included the absence of information considered relevant to stratify the studies for risk of error (for example, absence of information on symptomatic/asymptomatic patients, absence of information on the source of the sample for the reference test). After stratifying the studies, Waller et al. concluded that the difference in sensitivity of CT versus RT-PCR was less than previously assumed, and that the true sensitivity of CT based on non-risk-assessed studies was limited [34].
In our analysis, the aim was to estimate the value of diagnostic test parameters (sensitivity, specificity) of CT scanning for its applicability in the early diagnosis of COVID-19. The gold standard is still the RT-PCR test, although it should be taken into account that both diagnostic methods differ in the way they detect the disease. In the case of CT scans of the chest of patients, we can detect the pneumonia associated with COVID-19 disease, and RT-PCR testing based on molecular methods can detect the presence of genetic material from the SARS-CoV-2 virus, which causes COVID-19 disease. This fundamental difference meant that very restrictive inclusion and exclusion criteria for studies in the systematic review had to be taken into account during the study selection stage. In addition, an assessment of the quality of the research using the QUADAS tool was also carried out, and the results obtained after discussion influenced the subsequent analysis.
Only the symptomatic patients suspected of having COVID-19-associated pneumonia were included in our study. However, it was not possible to estimate the effect of the elapsed time between the first symptoms and the execution of diagnostic tests, due to the lack of relevant information in the primary studies, which can be considered as a limitation of our analysis. Moreover, some of the included studies did not contain information about medications used and underlying diseases, which could influence the quality of imaging and laboratory tests.
Regarding the time period between performing both diagnostic tests, we assumed a maximum of 3 days between the RT-PCT reference test and the patients’ chest CT test, to avoid the impact of disease progression on the diagnostic test results – see also studies of Pan et al. and Bernheim et al. [35,36].
Furthermore, we know that virus titre varies depending on the place and time of sampling. According to the WHO, the optimal sample depends on the clinical picture and the elapsed time since the onset of symptoms. Upper respiratory tract samples are suitable for early-stage infections, especially in asymptomatic or mild cases. Testing of combined nasopharyngeal and oropharyngeal swabs from a single individual has been shown to increase the sensitivity of detection of respiratory viruses and improve the reliability of results. Lower respiratory tract specimens are recommended in the later course of COVID-19 disease or in patients with negative upper respiratory tract samples and a strong clinical suspicion of COVID-19 [37].
Winichakoon et al. and Li et al. showed that nasopharyngeal/oral and pharyngeal swabs can give false-negative results [38,39], which may be due to the sampling technique, mode of transport, or the way the genetic material is detected, among other reasons, but it may also be due to the specificity of the coronavirus [38].
Böger et al. and Yang et al. showed that the highest sensitivity was achieved in the RT-PCR test performed from sputum [32,40]. Patel et al. and Wang et al., comparing nasopharyngeal swabs with oral and pharyngeal swabs taken 7 days or more after onset of disease symptoms, found that nasopharyngeal swabs could more accurately detect genetic material of SARS CoV-2 virus [41,42].
In the studies included in the analysis, only He et al. and Wen et al. used samples from the upper and lower respiratory tract, but in these studies we do not know the elapsed time between symptoms and collection of biological material or the exact information about the material collected (from how many patients, for which RT-PCR test – initial or repeat, etc.)] [22,23]. In the case of the He et al. (2020) study [23], the sensitivity and specificity results for RT-PCR and CT assay estimated with 95% CI were not statistically significantly different, which could suggest that the viral titre was higher in different biological material and influenced the results, but the investigators themselves do not refer to this in the study.
After the analysis, it can be estimated that the sensitivity of the CT scan is statistically significantly higher than that of the reference test, but it should not be forgotten that the value of this parameter is influenced by many factors, such as the blinding of the test, the experience of the radiologists interpreting the results, and finally the type of apparatus used to perform the CT scans. In some of the included studies, it was not clear whether the study was blinded correctly, and even if the radiologists did not know the results of the RT-PCR test, they were aware of the laboratory results or whether they were aware of the high risk of exposure of the subjects to coronavirus, which may have resulted in subjective interpretation of the CT image results obtained.
The specificity of the test is still an issue. According to the UK recommendations, the diagnosis of COVID-19 pneumonia can be assessed from CT images [14]. On the other hand, Simpson et al. [43], referring to literature sources, indicate that the frequency of changes (typical COVID-19 symptoms) seen on pulmonary images often depends on the time when the patient undergoes the CT scan. Slightly more patients have a negative CT scan when performed 2 days after symptom onset; GGO typically develops 0-4 days after symptom onset with a maximum of 6-13 days [43]. Jiang et al. showed that the early symptoms of the disease comprised mainly GGO, which means acute tissue damage. With the development of the disease, GGO could be enlarged and partially adhered, and a few lesions could also be directly absorbed; with further development of the disease, GGO gradually decreased, consolidation lesions gradually increased, and there was also an uneven increase in the density of most lesions [44]. Also, Bernheim et al. [36] assessed that some characteristic features of coronavirus on chest CT imaging are related to the course of infection over time. As the time from symptom onset to initial chest CT scan increases, some changes are seen more frequently on CT scans, including consolidation, bilateral and peripheral lung disease, greater total lung involvement, linear opacities, and the appearance of a crazed cobblestone and inverted halo [36].
In the analysed studies, not all investigators reported the presenting symptoms visible on the lung CT image, based on which the sensitivity and specificity of the CT examination was assessed. Also, not all investigators made an unambiguous assessment of whether the patient had COVID-19 pneumonia or whether the CT scan was negative; for example, Besutti et al. [25]. On the other hand, Kuzan et al. indicated that radiologists based their assessment of CT images using the UK recommendations by finally classifying chest CT into 2 subgroups: laboratory-confirmed COVID-19 (with RT-PCT positive) and clinical COVID-19 (RT-PCR negative). This study had the lowest specificity (21.57%) [29]. Most investigators did not indicate in their study how they assessed lung stage involvement – quantitative, semi-quantitative, or qualitative, and this may be important when assessing lung involvement to determine the correct diagnosis.
The overall specificity of the CT scan in our analysis was higher than in the literature data [31-34]. As for specificity, the RT-PCR reference test has better values compared to imaging tests. The problem is to make a clear diagnosis, indicating which type of viral pneumonia radiologists are dealing with. Cheng et al. indicated that SARS or MERS viruses have similar symptoms to SARS-COV-2; this (i.e. unilateral or bilateral GGO or consolidation) on radiography at COVID-19 presentation shows a wider range of GGO than consolidation, which is associated with clinical symptoms. In contrast, pneumonia caused by chickenpox-herpes virus is accompanied by pulmonary nodules with surrounding halo or patchy GGO in both lungs. Furthermore, in influenza A virus infection there are multiple areas of consolidation and diffuse GGO, which is similar in COVID-19 images of pneumonia [45]. Chen et al. found that COVID-19 may have a subpleural distribution, probably due to target cells located in the lower airways [46].
We believe that the association of the lung imaging changes occurring in COVID-19 with the time elapsed from symptom onset to testing is crucial. It is important to take a detailed history when the patient is admitted to the hospital/ER so that, taking into account the time elapsed between the onset of symptoms and the diagnostic test (CT, RT-PCR), it is possible to assess and determine what influenced the results obtained due to the time varying lung pattern in COVID-19-associated pneumonia and the different virus titres in the upper/lower airways.
However, it should not be forgotten that CT scanning is an examination that uses ionising radiation, and, although the radiation doses used during the examination are low, care should be taken when using CT scanning in pregnant women and children. Such preconceptions eliminating studies referring to CT scanning in this group were made when the inclusion and exclusion criteria were selected.
Referring to the results obtained, it should be taken into account that the studies included in the analysis are mostly based on small groups of patients; there is also a question of sample selection, which affects the obtained results, and the quality of the studies itself varies.
Based on the analysis of publications and other literature data, an additional conclusion can be drawn relating to specificity. When artificial intelligence is incorporated into the analysis of CT scans, it has been noted that there is an improvement in diagnostic performance and elimination of subjective error in the analysis of the scan by the radiologist interpreting the result. The artificial intelligence (AI) deep learning image analysis system being developed was able to generate classification points and detect suspicious chest CT findings in COVID-19, distinguishing COVID-19 from community-acquired pneumonia (CAP) and other lung diseases, but we still have insufficient data [47]. For example, Warman et al. presented an interpretable artificial intelligence CT analysis tool to diagnose COVID-19 in both symptomatic and asymptomatic patients. Their model was able to differentiate COVID-19 GGOs from similar pathologies, suggesting that GGOs can be disease-specific [48]. Wu et al. said the advanced AI-based algorithms can discriminate COVID-19 from other pneumonia by learning not only these typical CT image signs, but also some high-dimensional features, such as texture, wavelet information, etc., which are unable to be processed by radiologists [49]. Zhang et al. confirmed the earlier study that the dorsal segment of the right lower lobe was the favoured site of COVID-19 pneumonia [50]. One drawback is that many current AI studies for segmentation and diagnosis are based on small samples, which may lead to the overfitting of results. To make the results clinically useful, the quality and number of data need to be further improved [51], and an AI system derived from heterogeneous multinational training data delivers acceptable performance metrics for the classification of chest CT for COVID-19 infection [52].
Conclusions
Based on the performed analysis, no clear conclusion can be drawn on the possibility of using CT scanning in the early diagnosis of COVID-19 (when specific clinical symptoms and the epidemiological history indicate coronavirus infection). The sensitivity of the CT test seems to be higher than that of the RT-PCR test, but this may be related to the way and type of material analysed in genetic tests. However, the specificity of the CT test in our analysis was better than in previous literature data, which may lead us to consider including the CT test in the COVID-19 diagnostic guidelines, but under strict conditions. CT scanning could be performed in symptomatic patients, with a defined time interval from symptom onset to CT or RT-PCR. CT scanning should be explicitly included as an additional procedure when initial coronavirus genetic test results are negative and clinical symptoms and epidemiological history indicate possible infection, although a reference test showing the presence of coronavirus genetic material is essential throughout the diagnostic and treatment process. It is also important that subsequent investigators take into account the time of collection and type of material from which the coronavirus genetic material was obtained when referring to the reference test parameters, because this may be one of the factors influencing the reference test parameter values obtained.