


Introduction
Coronavirus disease 2019 (COVID-19) is an acute infec-tious disease caused by the severe acute respiratory syndrome coronavirus 2 (SARS-CoV-2) [1]. COVID-19 pneumonia refers to rapidly spreading acute respiratory syndrome [2]. COVID-19 shows variable clinical presentation, ranging from asymptomatic carriers to patients requiring assisted ventilation and intensive care unit (ICU) admissions with increased mortality [3]. The standard diagnosis of COVID-19 is made by using a reverse trans-cription-polymerase chain reaction (RT-PCR) assay, with reported sensitivities ranging from 42% to 83%, depending on symptom duration, viral load, and sample quality [4-8].
Imaging findings of COVID-19 pneumonia were first published in January 2020 and include bilateral lung involvement and ground glass opacities in the majority of patients [9]. Modest scientific evidence has demonstrated significant and constantly evolving value of computed tomography (CT) of the chest in the diagnosis and prognostication of COVID-19 pneumonia. However, substantial differences of opinion exist as to when and how chest CT should be used for clinical work-up or treatment decisions [10]. According to the Fleischner Society, imaging – particularly computed scanning – is a major tool if symptoms worsen or in an environment that is resource-constrained for RT-PCR [11]. Chest CT has 97% sensitivity in the diagnosis of COVID-19 pneumonia after a mean interval of 5 days [12]. Classical chest CT findings in COVID-19 pneumonia include ground glass opacities with bilateral, peripheral, and basal predominance with or without consolidation [13]. Central upper lobe predominance, masses, nodules, cavitations, lymphadenopathy, and pleural effusion are atypical findings observed on CT [14]. The COVID-19 Reporting and Data System (CO-RADS) provides a reporting format for the level of suspicion for pulmonary involvement of COVID-19 in non-contrast chest CT [10]. CT is also used to assess the severity of lung inflammation and involvement using quantitative and semi-quantitative parameters that evaluate the chest CT severity score (CT-SS) and provide an objective approach to easily and rapidly identify patients in need of hospital admission [15].
Numerous vaccines have been developed against SARS-CoV-2, with some of them being in clinical trials and some vaccines reporting more than 90% efficacy against COVID-19 in clinical trials. In India, 2 vaccines are currently being used to inoculate the population to prevent COVID-19, with Covishield being more commonly used than Covaxin. The vaccine is currently being administered as a 2-dose vaccine, with the second dose being administered at an interval of 6-8 weeks. The reported vaccine efficacy for AstraZeneca vaccine (combining dose groups) against the primary endpoint of COVID-19 occurring more than 14 days after the second dose is 70.4% [16]. However no or very limited literature is available regarding the severity of lung involvement in fully vaccinated (2 doses of Covishield vaccine) individuals positive for COVID-19. The purpose of the current study is to compare the severity of CT COVID-19 pneumonia in RT-PCR positive vaccinated and non-vaccinated individuals in the Indian population.
Material and methods
Patients and groups
This analytical cross-sectional study was carried out in the Department of Radio-Diagnosis and Imaging from March 2021 to April 2021. Forty non-vaccinated and 40 fully vaccinated (received both doses of Covishield) RT-PCR-positive COVID-19 patients who underwent chest CT formed the material of the study. Inclusion criteria included the following: a) COVID-19 RT-PCR-positive individuals above 45 years and less than 80 years of age. b) second dose of Covishield vaccine received at least 1 week before a positive RT-PCR test. Exclusion criteria included the following: a) patients on immunosuppressant therapy, b) markedly breathless patients who could not undergo CT due to lack of breath-hold, c) patients with pulmonary oedema and interstitial lung disease, d) vaccinated population less than 45 years of age (healthcare and frontline workers), and e) any pre-existing lung disease. Approval from the institutional ethics committee was obtained before conducting the study.
Chest computed tomography scan
Chest CT imaging was performed between 4th and 12th day of illness using multi-detector CT scanner (Siemens Somatom Sensation 64-slice scanner and Siemens Somatom Definition Flash 256 slice scanner). All the patients were examined in the supine position, and CT scans were acquired during a single inspiratory breath-hold. The scan was performed from the lung apex to the costophrenic angles. The CT acquisition parameters included: X-ray tube voltage 120 kVp and current 150 mAs; rotation time 0.5 seconds; pitch 1.0; section thickness 5 mm; intersection space 5 mm; additional reconstruction with a sharp convolution kernel; and a slice thickness of 1.0 mm.
Chest CT-SS assessment
The pulmonary involvement was assessed using a semiquantitative scoring system to quantitatively estimate the pulmonary involvement. The CT-SS was calculated on the basis of the extent of lobar involvement [15]. Involvement of the lung lobes was visually calculated on a scale of 0-5, with 0 indicating no involvement, 1 indicating < 5% involvement, 2 indicating 5-25% involvement, 3 indicating 26-49% involvement, 4 indicating 50-75% involvement, and 5 indicating > 75% involvement (Table 1) [16]. The total severity score was the calculated as sum of the individual lobar scores, ranging from 0 (no involvement) to 25 (maximum involvement) [17,18] and classified as mild (score 7 or less), moderate (8-17), and severe (18 or more) [19]. All CT images were reviewed by 3 radiologists with more than 10 years of experience in a standard diagnostic system workstation. In case of any discrepancy in scoring, the findings of the most senior radiologist were accepted. All thin-section CT images were reviewed at a window width and level of 1000 to 2000 HU and –700 to –500 HU, respectively, for lung parenchyma.
Results
Total of 80 nasopharyngeal swab RT-PCR-positive patients for COVID-19 formed the material of our study patients, including 40 patients each in vaccinated and non-vaccinated groups. Fever (91.3%) and cough (83.8%) were the commonest presenting symptoms in all patients followed by dyspnoea (68.8%) and fatigue (47.5%). The majority of patients in our study were males with a M : F ratio of 1.4 : 1.
CT chest was normal in 6 cases (5 cases in the vaccinated group and 1 case in the non-vaccinated group), while positive scans were observed in 74 patients. Ground glass opacities (GGO) (Figure 1A) were the most common patterns of disease (97.3%) followed by crazy-paving (Figure 1B) (60.8%) and parenchymal consolidations (Figure 2A) (39.2%) (Table 2). Other less common CT findings included fibrosis (33.8%) and subpleural lines (Figure 2B) (29.7%). The extent of lobar involvement, lesion distribution, and disease localization in both the lung parenchyma were observed, and CT-SS was calculated for both the groups.
Figure 1
A) Axial computed tomography (CT) (non-contrast) section of chest (lung window) showing multifocal areas of ground glass opacities in peripheral and subpleural distribution. B) Axial CT (non-contrast) section of chest (lung window) showing areas of crazy-paving in visualised lung parenchyma
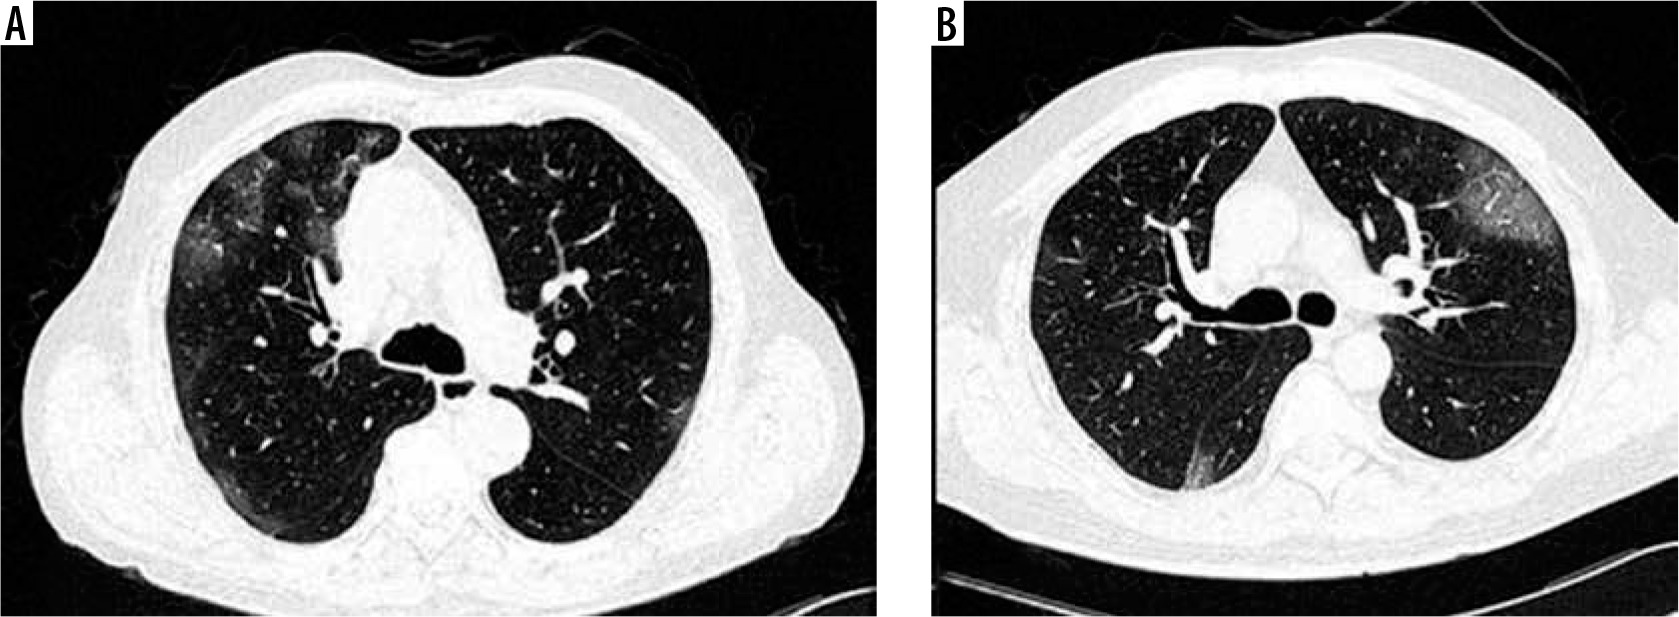
Figure 2
A) Axial computed tomography (CT) (non-contrast) section of chest (lung window) showing multifocal areas of consolidations in peripheral and subpleural distribution. B) Axial CT (non-contrast) section of chest (lung window) showing subpleural bands
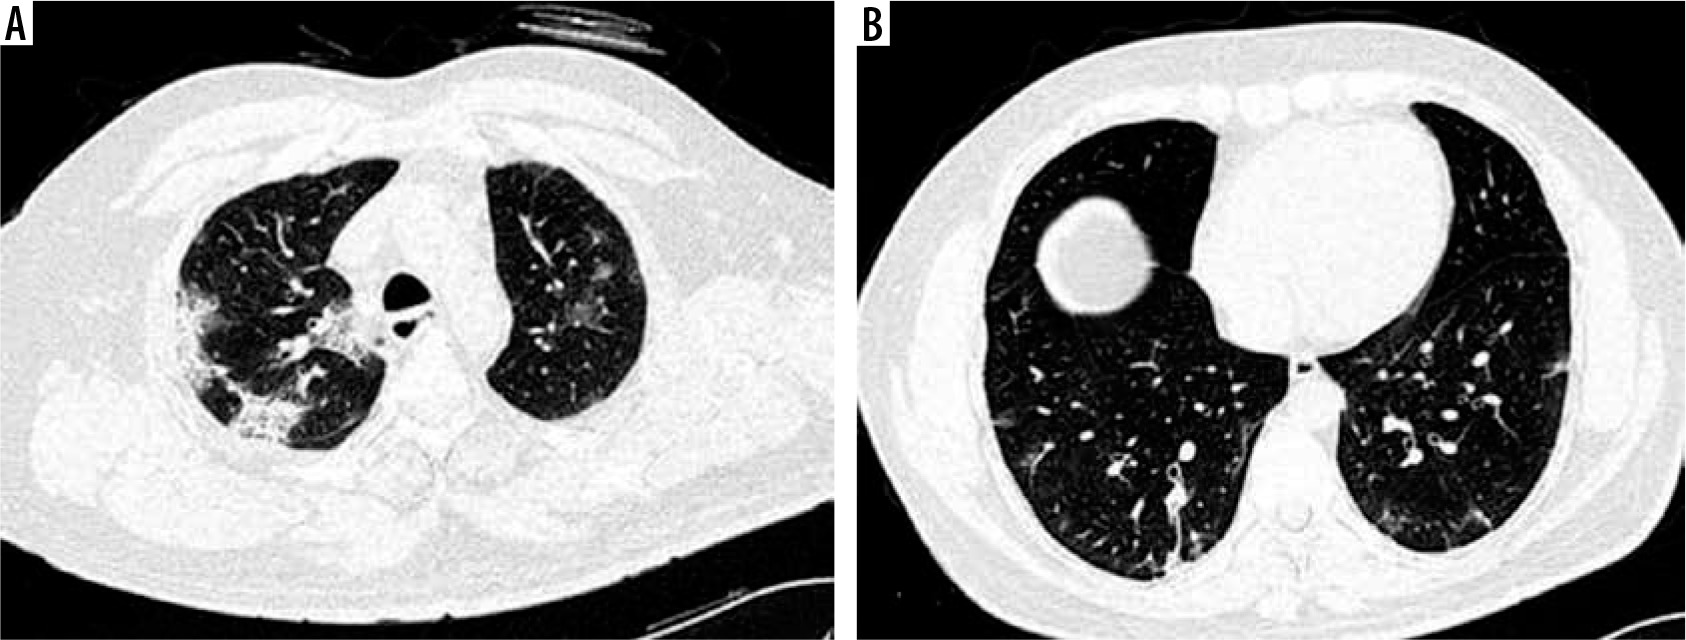
Table 2
Computed tomography (CT) findings in the study population (n = 80)
Mean CT-SS in the vaccinated group was 0.34 ± 0.2, while in the non-vaccinated group it was 0.52 ± 0.2. The majority of patients in the vaccinated group had mild (score ≤ 7) disease (42.5%) followed by moderate (score 8-17) disease (37.5%) (Table 3). The majority of patients with moderate CT-SS in the vaccinated group had score < 14 (11/15; 73.3%). In contrast, the majority of patients in the non-vaccinated group had moderate (21/40; 52.5%) and severe (11/40; 27.5%) disease (Tables 3 and 4). Mild CT-SS was observed in 17.5% cases in the non-vaccinated group. The patients were followed for up to 10 days after CT scan, with no mortality observed in the vaccinated group as compared to 2 deaths in the non-vaccinated group.
Discussion
At the end of 2019, Wuhan in china witnessed several cases of pneumonia-like conditions caused by a novel coronavirus. On 11 February 2020, this novel coronavirus was termed as SARS-CoV-2 by the international virus classification commission, and on the same day the disease caused by it was termed as COVID-19 by the World Health Organization (WHO) [20]. COVID-19 has rapidly and widely spread throughout the world with a significant impact on the socio-political situation and healthcare facilities. SARS-CoV-2 is a highly contagious virus and tends to spread via inhalation of respiratory aerosols, direct human contact, and via fomites. Although RT-PCR is the gold standard test in the diagnosis of COVID-19, it has variable reported sensitivities from 42 to 83% only [4-8], and one or more negative results do not completely rule out COVID-19. COVID-19 testing, however, has been constantly challenged by limited laboratory facilities and an inadequate supply of nucleic acid kits [21].
Imaging plays a key role in the assessment of severity of COVID-19 pneumonia. The commonest X-ray findings include bilateral lung involvement and ground glass opacities in the majority of patients. However, the absence of early changes on chest X-ray results in a large number of false negatives. Chest CT is a highly sensitive modality as compared to chest radiography, and it shows abnormal changes in the lung parenchyma in the early stages of disease [22,23]. Classical CT findings of COVID-19 pneumonia include multiple and asymmetrical ground glass opacities with bilateral, peripheral, and basal predominance with or without consolidation and bronchovascular thickening [13]. On CT, suspicion of COVID-19 infection is graded as follows: CO-RADS 1 – COVID-19 is highly unlikely (CT is normal or findings indicate a non-infectious disease), CO-RADS 2 – low suspicion of COVID-19 (CT findings are consistent with other infections), CO-RADS 3 – COVID-19 infection is indeterminate, CO-RADS 4 – level of suspicion is high and most CT findings are suspicious but not extremely typical or without a typical location and CO-RADS 5 – level of suspicion is high with typical CT findings [24]. Additional categories include technically insufficient examination (CO-RADS category 0) and RT-PCR-proven COVID-19 infection at the time of examination (CO-RADS category 6).
Until now no potential drugs are available to treat COVID-19, with the only treatment strategy being to relieve the patient’s symptoms. Various therapeutic treatments are still under trial and include antiviral drugs, anti-malarial drugs, immunomodulators, and cell and plasma therapy. Numerous vaccines have been developed, which have variable efficacy in preventing the infection and reducing the risk of transmission, thereby limiting the pandemic. Two vaccines have been used in India: Covishield (Oxford–AstraZeneca chimpanzee adenovirus vectored vaccine ChAdOx1 nCoV-19) and Covaxin (Whole-Virion Inactivated Vero Cell vaccine), with Covishield being the predominant one. Covishield is currently administered as a 2-dose vaccine, with the second dose administered at an interval of 6-8 weeks. The reported vaccine efficacy for AstraZeneca vaccine (combining dose groups) against the primary endpoint of COVID-19 occurring more than 14 days after the second dose is 70.4% [16]. However, limited or no literature is available demonstrating the role of Covishield in the evaluation of CT severity in COVID-19-positive individuals.
The majority of patients in our study were males, with a M : F ratio of 1.4 : 1. Similar results were obtained by Yang et al. in their study [25]. The commonest clinical symptoms of patients with COVID-19 in our study included fever, cough, and breathlessness.
In our study, CT findings were seen in 74 patients while normal scans was seen in 6 patients (5 in the vaccinated and 1 in the non-vaccinated group). GGO (97.5%) was the commonest abnormality observed on CT scan, followed by crazy paving and parenchymal consolidations (Table 2). Similar findings were observed by Hafez and Francone et al. in their studies [15,17]. The severity of disease on CT was classified as mild, moderate, or severe using the amount of lung opacification and calculating CT-SS in both the study groups [19]. The majority of patients in the vaccinated group had mild (42.5%) and moderate (37.5%) CT-SS score, while the majority of patients in the non-vaccinated group had moderate (52.5%) and severe (27.5%) CT-SS score. CT-SS was significantly higher in the non-vaccinated group as compared to the vaccinated group, thereby reflecting decreased lung involvement in vaccinated individuals. Also, the majority of patients with moderate CT-SS in the vaccinated group had score < 14 (11/15; 73.3%) as compared to the non-vaccinated group (12/21; 57.1%), further reflecting reduced lung parenchymal involvement in vaccinated individuals. Five cases in the vaccinated group had normal CT scan without any lung involvement, while no case in the non-vaccinated group had normal CT scan. Also, on short-term follow-up (up to 10 days), no mortality was observed in the vaccinated group as compared to 2 deaths in the non-vaccinated group.
CT-SS in COVID-19 pneumonia has paramount significance in assessing the extent of pneumonia (mild, moderate, and severe) and in predicting the dynamic changes of chest CT follow-up exams [15]. Also by assessing the severity of COVID-19 in the early stage, clinicians can accurately treat the disease [26] and prevent complications. A few other scoring systems are also available in scoring the severity of COVID-19 pneumonia. In one of such system, both lungs were divided into 20 regions and evaluated on CT, attributing scores of 0, 1, and 2, and therefore the sum of the individual could range from 0 to 40 points [25]. However, such a scoring system is time consuming and less practical to use when the flow of cases is very high.
So, we can conclude that Covishield vaccine administration significantly reduced the severity score of COVID-19 pneumonia on CT scan as compared to the non-vaccinated group. No mortality was observed in the vaccinated group as compared to 2 deaths in non-vaccinated group, thereby implying that vaccination may play a role in preventing deaths due to COVID-19. Also, the frequency of moderate and severe disease on CT was significantly lower in the vaccinated group.
Our study had some limitations. Although the effect of age as a confounding variable was removed by selecting a population above 45 years of age, other confounding variables such as co-morbidities (e.g. diabetes mellitus or hypertension) were not removed. The second limitation of this study was the limited sample size. This may be explained by the fact that the majority of the population over 45 years of age who underwent CT scans had already taken a single dose of vaccine and were not evaluated in the study. Thirdly, the amount of lung opacification on CT by CT-SS is indirect evidence of COVID-19 pneumonia burden and there was no histological confirmation of the findings in the study. So, further research is needed to identify the consistency of CT-SS in vaccinated and non-vaccinated individuals with COVID-19.