


Introduction
Temporal lobe epilepsy constitutes nearly two-thirds of focal epilepsies and is responsible for most cases of complex partial seizures [1]. Mesial temporal sclerosis is the most common cause of temporal lobe epilepsy [2,3]. Surgical resection is the only treatment option for patients with medically refractory epilepsy. Most patients with hippocampal sclerosis experience satisfactory improvement after resection of the affected hippocampus. After surgery, 60% to 70% of patients become seizure-free, and 90% of patients achieve a worthwhile reduction in seizure severity [4,5]. The most important principle underlying the surgical treatment is to identify a discrete epileptogenic focus and to identify its relationship with the eloquent cortex in order to minimize functional deficits following resection.
Video electroencephalography (EEG) technique is the gold standard for localization of the epileptogenic focus; however, it requires prolonged continuous monitoring. Advances in magnetic resonance imaging (MRI) technology to localize epileptogenic focus substantially improved the success of surgical treatment. The hallmark of mesial temporal sclerosis on MRI is hippocampal atrophy and hyperintense signal intensity on T2-weighted images. However, visual analysis is difficult in the presence of symmetric bilateral disease or mild unilateral disease [6]. Thus, absolute quantitative measurements of the hippocampus are necessary. Hence, T2 relaxometry is now increasingly being used in imaging diagnosis. Recently positron emission tomography – computed tomography (PET/CT) also has shown increased sensitivity in the diagnosis of temporal lobe epilepsy.
In our study, we compared the sensitivity of conventional MRI, T2 relaxometry, and PET/CT in the evaluation of patients with mesial temporal lobe epilepsy with video EEG as a reference standard.
Material and methods
Thirty-five consecutive cases with history suggestive of complex partial seizure referred for MRI with positive EEG findings were included in the study. The EEG findings were not known to the observers prior to the MRI study. Patients with space-occupying lesions or cortical dysplasia were excluded. All Patients underwent MRI brain on a 3Tesla (Skyra, Siemens) and PET/CT (Biograph, Siemens).
Qualitative MRI assessment
Oblique coronal T1-weighted images (T1 TIR oblique coronal) and oblique coronal T2 weighted spin-echo images were performed perpendicular to the long axis of the hippocampus. The following scan parameters were used for T1 oblique coronal: TR/TE 2500/12, flip angle 150°, matrix size 243 × 384, FOV 22 × 20 cm, slice thickness 2 mm, and scan time 2 minutes 17 seconds. The following scan parameters were used for T2 coronal: TR/TE 2500/119, flip angle 150°, matrix size 240 × 384, FOV 22 × 20 cm, slice thickness 2 mm, and scan time 3 minutes 17 seconds.
The detection of hippocampal sclerosis was based on the criteria of unilateral or bilateral small hippocampi on T1-weighted images suggestive of volume loss with increased signal on T2-weighted images. The hippocampal volume was assessed by manual semi-quantitative method in this study. In this method, the hippocampal boundary was traced manually to calculate the cross-sectional area from head to tail on both sides. The boundaries of hippocampi were defined anteriorly from the point where the uncal recess or alveus first appears and posteriorly to the section where the crus of fornix was seen in full profile. Lateral and medial borders were defined as CSF in the temporal horn of the lateral ventricle and CSF in uncal/ambient cisterns, respectively. The grey-white matter junction between subiculum and white matter of the parahippocampal gyrus was considered as the inferior margin. The volumes of both hippocampi were calculated by summing each of the cross-sectional volumes (cross sectional area × [section thickness + interslice gap]). A similar protocol was applied for 35 normal subjects, and age-matched control values for hippocampal volumes were acquired. When the hippocampal volume value was less than 2 standard deviations outside the mean value of control hippocampal volumes, they were considered as abnormal and atrophic.
Hippocampal T2 (Ht2) mapping
For the computation of T2 values, contiguous slices were obtained in a tilted coronal plane perpendicular to the long axis of the hippocampi. The following scan parameters were used: TR/TE 2000/ (13 to 160), flip angle 180°, matrix size 192 × 256, FOV 22 × 20 cm, slice thickness 4 mm, and scan time 3 minutes 5 seconds.
The T2 value was calculated with different TE values ranging from 13 to 160. Image data were transferred from the scanner to a workstation. The T2 map was generated, and the T2 value was calculated by placing the ROI in the head, body, and tail of the hippocampus. Based on previous studies, a cut-off value of 118 was chosen, beyond which the hippocampal signal was considered abnormal [7].
PET
For the PET/CT examinations, a Siemens biograph 6-slice diagnostic CT-enabled PET/CT camera was used. Patients were kept fasting for at least 6 hours before undergoing the PET/CT scan, and 2-3 mCi of fluorine-18 fluorodeoxyglucose (F-18 FDG) was administered 30 min prior to scanning. The patient was asked to sit in dim light for 30 minutes. Blood glucose levels were measured in all patients prior to the examination, with a cut-off limit of 11.1 mmol/l (200 mg/dl). A contrast-enhanced CT examination (venous phase; brain) was performed after an intravenous bolus injection of 25 ml of tri-iodinated non-ionic contrast agent at a rate of 1.5 ml/s. The following acquisition parameters were used: tube voltage 300 mA, tube current 130 kV, collimation 6 × 1 mm, reconstruction orientation transverse, reconstruction section thickness 1.25 mm with 1.2 mm increment, reconstruction kernel H31s medium smooth (Cerebrum), matrix 512 × 512, and the brain PET scan was performed over a single bed position for 10 minutes. PET images were reconstructed using ordered subset expectation maximization (True X 3D OSEM), 3 iterations per 21 subsets, with a slice thickness of 3 mm, and an attenuation correction based on the CT maps. Quantitative analysis of the PET-scan images were performed using Scenium®, a Siemens software program that is part of the Syngo.via Neurology package (Siemens CTI Molecular Imaging, Knoxville, TN, USA). It compared the patients’ brain metabolism with the age-matched control groups. Once control individuals have been chosen from the databank, the software fuses each patient’s CT with that of the software by placing both in the same standardized space. Finally, the software conducts a voxel-by-voxel statistical comparison of each patient’s PET scan to that of the control group. This was an automated quantification and thus did not depend on the operator. The quantitative analysis delineates areas of significant hypometabolism (> 2 SDs from the mean) and depicts them in images as well as in a table. The regions of hypo- and hypermetabolism were displayed in different colours, and the region with the greatest hypometabolism was defined. Descriptive statistics were used to enumerate the basic characteristics of the study group compared to EEG, which was considered as the reference standard. The sensitivity for MRI, T2 Relaxometry, and PET/CT was compared separately with EEG findings.
Results
The study included 18 males and 17 females with a mean age of 27 years, and the mean age of onset of seizure was 13.6 years.
The mean duration of epilepsy in patients with normal MRI was 10.9 years, and in patients with hippocampal atrophy it was 15.2 years.
Of the total 35 patients included in our study, 17 (48.6%) had hyperintensity on T2WI and 21 (60%) had hippocampal atrophy. Qualitative MRI showed positive findings in 24 patients (68.6%). The total number of cases positive in T2 relaxometry was 30. Of the 30 cases positive for T2 relaxometry, the involvement of the hippocampus was diffuse/focal on single or both sides as depicted in Table 1. The most common pattern of involvement among T2 relaxometry positive cases was unilateral diffuse involvement (Seen in 18 out of 30 patients). Of the 24 unilateral cases, the left hippocampus was involved in 18 cases, and the right hippocampus was involved in 6 cases.
Table 1
Distribution of magnetic resonance imaging (MRI) abnormalities in hippocampus
Video EEG and MRI
Of the total 35 video EEG-proven cases of mesial temporal lobe epilepsy, qualitative MRI was positive in 24 (68.6%) patients and T2 relaxometry was positive in 30 (85.7%) patients (Tables 2 and 3). The lateralization of MRI (combined qualitative and quantitative) in patients with mesial temporal lobe epilepsy was 85.7%. By adding T2 relaxometry to qualitative MRI, the sensitivity of MRI was increased from 68.6% to 85.7%.
Table 2
Number of patients positive in conventional magnetic resonance imaging (MRI) in comparison to video electroencephalography (EEG)
Table 3
Number of patients positive for T2 relaxometry in comparison with video electroencephalography (EEG)
PET/CT and MRI
Of the total 35 patients, PET/CT was positive in 31 patients (Table 4).
Table 4
Number of patients positive for positron emission tomography – computed tomography (PET/CT) in comparison with video electroencephalography (EEG)
Of the total 35 patients, both MRI and PET were positive in 28 patients; of these 28 patients, both conventional MRI and T2 relaxometry were positive in 24 patients (Figure 1). T2 relaxometry alone was positive in 4 patients (in whom conventional MRI was normal) (Figure 2). PET/CT alone was positive in 3 patients (in those patients MRI was normal) (Figure 3). MRI was positive in 2 patients in those PET was negative. In 2 patients both MRI and PET were negative (Table 5). A combination of MRI and PET/CT increased the sensitivity to 94%.
Figure 1
Magnetic resonance imaging (A) T2 relaxometry (B) and positron emission tomography – computed tomography (PET/CT) (C) showing lateralization of seizure focus on left side. Increased signal intensity with volume loss involving left hippocampus on coronal T2-weighted image (A) and elevated T2 values (mean value – 135) on T2 relaxometry image (B) were noted. PET/CT image (C) shows hypometabolism in left hippocampus
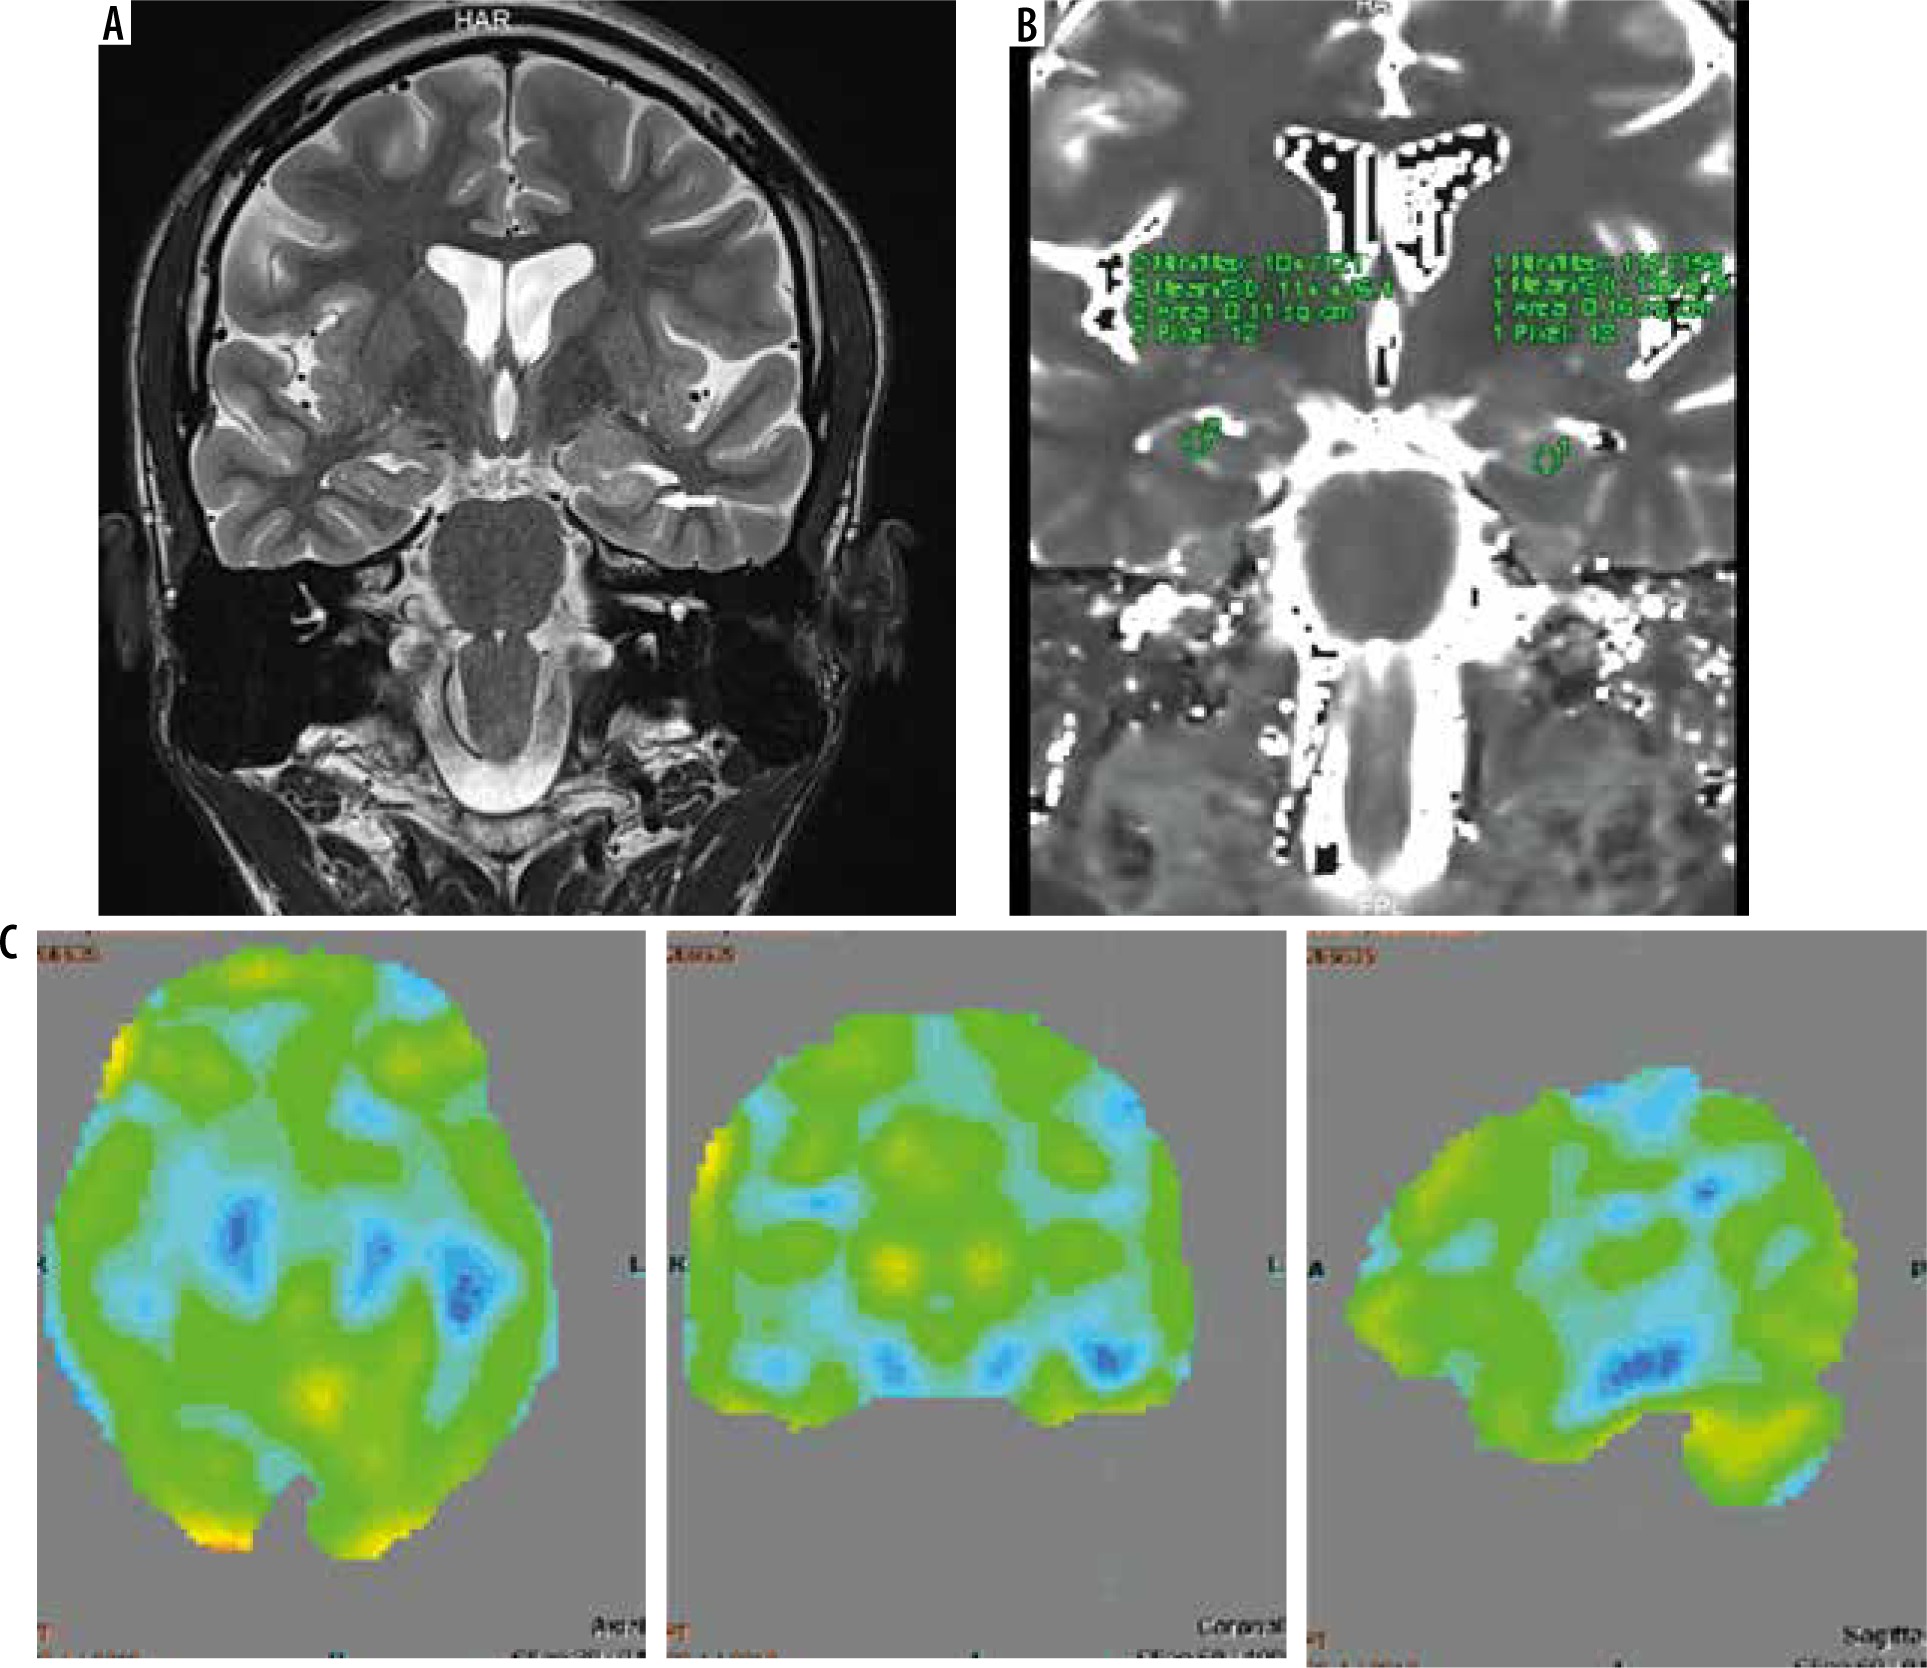
Figure 2
Magnetic resonance imaging (A) is normal, while T2 relaxometry (B) and positron emission tomography – computed tomography (PET/CT) (C) showing lateralization of seizure focus on right side. The hippocampus appeared normal on both sides on coronal T2-weighted image (A). However, elevated T2 value (mean value – 125) on T2 relaxometry image (B) was noted. PET/CT image (C) shows hypometabolism in right hippocampus
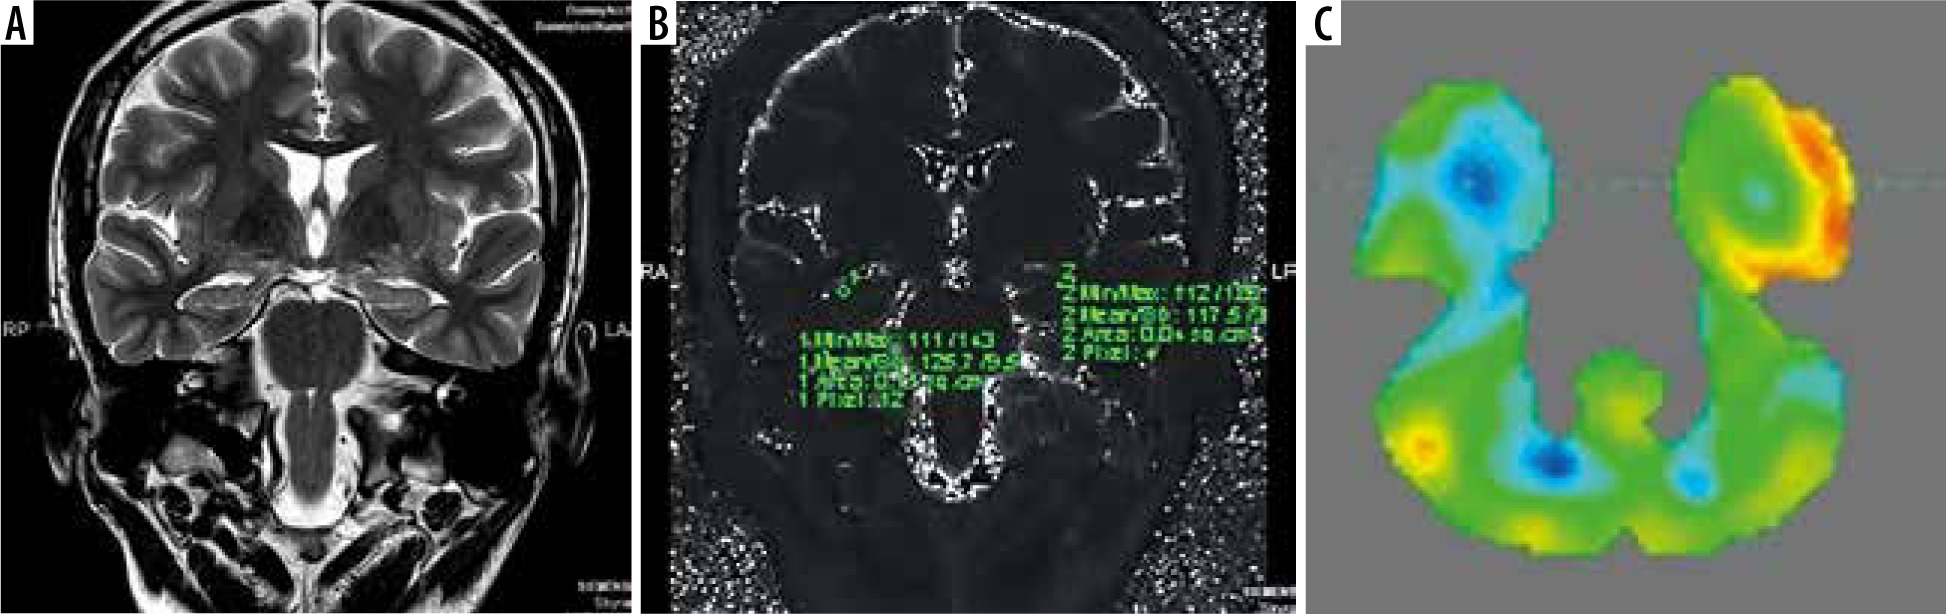
Figure 3
Magnetic resonance imaging (A) and T2 relaxometry (B) are normal and positron emission tomography – computed tomography (PET/CT) (C) showing lateralization of seizure focus on left side. The hippocampus appeared normal on both sides on both coronal T2-weighted (A) and T2 relaxometry images (B). However, PET/CT image (C) showed hypometabolism in left hippocampus
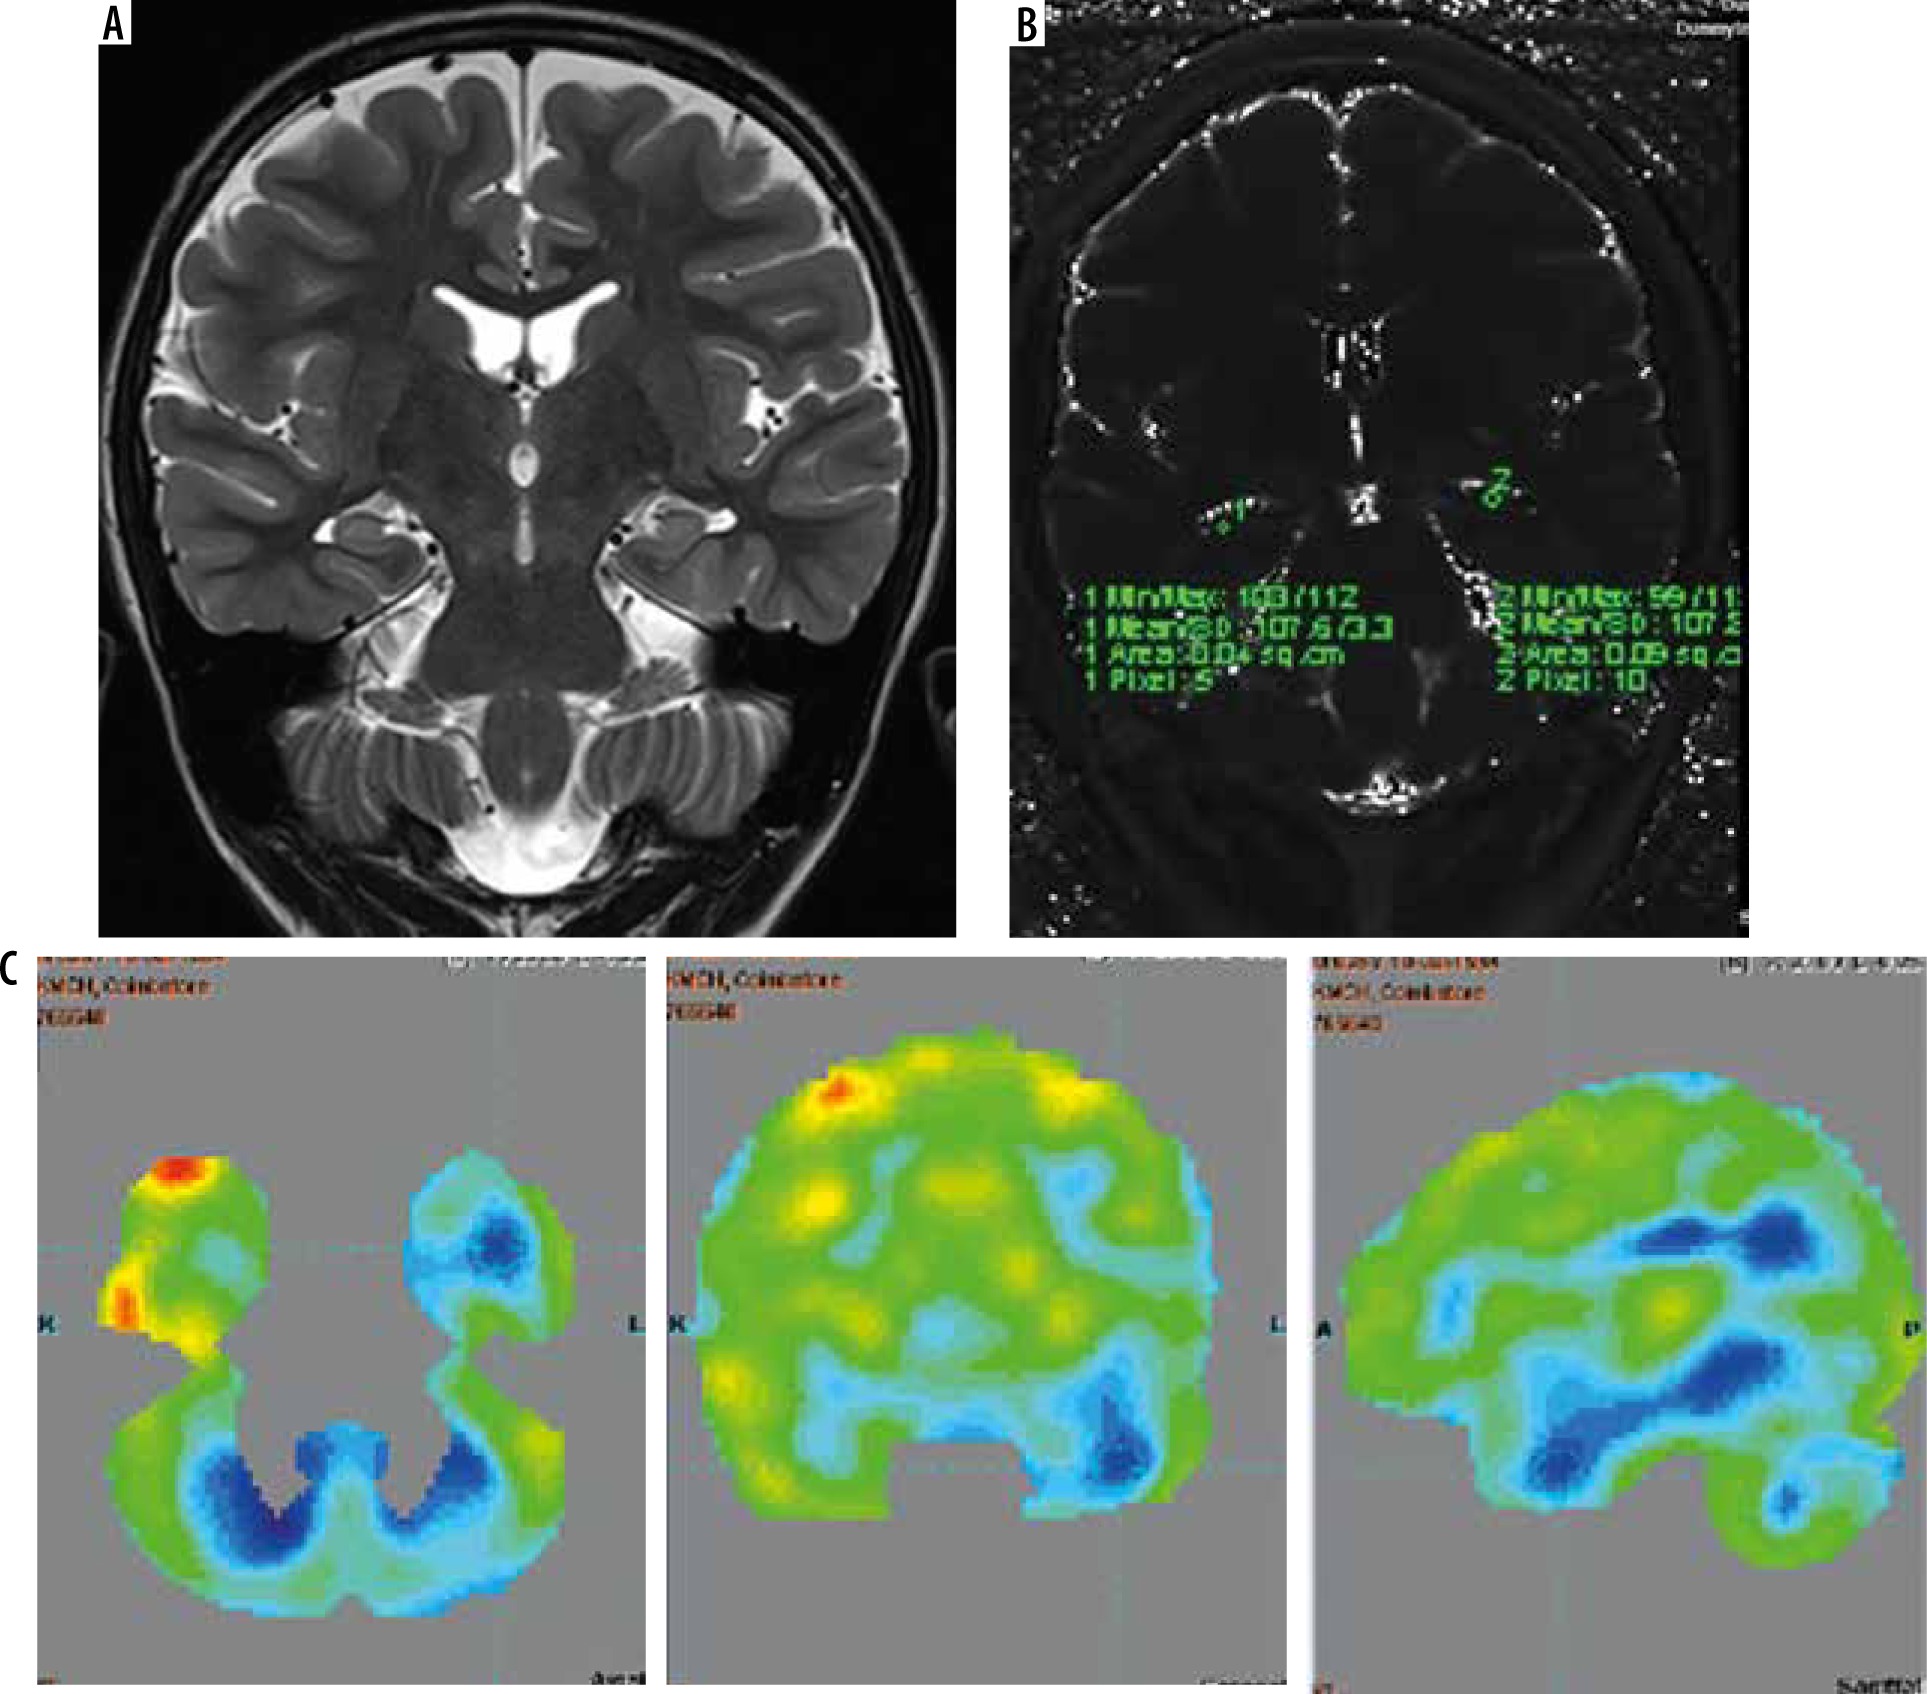
Table 5
Number of patients positive for magnetic resonance imaging (MRI) (conventional and T2 relaxometry) and positron emission tomography – computed tomography (PET/CT)
| MRI_T2 * PET/CT cross-tabulation | PET/CT | Total | |||
|---|---|---|---|---|---|
| Positive/Abnormal | Negative/Normal | ||||
| MRI_T2 | Positive/Abnormal | Count | 28 | 2 | 30 |
| Negative/Normal | Count | 3 | 2 | 5 | |
| Total | Count | 31 | 4 | 35 | |
Thus, the sensitivity of qualitative MRI (atrophy and T2 hyperintensity), quantitative MRI (T2 relaxometry), and PET/CT in lateralizing the seizure focus were 68.6% (n = 24), 85.7% (n = 30), and 88.6% (n = 31), respectively.
Discussion
Mesial temporal lobe epilepsy is the most common cause of focal and refractory seizures [3,8]. Surgical removal of the focus eliminates or greatly reduces seizures in about 70- 90% of patients with temporal lobe epilepsy who have concordant hippocampal atrophy [9]. On MRI mesial temporal sclerosis usually displays hippocampal atrophy, structural distortion, and hyperintense signal on T2WI [10-13]. These changes may be assessed qualitatively or by means of quantitative parameters like T2 relaxometry. However, a minority of patients with non-lesional electro-clinical well-lateralized temporal-lobe epilepsy have no evidence of hippocampal sclerosis in qualitative and quantitative MRI. Many of these patients have concordant hypometabolism on PET [14].
The mean duration of epilepsy in patients with hippocampal atrophy was longer than in the patients without atrophy (15.2 years and 10.9 years, respectively). In a study by Bernasconiet et al. [15], the mean duration of epilepsy was 16 ± 13 years in patients with normal MRI and 27 ± 12 years in patients with hippocampal atrophy. However, the p-value in our study was 0.1, which means these values were not statistically significant. This may be because of the smaller sample size and greater number of patients with bilateral hippocampal atrophy (in whom identification of atrophy is difficult). Other studies also showed a similar trend in the morphological abnormalities (hippocampal atrophy) in long-standing epilepsy [16].
The sensitivity of MRI, T2 relaxometry, and PET
In our study hippocampal atrophy was noted in 60% of patients, and signal changes on T2 WI were noted in 48.6% of patients. Other studies on temporal lobe epilepsy demonstrated a range of variability from 8% to 90% [17-19], which may partly be attributed to the subjective nature of visual assessment of subtle signal abnormalities in images of varying quality. In our study qualitative MRI was concordant with video EEG in 68.65% of patients in lateralizing the epileptogenic foci. In a study conducted by Won et al., in 1999 [20], regarding the comparison of sensitivities of MR imaging with PET and Ictal SPECT in lateralization of epileptogenic foci in 118 patients with intractable epilepsy, MRI was concordant with video EEG in 58% of patients. Thus, in the concordance of MRI and video EEG, our study has comparable results to the study by Won et al.
In an analogous way to the quantification of hippocampal atrophy by volumetric analysis, T2-weighted signal intensity may be quantified reproducibly by measurement of hippocampal T2 relaxation time. T2 relaxometry is used to quantify the T2 signal in the hippocampus. The hippocampal T2 time reflects the pathology of the tissue. Because water content is often higher in pathological tissue than the adjacent normal tissue, the changes result in longer T2 relaxation time. It measures the decay in signal intensity at different TEs in a series of T2W images acquired in the same slice. The main advantage of this technique is that, because the range of normal hippocampal T2 relaxation times is small, the measured values are absolute and immediately comparable against controls [21]. Furthermore, the T2 values allow detection of mild, bilateral abnormalities and can be measured within a few seconds [22]. The definition of a normal hippocampus by this method is very precise, and the diagnosis of mesial temporal sclerosis does not depend on a side-to-side comparison. Thus, cases of mild and bilateral hippocampal sclerosis can be diagnosed. In mesial temporal sclerosis, the relaxation time was proven to be lengthened by 10 ms [23]. In our study, a cut-off value of 118 was followed based on previous studies [7]. In our study, the range of T2 relaxometry values in the ipsilateral side of seizure focus was 118-152 and the contralateral normal side was 102-117. The sensitivity of T2 relaxometry in our study was 85.7%. In a study by Jackson et al. [24] all hippocampal T2 measurements greater than 116 ms were considered abnormal, and they found abnormal hippocampal T2 relaxation times in the hippocampus ipsilateral to the site of seizure origin in 70% of patients. In a study by Duncan et al. [25] on quantitative relaxometry of hippocampal sclerosis, the range of T2 relaxation times in hippocampal sclerosis was 118-154, and in the hippocampus contralateral to seizure focus it was 100-116.
The sensitivity of MR analysis can be increased by quantitative measurements like T2 relaxometry. Adding T2 relaxometry to qualitative MRI increased the sensitivity from 68.6% to 85.7% in our study. In a study by Bernasconi et al. [15] the sensitivity of qualitative MRI was 56% (14 patients were positive out of 25) and increased to 92% by adding T2 relaxometry (23 out of 25 patients were positive). Hippocampal T2 mapping provides evidence of hippocampal damage in most patients with intractable TLE, who have no evidence of atrophy on MRI, and it can correctly lateralize most patients. This technique can be a useful adjunct to presurgical evaluation of temporal lobe epilepsy in patients with normal MRI and can lead to a reduction in the need for invasive recordings in this group.
In a study by Won et al. [20], with histopathology as the reference standard, MRI, PET, and Ictal SPECT correctly lateralized the lesion in 72%, 85%, and 73% of patients, respectively. In our study, the sensitivity of MRI (conventional and T2 relaxometry) and PET/CT in lateralizing the seizure focus were 85.7% and 88.6%, respectively.
In the study conducted by Nagata et al. in 1995 comparing the sensitivity of PET, SPECT, and MRI with video EEG as the reference standard, the sensitivity of PET, SPECT, and MRI in the localization of seizure focus was 90%, 60%, and 80%, respectively[26]. In a study conducted by Stefan et al. in 1987 regarding the functional and morphological abnormalities in temporal lobe epilepsy, the sensitivity of MRI was 80% and PET was 100% [27].
In a study by Spencer et al. comparing the sensitivity of MRI and PET in temporal lobe epilepsy with EEG as standard, the sensitivity of qualitative MRI, qualitative MRI, and PET/CT were 55%, 71%, and 84%, respectively [28]. The combined sensitivity of MRI and PET in our study was 94%.
In a study by Coan et al. [29] MRI performed with a 3T scanner and visually inspected by imaging experts, they concluded that quantification of hippocampal volume and T2 signal can increase the detection of signs of hippocampal sclerosis in approximately 28% of patients with mesial temporal lobe epilepsy. Because these MR imaging quantification methods are widely available, they could be used in routine diagnostic protocols for patients with drug-resistant focal epilepsies and visually normal MRI findings after further validation for clinical use.
In our study, the left hippocampus was more involved than the right side, and the head of the hippocampus was more involved than the body and tail. The results were similar in the previous studies [30-32].
Conclusions
We found that quantitative T2 relaxometry increases the sensitivity of routine MRI in the lateralization and localization of seizure focus amongst temporal lobe epilepsy patients. Diagnostic performance of combined MRI (routine and T2 relaxometry) was comparable to PET for the localization and lateralization of seizure focus. It is a useful tool in the workup of TLE patients and in combination with video EEG and PET it can identify patients who are most likely to benefit from surgery.