


Introduction
Urinary stones are a common urological problem. When urinary dilatation is detected it is important to know whether it is acute or not. While rapid intervention is needed to protect renal function during acute obstruction, urgent intervention only rarely necessary in chronic cases (such as single kidney or purulent infections) [1,2]. Unenhanced computed tomography (CT) is the standard imaging modality in the diagnosis of renal colic [3,4]. CT has 95% sensitivity and 98% specificity in detecting ureteral stones [5]. A potential weakness of unenhanced CT is the difficulty of differentiating distal ureteric stones from pelvic calcifications such as phlebolith [6]. Therefore, auxiliary findings such as ureteral dilatation and perinephritic stranding have been described [7]. There are also reports suggesting that there may be renal density differences between acute ureteral and chronic dilatations [8]. It has been proposed in these publications that the density of the obstructed kidney can be lower than that of the normal kidney due to interstitial fluid accumulation in acute obstruction cases and that this could be used to differentiate acute cases from chronic ones [1].
The aim of this study was to investigate the diagnostic value of renal parenchymal density differences in distinguishing between acute and chronic urinary dilatations.
Material and methods
Patient selection
For this retrospective study, approval was obtained from the Ethics Committee of our university. Unenhanced CTs of 98 patients were evaluated retrospectively. Thirty-two of the cases were normal. Thirty-three had acute urinary obstruction (AUO), and 33 had chronic urinary dilatation (CUD). Normal cases were selected from the group of patients with nonspecific abdominal pain, who underwent CT scanning with no clinical or laboratory consideration for urinary disease. Patients with AUO were those who visited the Emergency Department diagnosed with renal colic and were found to have ureteral stones. In this group, the time since onset of symptoms varied from three hours to five days. CUD cases were selected from patients who were referred from the outpatient clinic to the Radiology Department for CT scanning without having renal colic symptoms, and no ureteral stones were detected. Unilateral chronic dilation in these cases was previous long-term urinary stone history and extracorporeal shock wave lithotripsy (ESWL) application. Cases with unilateral pathology from both acute and chronic urinary dilation groups were included in the study. Cases with bilateral urinary dilatation were excluded from the study. In all three groups, cases with focal or diffuse parenchymal involvement, such as previous urinary operation, acute urinary infection, lymphoma, and amyloidosis, and patients with Beam-Hardening artefacts severe enough to prevent measurement, were excluded from the study. Patient records in which the obstruction could not determined as acute or chronic were excluded from the study.
Scanning and analysis of the scans
The CT scans were performed with a Siemens Definition Flash 256 detector (Siemens, Germany). Single-breath, unenhanced sequences were used for the examinations. Parameters of the examinations were as follows: FOV 47 × 47 cm, slice thickness 3 mm, 120 kV, 150 mA, and matrix 512 × 512. For evaluation, coronal reconstructions of 3 mm were made on the images taken on the axial plane.
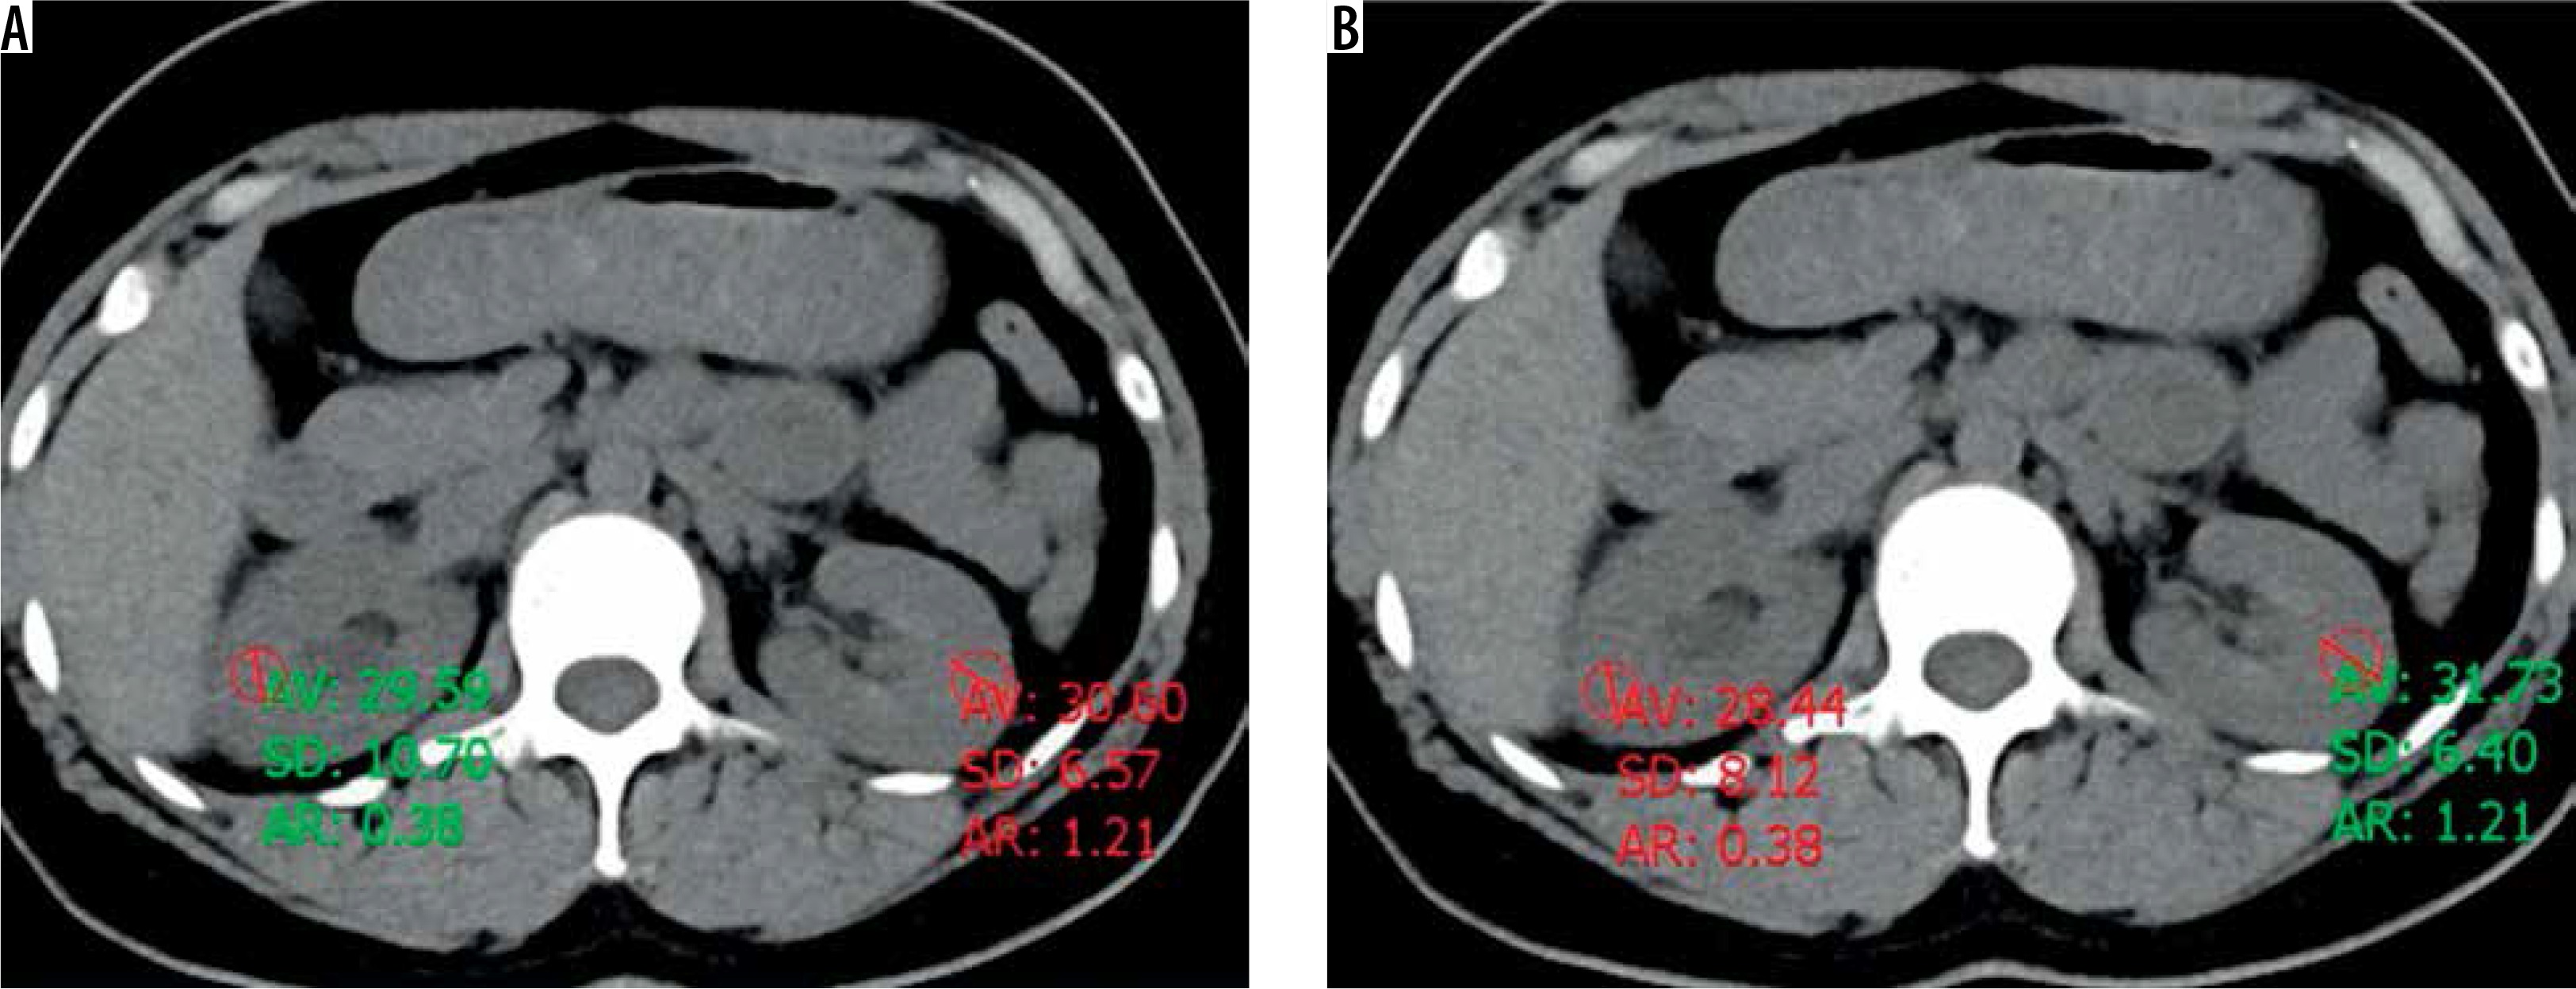
Image evaluation was done on workstations (Sisoft PACS, Turkey). The images were evaluated in a soft tissue window. Demographic data, parenchymal density values (HU), and renal pelvic anterior-posterior (AP) diameters of all three groups were evaluated by two different radiologists who were unaware of each other and the content of the study. First radiologist had five years of specialty experience and the second had 15. The observers measured the HU values of each kidney three times, upper-middle and lower in the same slice. The observers performed measurements with an appropriately sized and localised ROI that was greater than 5 mm in diameter, which would stay within the limits of renal parenchyma to avoid the partial volume effect (Figure 1). If beam-hardening artefacts were observed, measurements were done on areas without artefacts.
Statistical analysis
Pearson’s correlation analyses were performed to test the measurement correlation of each observer in normal cases, between the right and left kidney, and to test correlations between observers. The t-test was used to compare parenchymal density and renal pelvic diameter differences with normal, acute urinary dilation and chronic urinary dilation groups. In the normal group, the right kidney and the left kidney were compared, whereas the normal side and the pathological side were compared in the AUO and CUD groups. P values lower than 0.05 were considered significant. A receiver operating characteristic (ROC) curve was generated and the area under it (AUC) measured to estimate the optimal cut-off value between different groups. Sensitivity and specificity were calculated. All statistical analyses were done using SPSS software (IBM SPSS Statistics 20).
Results
There were 98 cases in this study. Twenty-three (32.7%) were women and 66 (67.3%) were men. There were 32 cases in normal groups (15 female, 17 male), and the mean age was 39.53 years (13-67). Thirty-three cases were in the acute obstruction group (seven females, 26 males), and the mean age was 42.52 years (19-79). Thirty-three cases were in the chronic obstruction group (one female, 23 male), and the mean age was 53.21 years (16-84).
Observer 1 did not find a statistically significant difference between the measurements of renal pelvis AP diameters (p = 0.08) and kidney density (p = 0.36) in normal cases. There was also no statistically significant difference between the measurements of renal pelvis AP diameters (p = 0.11) and kidney density (p = 0.63) in normal cases for observer 2 (Tables 1 and 2).
Table 1
Observer 1 measurement
Table 2
Observer 2 measurement
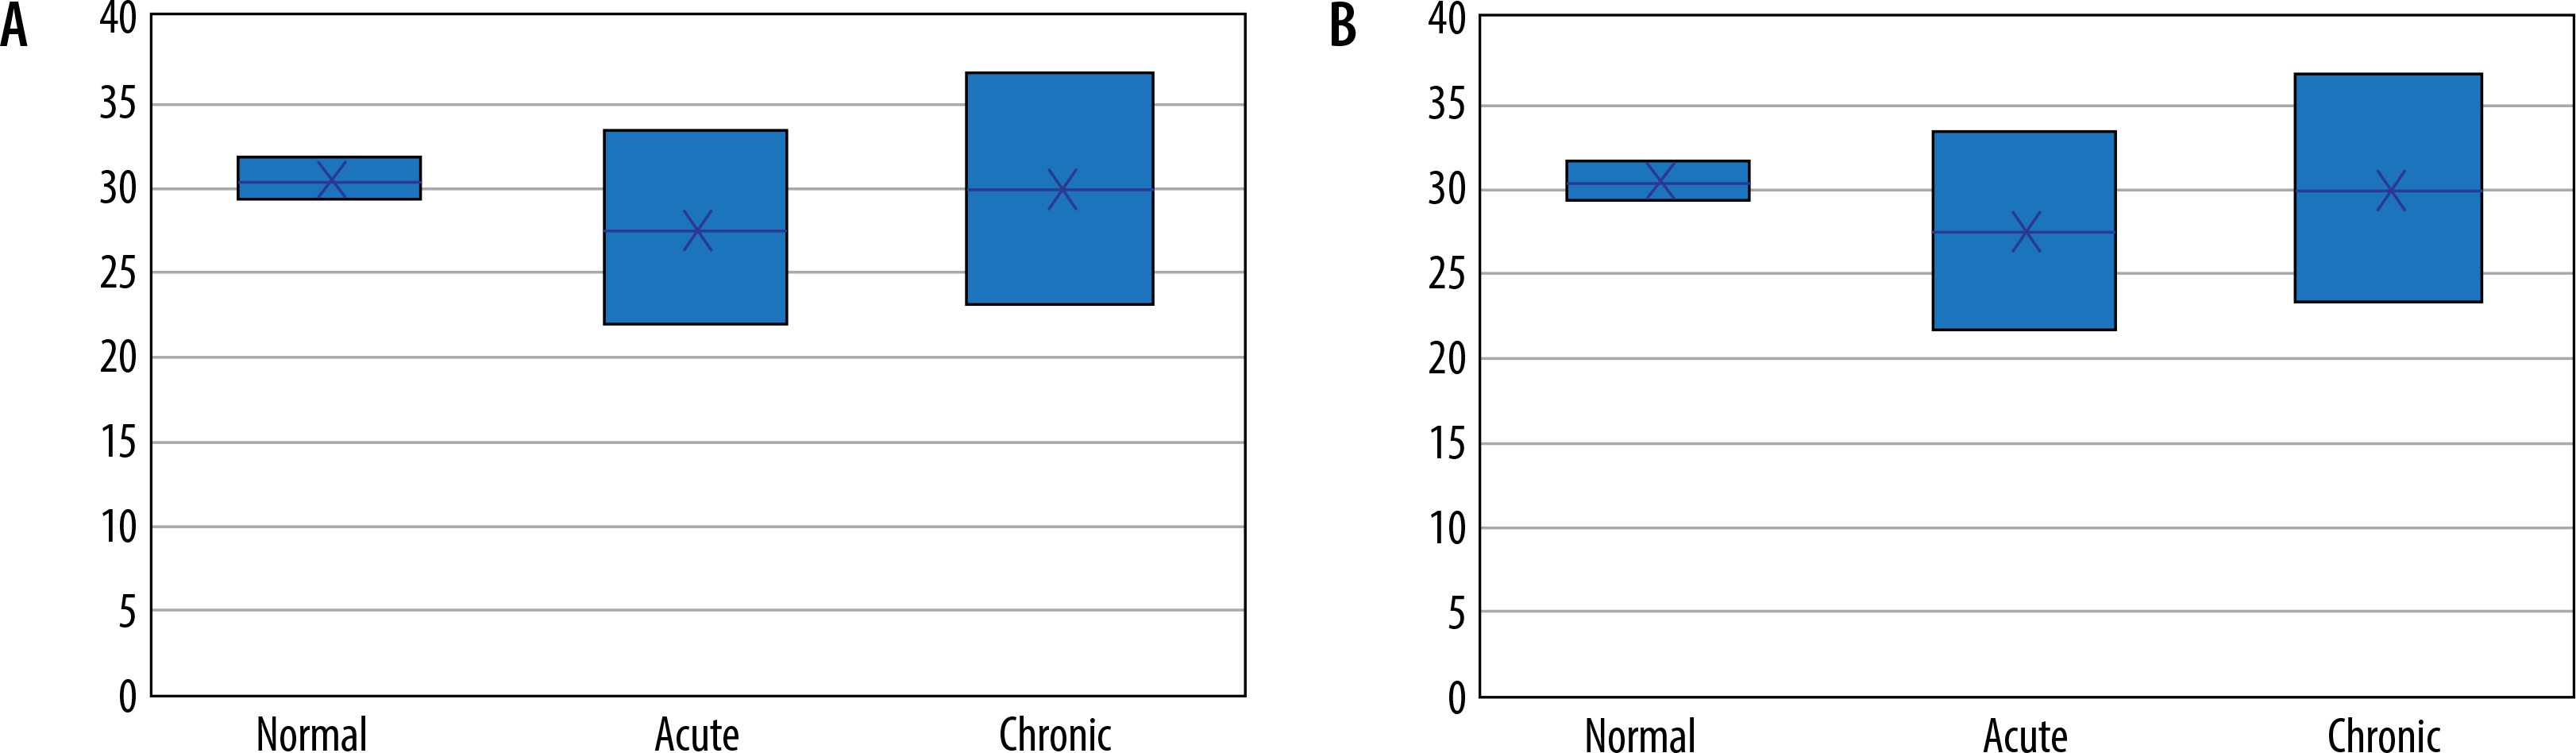
In acute urinary obstruction cases, renal pelvic AP diameters of both kidneys were detected to be significantly different by both observers (p < 0.01). No significant difference in renal density was found between the normal and obstructed sides by the first observer (p = 0.10). However, a statistically significant difference (p < 0.01) was found between the normal and obstructed sides by the second observer (Figure 2).
In the chronic urinary obstruction group, renal pelvic AP diameters of normal and pathological kidneys were detected to be significantly different by both observers (p < 0.01). However, the difference between measurements of normal and pathological renal densities was not significant. Statistical findings of measurements done by both observers are summarised in Tables 1 and 2.
While for observer 1, the correlation between right and left renal density measurements of the normal cases was moderate at 0.576 (p < 0.01), correlation of measurements done by observer 2 was found to be high at 0.777 (p < 0.01). When the inter-observer correlations are considered, there was a moderate correlation in the normal group at 0.659 (p < 0.01), a high level of correlation in the acute obstruction group at 0.786 (p < 0.01), and moderate correlation in the chronic obstruction group at 0.491 (p < 0.01). When all the cases were evaluated together, there was a high correlation between the observers at 0.686 (p < 0.01) (Table 3).
Table 3
Interobserver correlations
| n | Pearson’s correlation | p value | |
|---|---|---|---|
| Normal cases | 32 | 0.659 | < 0.01 |
| Acute cases | 33 | 0.786 | < 0.01 |
| Chronic cases | 33 | 0.491 | < 0.01 |
| All cases | 98 | 0.686 | < 0.01 |
When the 2.16 HU difference cut-off was determined between the normal group and the acute urinary obstruction group, the sensitivity and specificity for observer 1 was 66.7% and 53.1%, respectively, and for observer 2 these values were 57.6% and 50%, respectively. The sensitivity and specificity results between the other groups are given in Table 4.
Table 4
The sensitivity and specificity results between the groups
Discussion
The most important result that we obtained in this study is that the concordance between the observers is not very good regarding the measurements of renal densities, which are recommended as an auxiliary finding in urinary obstruction patients. Findings presented in two of similar studies were obtained from a single observer, and correlation between observers was not studied [2,3].
Unenhanced CT has a sensitivity of 95% and specificity of 98% [5] to detect ureteral stones. There are difficulties in diagnosis in the remaining less than 5% of cases. Additional findings are helpful in these cases. The most important of these is the detection of asymmetric ureteric dilatation. Zelenko et al. found in their retrospective study of 212 cases with acute flank pain, who were found to have stones, that the average ureteric diameter was 1.8 mm (range 1-6 mm), and it was 7 mm (range 1-20 mm) on the obstructed side. In our study, measurements were made in renal pelvis, and the measurements of renal pelvis AP diameters of normal and obstructed sides in the acute urinary group done by the observers were statistically significantly different [9]. Another helpful finding is pale kidney. This is due to persistent glomerular filtration despite acute obstruction, resulting in increased pyelocaliceal pressure and subsequent fluid leakage in the interstitial space [7]. Özer et al. and Erbaş et al. found significant differences between acutely obstructed sides and normal sides in their study. They reported that acute obstruction can be distinguished with 78% sensitivity and 97% specificity from chronic obstruction if a threshold value of 5 HU is selected as a difference. The first observer measured the mean density as 28.61 HU on the symptomatic side and 30.66 HU on the asymptomatic side. The difference was only 2.15 HU, which was not statistically significant (p = 0.10). The second observer found that on the symptomatic side, the mean density was 27.33 HU while it was 31.62 HU on the asymptomatic side. The difference was 4.29 HU, which is statistically significant (p < 0.01). When these findings and the difference between renal densities was taken into consideration, the sensitivity for the first observer was 72.7% and the specificity was 50%, and for the second observer they were 69.7% and 50%, respectively, when the difference was 1.66 HU.
Pale kidney, on the other hand, is not a specific finding for acute urinary obstruction. In a recent study, El-Merhi et al. reported that renal density differences could also be used for acute pyelonephritis [10]. In this study, they emphasised that there may be a difference of 25-32% between both kidney densities in a non-obstructive period such as acute pyelonephritis. Likewise, because the same finding may be observed in diffuse infiltrative diseases such as lymphoma, amyloidosis, and other conditions that cause kidney oedema, such as renal vein thrombosis, it should be considered that it may cause misinterpretations, especially when the stone is not visible.
In our study, we also looked for inter-observer correlations for renal density measurements. Correlation was high in the normal and acute obstruction subgroups and moderate, at 0.491, in the chronic obstruction subgroup. Pearson correlation coefficient was found to be high at 0.686 when all cases were evaluated.
There are some limitations in our study. First of all, we used patient records for the formation of the groups because the study was retrospective. The second limitation is the small number of cases. In some cases, patients were relied on for the information about their anamnesis of the onset of complaints. Differences in experience between the observers may also have influenced the results, but this was done on purpose. We have observed the interpretation skills of observers with different levels of experience. While evaluating the patient images, beam-hardening artefacts were challenging.
In conclusion, the finding of pale kidney seems to be helpful in the diagnosis of acute urinary occlusion, but different results were obtained with evaluations made by different observers. Moreover, it is not a specific finding because oedema can also be seen in some other conditions, such as acute pyelonephritis; for this reason, one must be careful during the evaluation of this finding.