


Introduction
Pulmonary nodules are common findings in thoracic computed tomography (CT) examinations referred for different pulmonary complaints or for further imaging of the pulmonary nodules that are visible in chest radiography. The malignancy risk of the nodules increases with the nodule size. In order to prevent unnecessary surgery, the characterisation of the nodule by noninvasive methods is fundamental. CT is the main imaging technique applied for the evaluation of pulmonary nodules, and it is based on morphological assessment of nodules [1]. The morphological analysis of solitary pulmonary nodules (SPN) in CT such as location, size, margin features, shapes, and enhancement features are important and are beneficial in the benign/malignant differentiation of nodules [2].
However, in some cases it is difficult to differentiate malignant lesions and granulomas or some hypervascular benign lesions [3]. Besides, the maximum standard fluorodeoxyglucose (FDG) uptake (maximum standardised uptake values [SUVmax]) in positron emission tomography (PET) shows the metabolic activity of a tumour. High SUV values are associated with cell proliferation and poor prognosis in lung tumours [4].
Because of its higher resolution in soft tissue structures, magnetic resonance imaging (MRI) is preferred in the diagnosis and follow-up of many tumours. Conventional MRI techniques are being used in the evaluation of solitary pulmonary nodules but occasionally have shown controversy in differentiation of benign versus malignant nodules [5].
Similarly, dynamic contrast-enhanced MRI showed occasional overlaps in malignant lesions and inflammatory lesions. In this respect, various MRI techniques that provide metabolic and biophysical information, as well as the standard sequences, have been increasingly used [6].
Diffusion-weighted imaging (DWI) is a noninvasive method that gives information about the biological structure of tissues at the molecular level based on the random movement of water in biological tissues. It is quantified as the ‘apparent diffusion constant’ (ADC) [7]. The diffusion of water in the tissues often varies in several diseases, giving clues about tissue density or tissue viability [8].
Although DWI is primarily used in cranial imaging, DWI use has become applicable in other organs with echo- planar MRI techniques [9]. Because of the highly cellular structure and high tissue disorganisation of the malignant lesions, although the number is limited, various studies have been planned in order to evaluate the pulmonary nodules with DWI because the movement of intracellular water will be restricted in these cases.
In this prospective study, we aimed to compare the characteristics of the nodules in CT examinations in terms of benign versus malignant features and to compare the accuracy of diffusion-weighted MRI (DW-MRI) and PET/CT results in making this differentiation.
Material and methods
Ethics Committee approval was obtained for our study, and written consent was obtained from each patient.
Between the years of 2014 and 2017, patients who underwent thorax CT with a 64-section CT device (Brilliance 64, Philips Medical Systems, Best, Netherlands) were evaluated.
CT parameters were as follows: 120 kVp; 120 mAs; collimation, 64 × 0.625; pitch, 1.078; rotation time. 0.75 ms; matrix 521 × 521 pixels. Patients who had increased nodule size in follow-up, nodules greater than 1 cm with increased density or with irregular borders, ground glass nodules larger than 1 cm with solid component in thin-section CT slices, and having primary lung cancer suspicion underwent further thoracic DWI-MRI (Table 1).
Table 1
Thoracic diffusion-weighted magnetic resonance imaging acquisition parameters
| Imaging parameters | |
|---|---|
| TR/TE (ms) | 2600/65 |
| TI (ms) | 180 |
| In-plane resolution | 4.4 x 5.5 x 5 |
| NSA | 3 |
| Matrix | 92 |
| FOV | 425 x 278 |
| EPI-factor | 21 |
| B-values (s/mm2) | 0-500 |
| Acquisition time | < 120 |
For the MRI examination, 1.5 Tesla MR Devices (Achieva, Philips Medical Systems, Best, Netherlands) were used. Patients who had diffusion restriction in DAG and patients who did not have any diffusion restriction but had high risk according to clinician were referred to PET/CT.
At the end of these procedures the patients who underwent biopsy were included in this study. Biopsies were performed transbronchially or percutaneously. Seventy-six patients (60 male, 16 female) who underwent biopsy, depending on the test results, were included in the study.
MRI images were performed by a radiologist who had five years of experience in thorax imaging. DWI-MRI images were qualitatively compared to neighbouring muscle structures by examining the signal characteristics of the lesions in terms of signal intensity. ADC maps were calculated on a pixel-by-pixel basis using a computer program. Round ROI was selected two different measurements were performed by placing the circle on the solid section of the lesion if existed by leaving the necrotic areas outside and the average value is taken.
All 18F-FDG PET-CT examinations were performed with a PET/CT device (Gemini TF, Philips Healthcare, Best, Netherlands). After at least six hours of fasting, the glucose levels of the patients were controlled, and patients with values lower than 140 mg/dl were given intravenous 2-deoxy-2-fluoro-D-glucose (18FDG). CT images were taken 60 minutes after injection. Patients were then switched to PET imaging without changing position, and images were taken. CT images were used for the attenuation and correction of the PET image acquisition (Figure 1).
Figure 1
Image examples of a 57-year-old patient with small cell carcinoma of the right lower lobe. A) Thorax contrast-enhanced computed tomography scan (mediastinal window setting), B) diffusion-weighted magnetic resonance imaging of the tumor with hyperintensity, C) corresponding ADC map appearing as a low signal intensity (ADCmin = 0.82 × 10⁻³ mm2/s) and D) combined positron emission tomography and computed tomography of the same patient with a maximum standardised uptake values of 12.4

Statistical analysis
Statistical analysis of data was made with SPSS (Statistical Package for the Social Sciences) version 15.0. Data of continuous variables are given as mean ± standard deviation and median; data of interval and categorical variables are given as frequency and percentile. Pearson’s test was used for correlations and receiver operating characteristics (ROC) analysis for determining the cut-off values; in the analysis of group comparisons, χ2 test, Fischer’s exact for categorical variables, and Student’s t-test and Mann-Whitney U test for continuous variables were used. Results were evaluated with a 95% confidence interval and a significance level of p < 0.05 (*p < 0.05, **p < 0.01, ***p < 0.001).
Results
Among 76 patients included in the study 78.9% were male and 21.1% were female. Patients’ ages ranged from 36 to 85 years with a mean value of 57.79 ± 10.71 years. The male gender ratio and the mean age were higher in the malignant patients than the benign ones, without any statistically significant difference (p < 0.05).
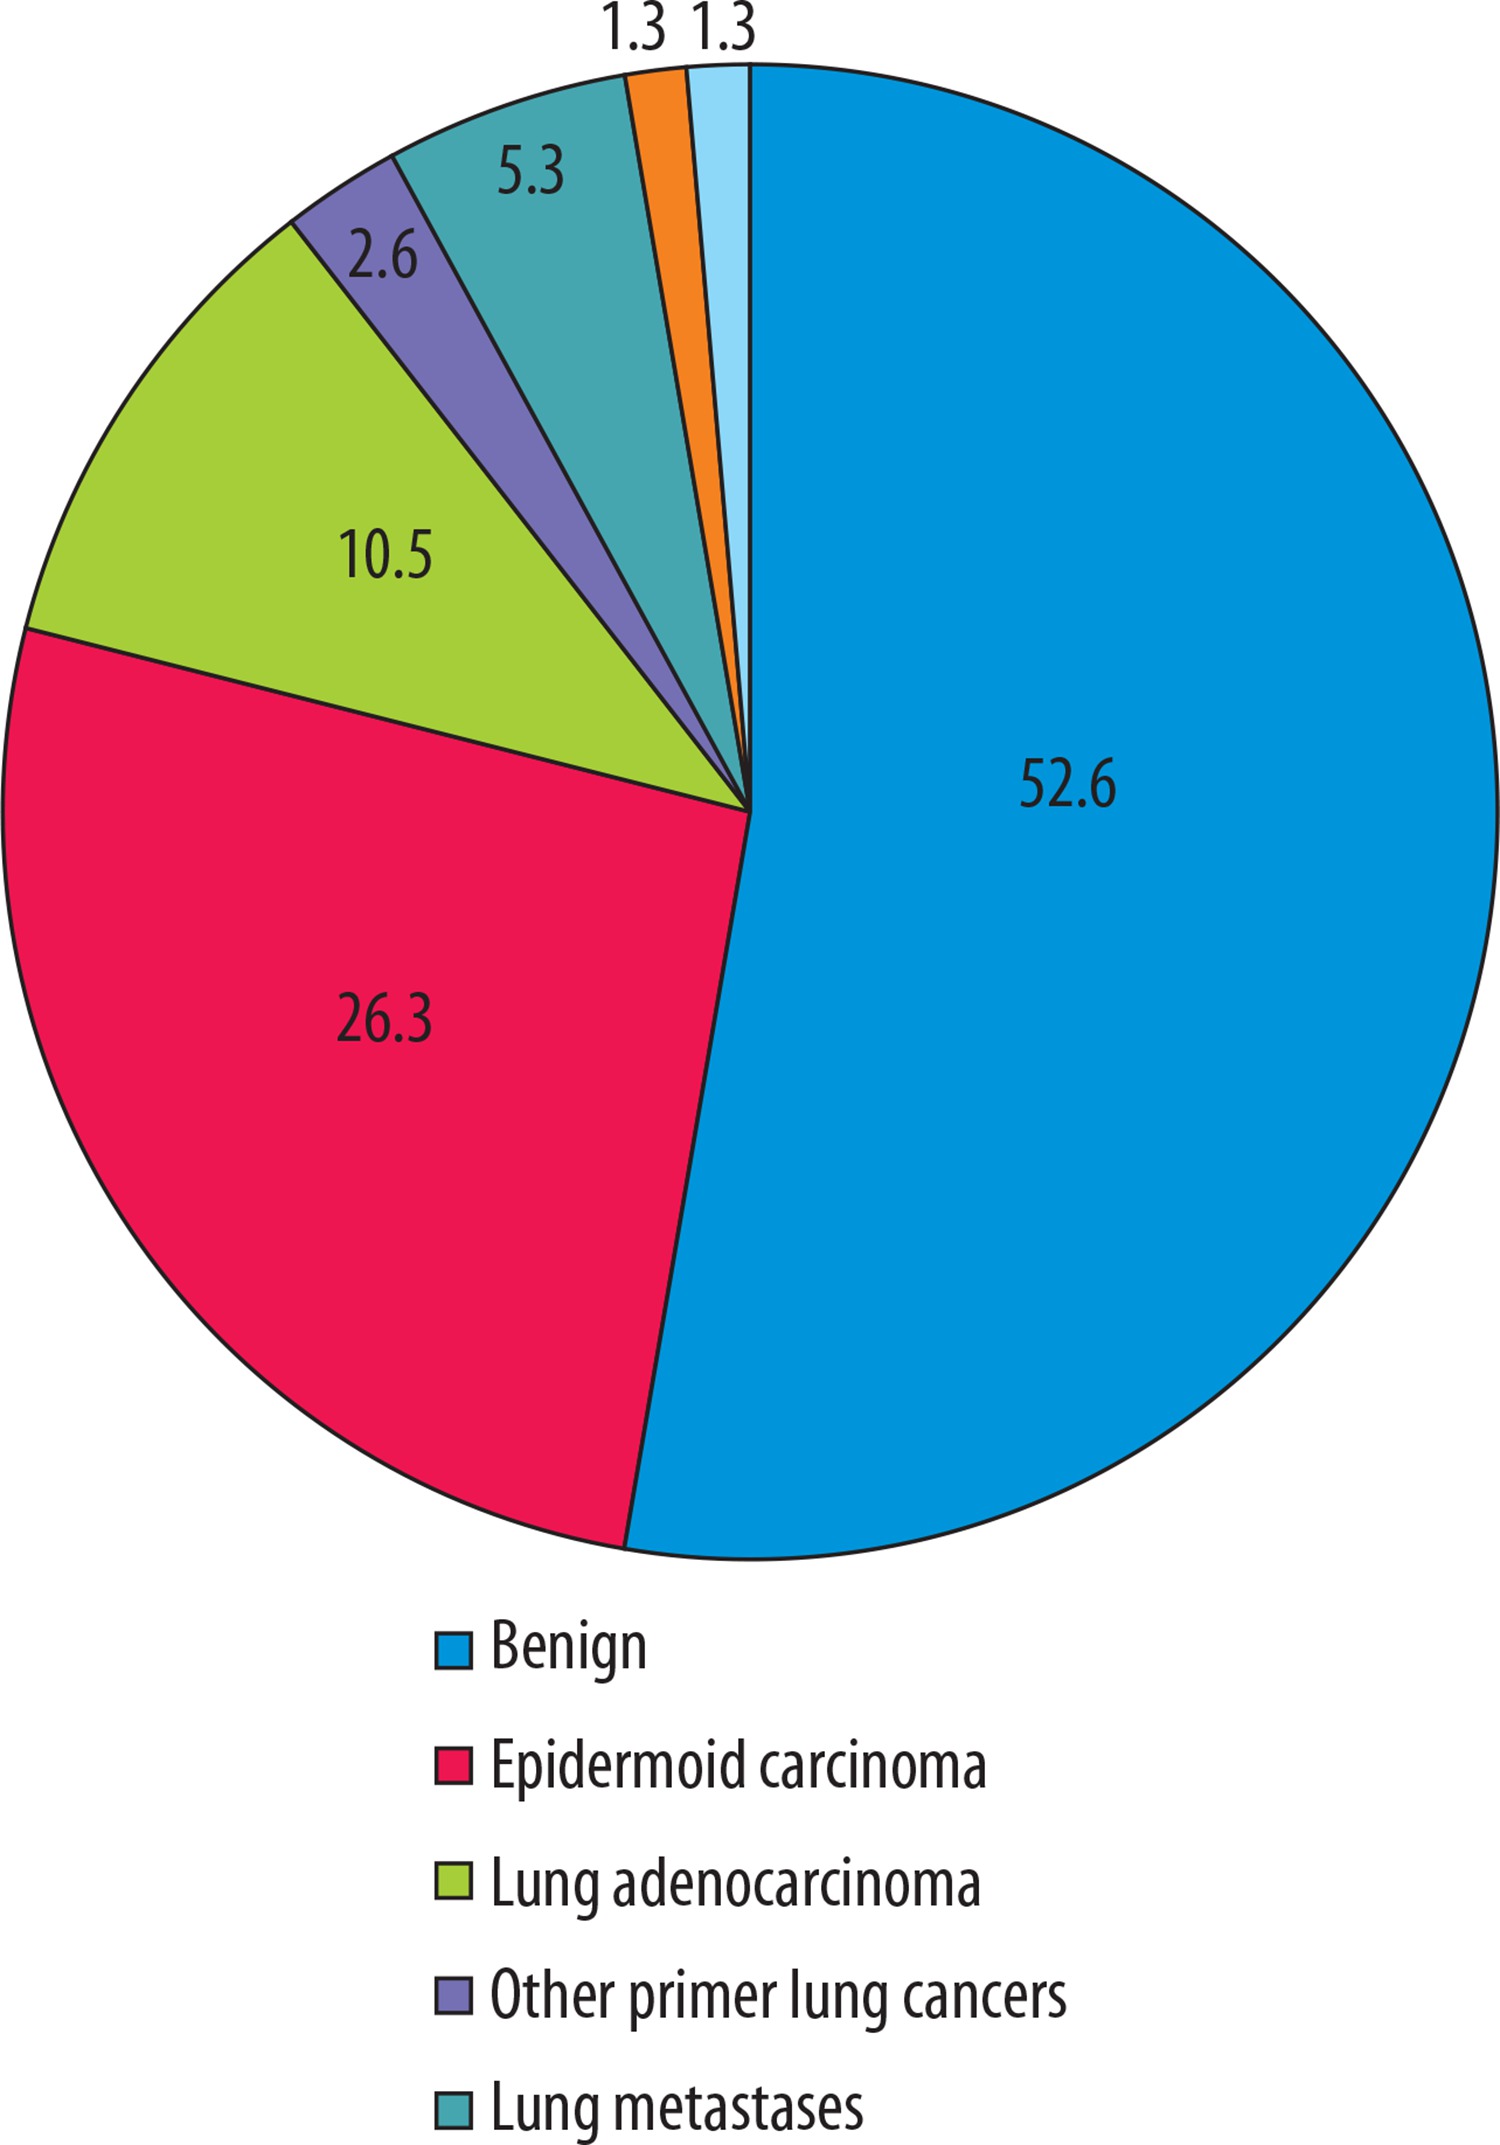
The pathological diagnosis distribution of the nodules is shown in Figure 2.
There were no statistically significant differences between benign versus malignant pulmonary nodules regarding the presence of apical tuberculosis sequelae and the presence of bronchiectasis and sequelae in the neighbourhood of the nodule (p > 0.05). The central location of the nodule/mass, on the other hand, was seen to be significantly higher in malignant lesions (p < 0.05).
Mediastinal and hilar lymphadenopathy (LAP) and emphysematous lung parenchyma, especially in the upper zones, were found to be significantly higher in malignant lesions (p < 0.05). Also, the presence of being an active smoker or having quit less than one year before was statistically significantly higher in malignant nodules compared to benign nodules (p < 0.05).
Size of nodules and mediastinal and hilar lymphadenopathies were statistically significantly larger, PET SUVmax values of nodule/mass and mediastinal and hilar LAP were statistically significantly higher, and minimum, maximum, and mean values of ADC of mass/nodule in MR DAG were statistically significantly lower in malignant nodules compared to benign nodules (p < 0.05).
There was statistically significant moderate negative correlation between PET-SUVmax and minimum, maximum, and average DAG-ADC values of lung mass/nodule and a statistically significant weak negative correlation between PET-SUVmax and DAG-ADS values of mediastinal and hilar lymphadenopathies (p < 0.05) (Table 2).
Table 2
Correlation between PET-SUVmax and DAG-ADC values
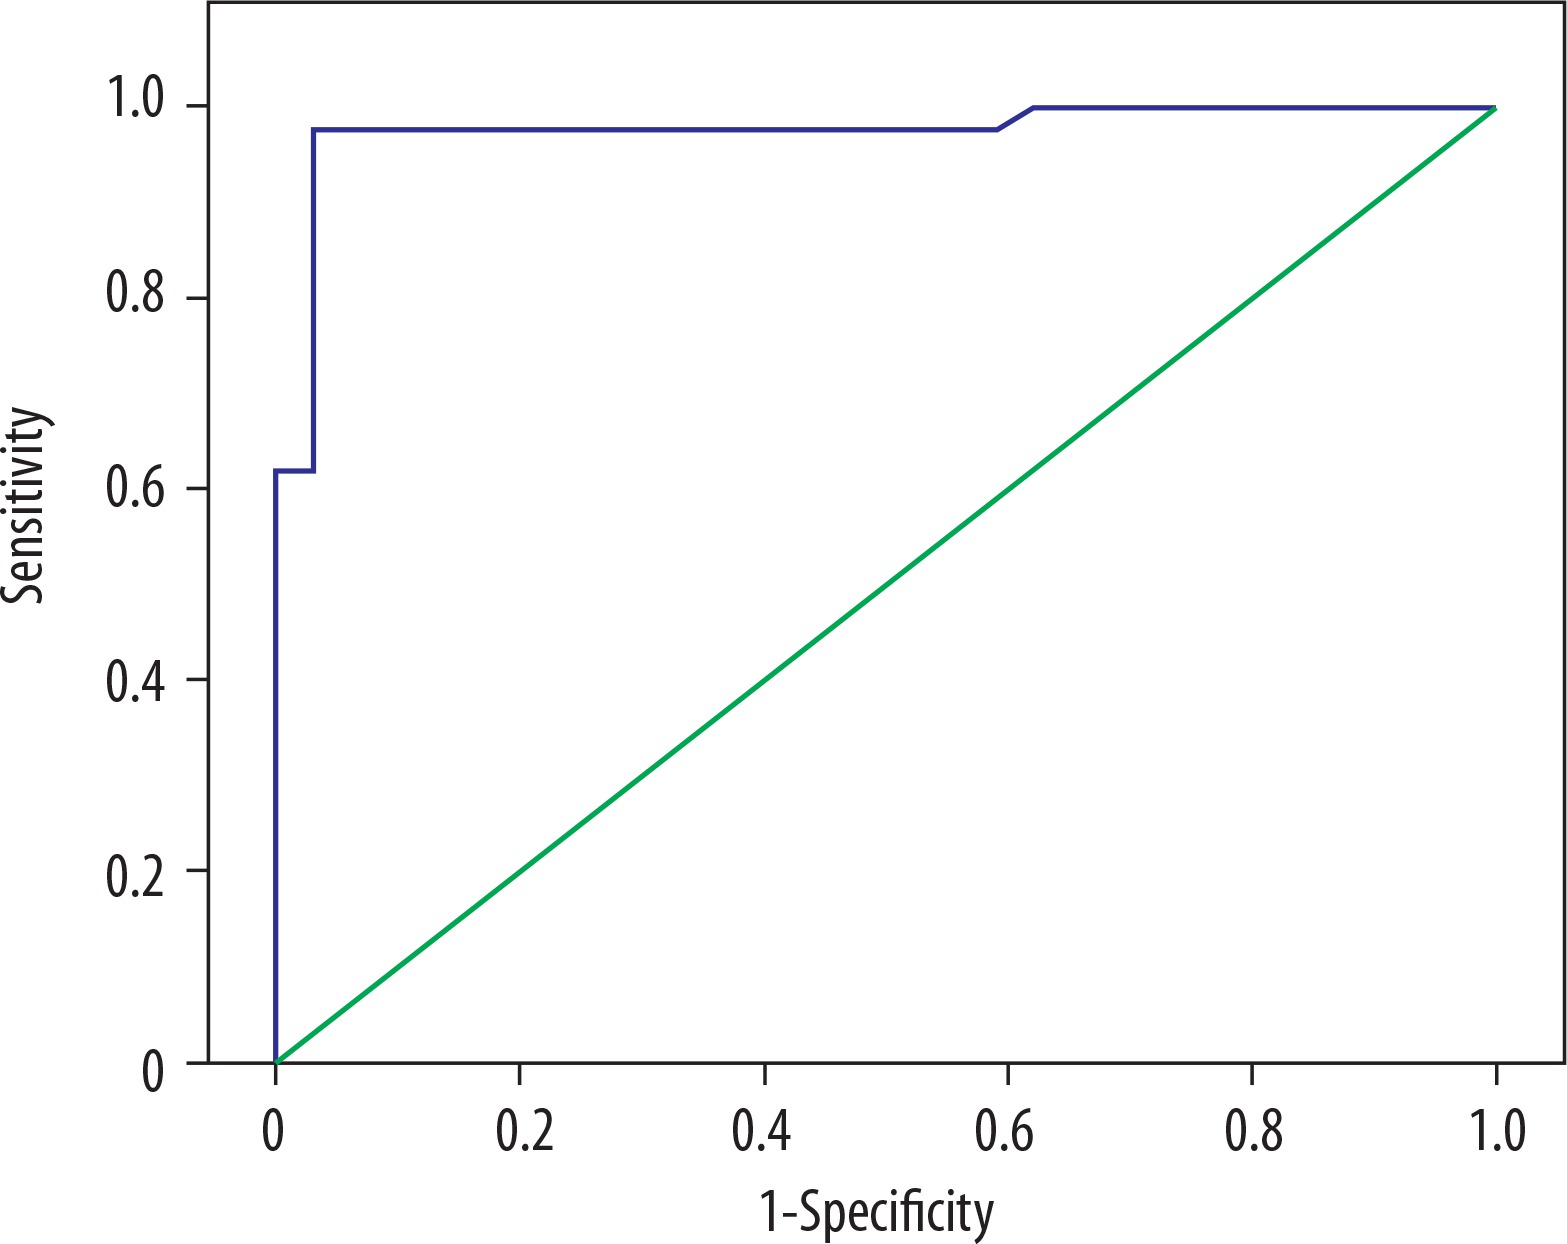
In ROC analysis of PET SUVmax of lung mass/nodule, the area under the curve was 0.962 ± 0.023 (p = 0.0001), the cut-off value was 3.75, sensitivity for values above the cut-off was 94.1%, specificity was 92.9%, positive predictive value was 91.4%, and the negative predictive value was 95% (Figure 3).
Figure 3
ROC analysis of PET SUVmax of lung mass/nodule for the distinction of benign and malign nodules

In ROC analysis of DAG-ADC min, the area under the curve was 0.975 ± 0.018 (p = 0.0001), the cut-off value was 1.143, sensitivity for values below the cut-off was 97.1%, specificity was 97.6%, positive predictive value was 97.1%, and the negative predictive value was 97.6% (Figure 4).
Discussion
DAG targets the diffusion status of water molecules in tissue. In any structural change in the ratio of intracellular and extracellular water molecules, the diffusion of water causes a change in the DAG signal because it will be disrupted by intracellular macromolecules and organelles [10]. The quantitative evaluation of diffusion is possible with the calculated ADC value based on the proportion of extracellular and intracellular components in DAG [11]. The ADC value tends to be low in malignant lesions due to increased tissue density and cellularity [12]. In addition, intracellular cytoskeleton, organelles, soluble macromolecules, and matrix fibres also affect the diffusion limitation in addition to cell membranes; thus, ADC values are expected to be different in different histopathological circumstances [13]. 18F-FDG PET/CT evaluates the glucose metabolism in tumours by measuring the administered marked form of glucose that is not metabolised and therefore accumulates in vital cells. Increased FDG uptake reflects the high metabolic activity of the tumour due to increased glycosylation in malignant tumours [14].
In this prospective study evaluating pulmonary nodules, the incidence of benign lesions was more frequent than that of malignant lesions. The findings favouring malignancy were consistent with the results of other studies [15]. However, results in our study favouring central localisation of the malignant lesions was incompatible with some studies in the literature [15,16]. This difference may be due to the limited number of our sample. Emphysematous changes seen in the upper zones in malignant lesions, which were significantly more frequent than the patients with benign lesions, and higher frequency of malignant lesions in our study in active smokers and smokers up to the preceding year, support the relationship of centrilobular emphysema seen in upper zones with smoking.
The comparison of DAG-ADC and PET-SUV values, which was the aim of our study, showed that SUV values were significantly higher in malignant lesions and hilar-mediastinal LAPs, while ADC values were shown to be significantly lower, consistent with the literature [17-21]. In our study, we obtained higher sensitivity, positive predictive value, and negative predictive values compared to Liu et al.’s study, in the differentiation of malignant nodules from benign nodules, below the cut-off value of 1.143 in the ROC analysis for DAG-ADC min [21]. In a study by Regier et al. comparing 41 non-small cell lung cancer patients with PET-SUV max values and DAG-ADC min values, a strong inverse correlation was found [22]. The relationship between SUV and ADC values was also found in different studies of different types of cancer, such as rectal carcinoma [23] and brain metastasis [24]. When the relationship between ADC min and SUV values was evaluated we found a moderate correlation between them.
In the ADC evaluation of pulmonary cancer subtypes, in Matoba et al.’s study [19] with 30 lung cancer patients, the ADC values of adenocarcinomas were higher than values of squamous cell carcinoma and large cell carcinomas, and well-differentiated adenocarcinomas had higher values that poorly differentiated ones. In other studies [25], small cell lung cancers had higher ADC values than adenocarcinoma and squamous cell carcinomas. In our study, ADC values of adenocarcinomas had higher ADC values than other lung cancer types, as reported in the study by Matoba et al.; however, despite the high number of total patients in our study, the relatively small number of patients with malignant nodules was a limitation. One technical limitation was motion-induced artefacts that caused image distortion, which made the evaluation difficult.
Conclusions
Based on this prospective study, we can say that DAG-MRI has similar success with PET in the differentiation of benign versus malignant pulmonary nodules with a diameter greater than 1 cm. Although the sensitivity and specificity of the cut-off values we found in our study were higher than in similar studies, we think that more comprehensive studies should be performed to determine a cut-off value and to evaluate the change of ADC values among the subtypes of malignant lesions.