


Introduction
Chronic obstructive pulmonary disease (COPD) is one of the leading causes of morbidity and mortality worldwide. At present, it is the fourth most common cause of death among adults [1]. COPD was underdiagnosed in India, but is now recognised in 4-10% of the adult male population in several Asian countries [2]. Pulmonary function test is the accepted and standardised method for the diagnosis and severity assessment of COPD. The two entities of COPD, namely chronic bronchitis and emphysema, often occur together, and it is difficult to differentiate between the two clinically as well as with the pulmonary function test (PFT). In contrast to the PFT, radiological techniques allow for differentiation between different components of the obstructive lung disease on a regional basis [3]. The improved clarity and sharpness of parenchymal abnormalities on high-resolution computed tomography (HRCT) scans provides valuable information about the presence and extent of the disease.
While studies have shown that HRCT is the most accurate imaging method for diagnosing emphysema [4,5], in vivo quantification methods are laborious and often impractical in the course of routine work [6]. Hence, we have planned to do this study using qualitative scoring for emphysema in a different way, which can easily be adapted to the daily reporting, and also to include other quantitative parameters of overinflation which can be quickly measured without the need for any additional software. In addition, a preliminary look at values in our population (compared with western literature) suggests that various measurements of over inflation calculated in HRCT are different in our population, and little has been mentioned in the literature regarding this. The aim of the study was to evaluate the role of HRCT in the prediction of presence and severity of COPD, based on PFT. The objectives were to correlate the various quantitative and qualitative indices of COPD in HRCT with PFT values and to derive at the threshold values for various quantitative HRCT indices of COPD, for the Indian population.
Material and methods
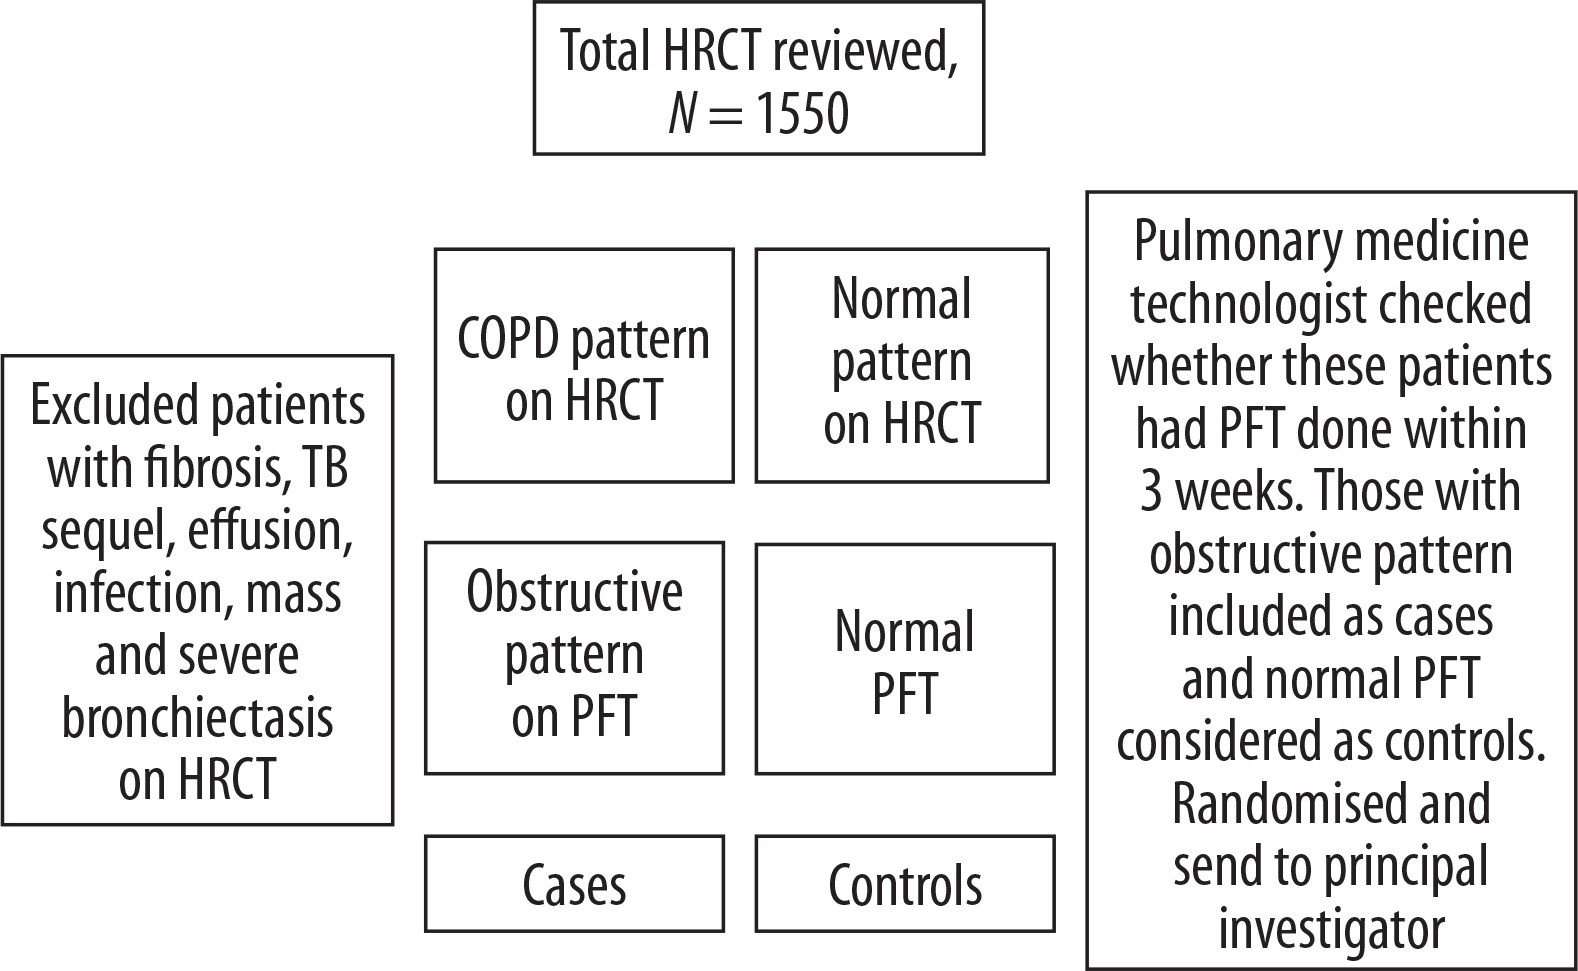
This was a descriptive cross-sectional study conducted in departments of Radiodiagnosis and Pulmonary Medicine in a tertiary referral hospital in South India. Retrospective and prospective evaluation of HRCT in patients, during one year, who have obstructive pattern on PFT were done. Patient selection is detailed in Table 1.
According to the Global Initiative for Obstructive Lung Disease (GOLD) classification, COPD is defined as FEV1/FVC (forced expiratory volume in 1 second/forced expiratory volume) < 70% and categorised into mild, moderate, severe, and very severe based on post bronchodilator FEV1 ≥ 80%, < 80%, < 50%, and < 30%, respectively. The principal investigator along with the senior radiologist (> 15 years’ experience) reviewed the various qualitative and quantitative indices of COPD on chest X-ray and HRCT.
Quantitative parameters:
length of anterior junction line – measured from the posterior surface of the sternum to the point where the pleural folds deviated in the shape of an inverted Y (Figure 1A);
sternoaortic distance – measured from the posterior surface of the sternum to the line drawn along the anterior margin of the ascending aorta (Figure 1B);
thoracic cage ratio – obtained by calculating the ratio of the anteroposterior diameter to the transverse diameter of the inner thorax. Four measurements of the thoracic cage ratio (TCR) were made: the first two at the aortic arch level and the next two at the inferior pulmonary vein level. At both levels, two anteroposterior (AP) measurements were made. The first AP measurement was obtained by measuring the maximum anteroposterior diameter of the right lung. The second AP measurement was done by drawing a line in the midline connecting the posterior margin of the sternum to the anterior margin of the body of the thoracic vertebrae (Figure 1C);
thoracic cross-sectional area/square of height – ratio of the thoracic cross-sectional area to the square of the patient’s height. The thoracic cross-sectional area (TCSA) was assessed by using the area tool for polygonal shape, available in the post-processing option in PACS. Two measurements were taken, one each at the aortic arch level and inferior pulmonary vein level. The average of the right and lung cross-sectional areas at each level was calculated. Then the ratio of the average thoracic cross-sectional area to the square of patient’s height was obtained (Figure 1D);
tracheal index – ratio of anteroposterior to transverse diameter of the trachea taken at the level of 1 cm above the aortic arch.
Qualitative parameters:
qualitative scoring – using Goddard’s method [7], the percentage of emphysematous area was categorised into four grades; 1-25% – grade 1, 26-50% – grade 2, 51-75% – grade 3, and 75-100% – grade 4 (Figure 2A-C). The HRCT lung section with the most emphysema was selected, one each from the right upper lobe, right middle lobe, right lower lobe, left upper lobe, lingula, and left lower lobe, and they were graded according to Goddard’s method. The maximum score for each lung was 12 and for the entire lung was 24. Combined scores of both upper lobes, middle lobe and lingula and both lower lobes were also calculated to assess the regional distribution;
presence of peribronchial thickening – assessed in each of the six lobes; A score of 1 was given when it was present, thus amounting to a maximum score of 6 for the entire lung (Figure 2B);
presence of bronchiectasis – assessed in each of the six lobes; a score of 1 was given when it was present, thus amounting to a maximum score of 6 for the entire lung;
presence of inhomogeneous attenuation – assessed in each of the six lobes; a score of 1 was given when it was present, thus amounting to a maximum score of 6 for the entire lung (Figure 2D).
Patient details including height, weight, and smoking status were recorded. Pulmonary function test was performed in the Master Screen Jaeger PFT system in the department of Pulmonary Medicine. The pulmonary function test included spirometry, lung volume measurements, and diffusion lung capacity assessment. The physiological indices measured were as follows: forced vital capacity (FVC), forced expiratory volume at one second, peak expiratory flow rate, diffusion lung capacity for carbon monoxide (DLCO), residual volume (RV), and total lung capacity (TLC). FEV1/FVC, RV/TLC, and DLCO/alveolar volume (VA) were calculated from these measurements. Spirometric indices were calculated using the best out of three technically satisfactory performances according to the recommendations of the American Thoracic Society [8].
Figure 1
High-resolution computed tomography section of the thorax demonstrating quantitative parameters of chronic obstructive pulmonary disease. A) Anterior junction line, B) sterno-aortic distance, C) thoracic cage ratio, D) thoracic cross sectional area
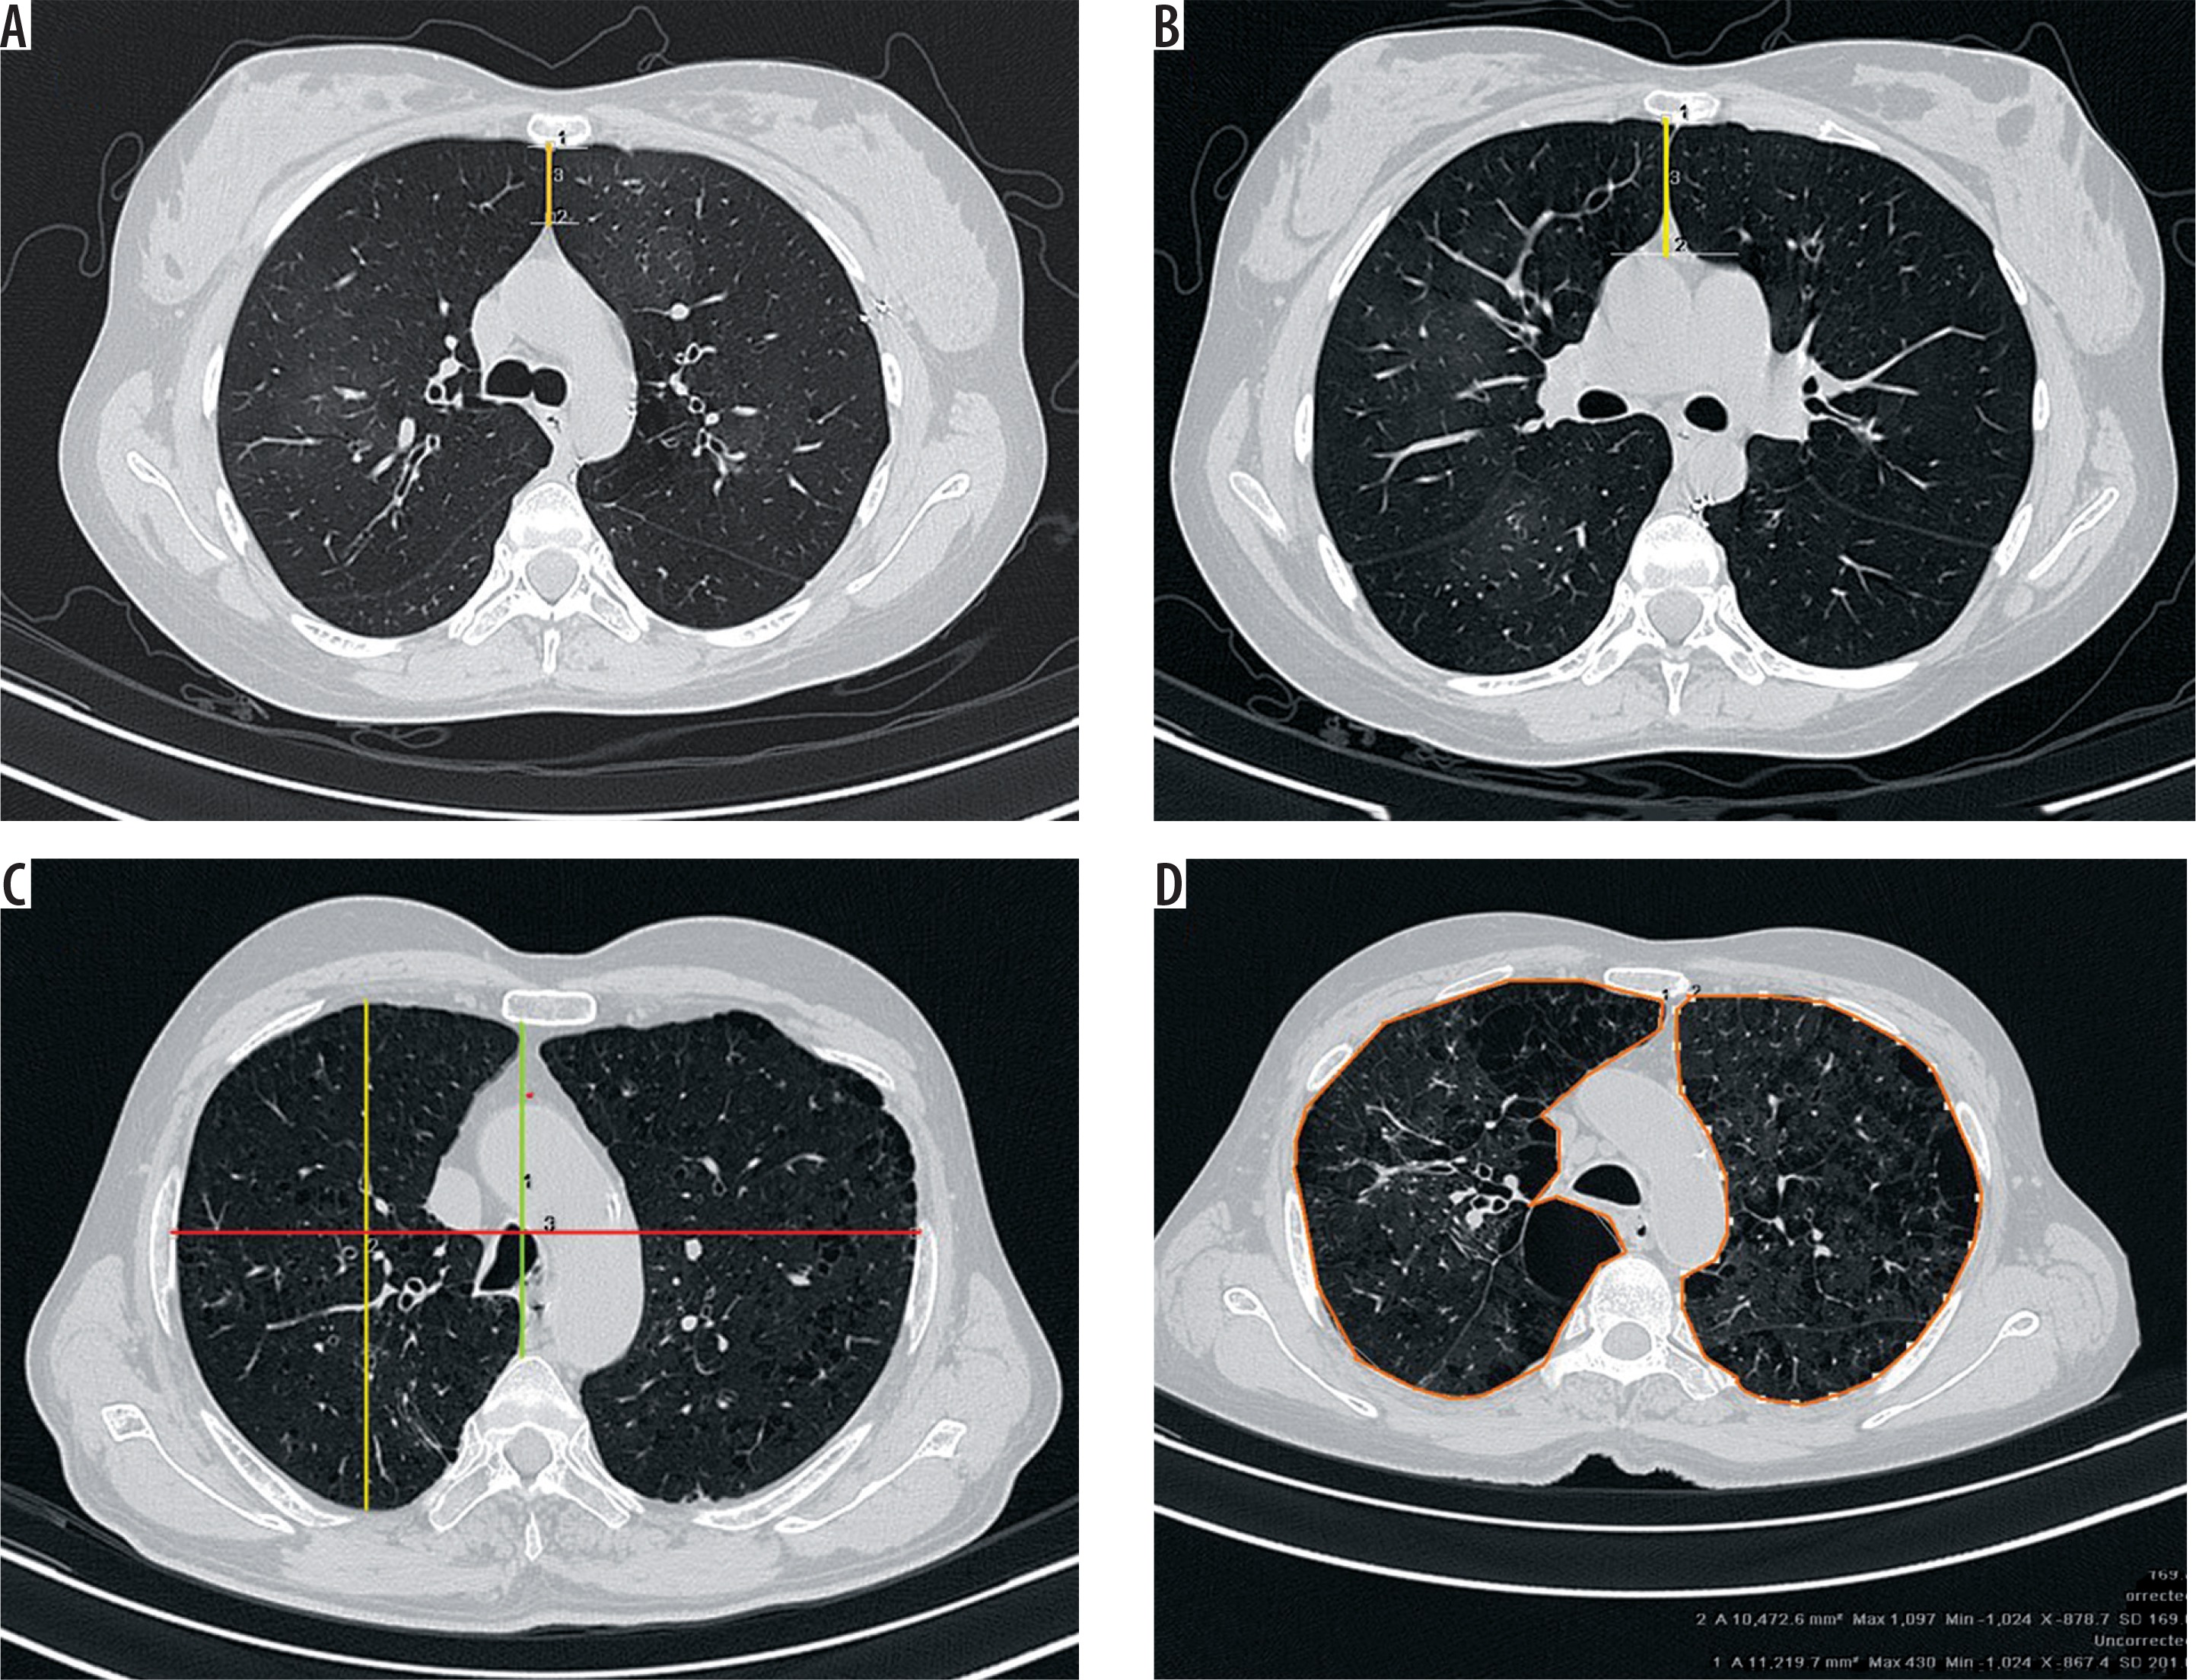
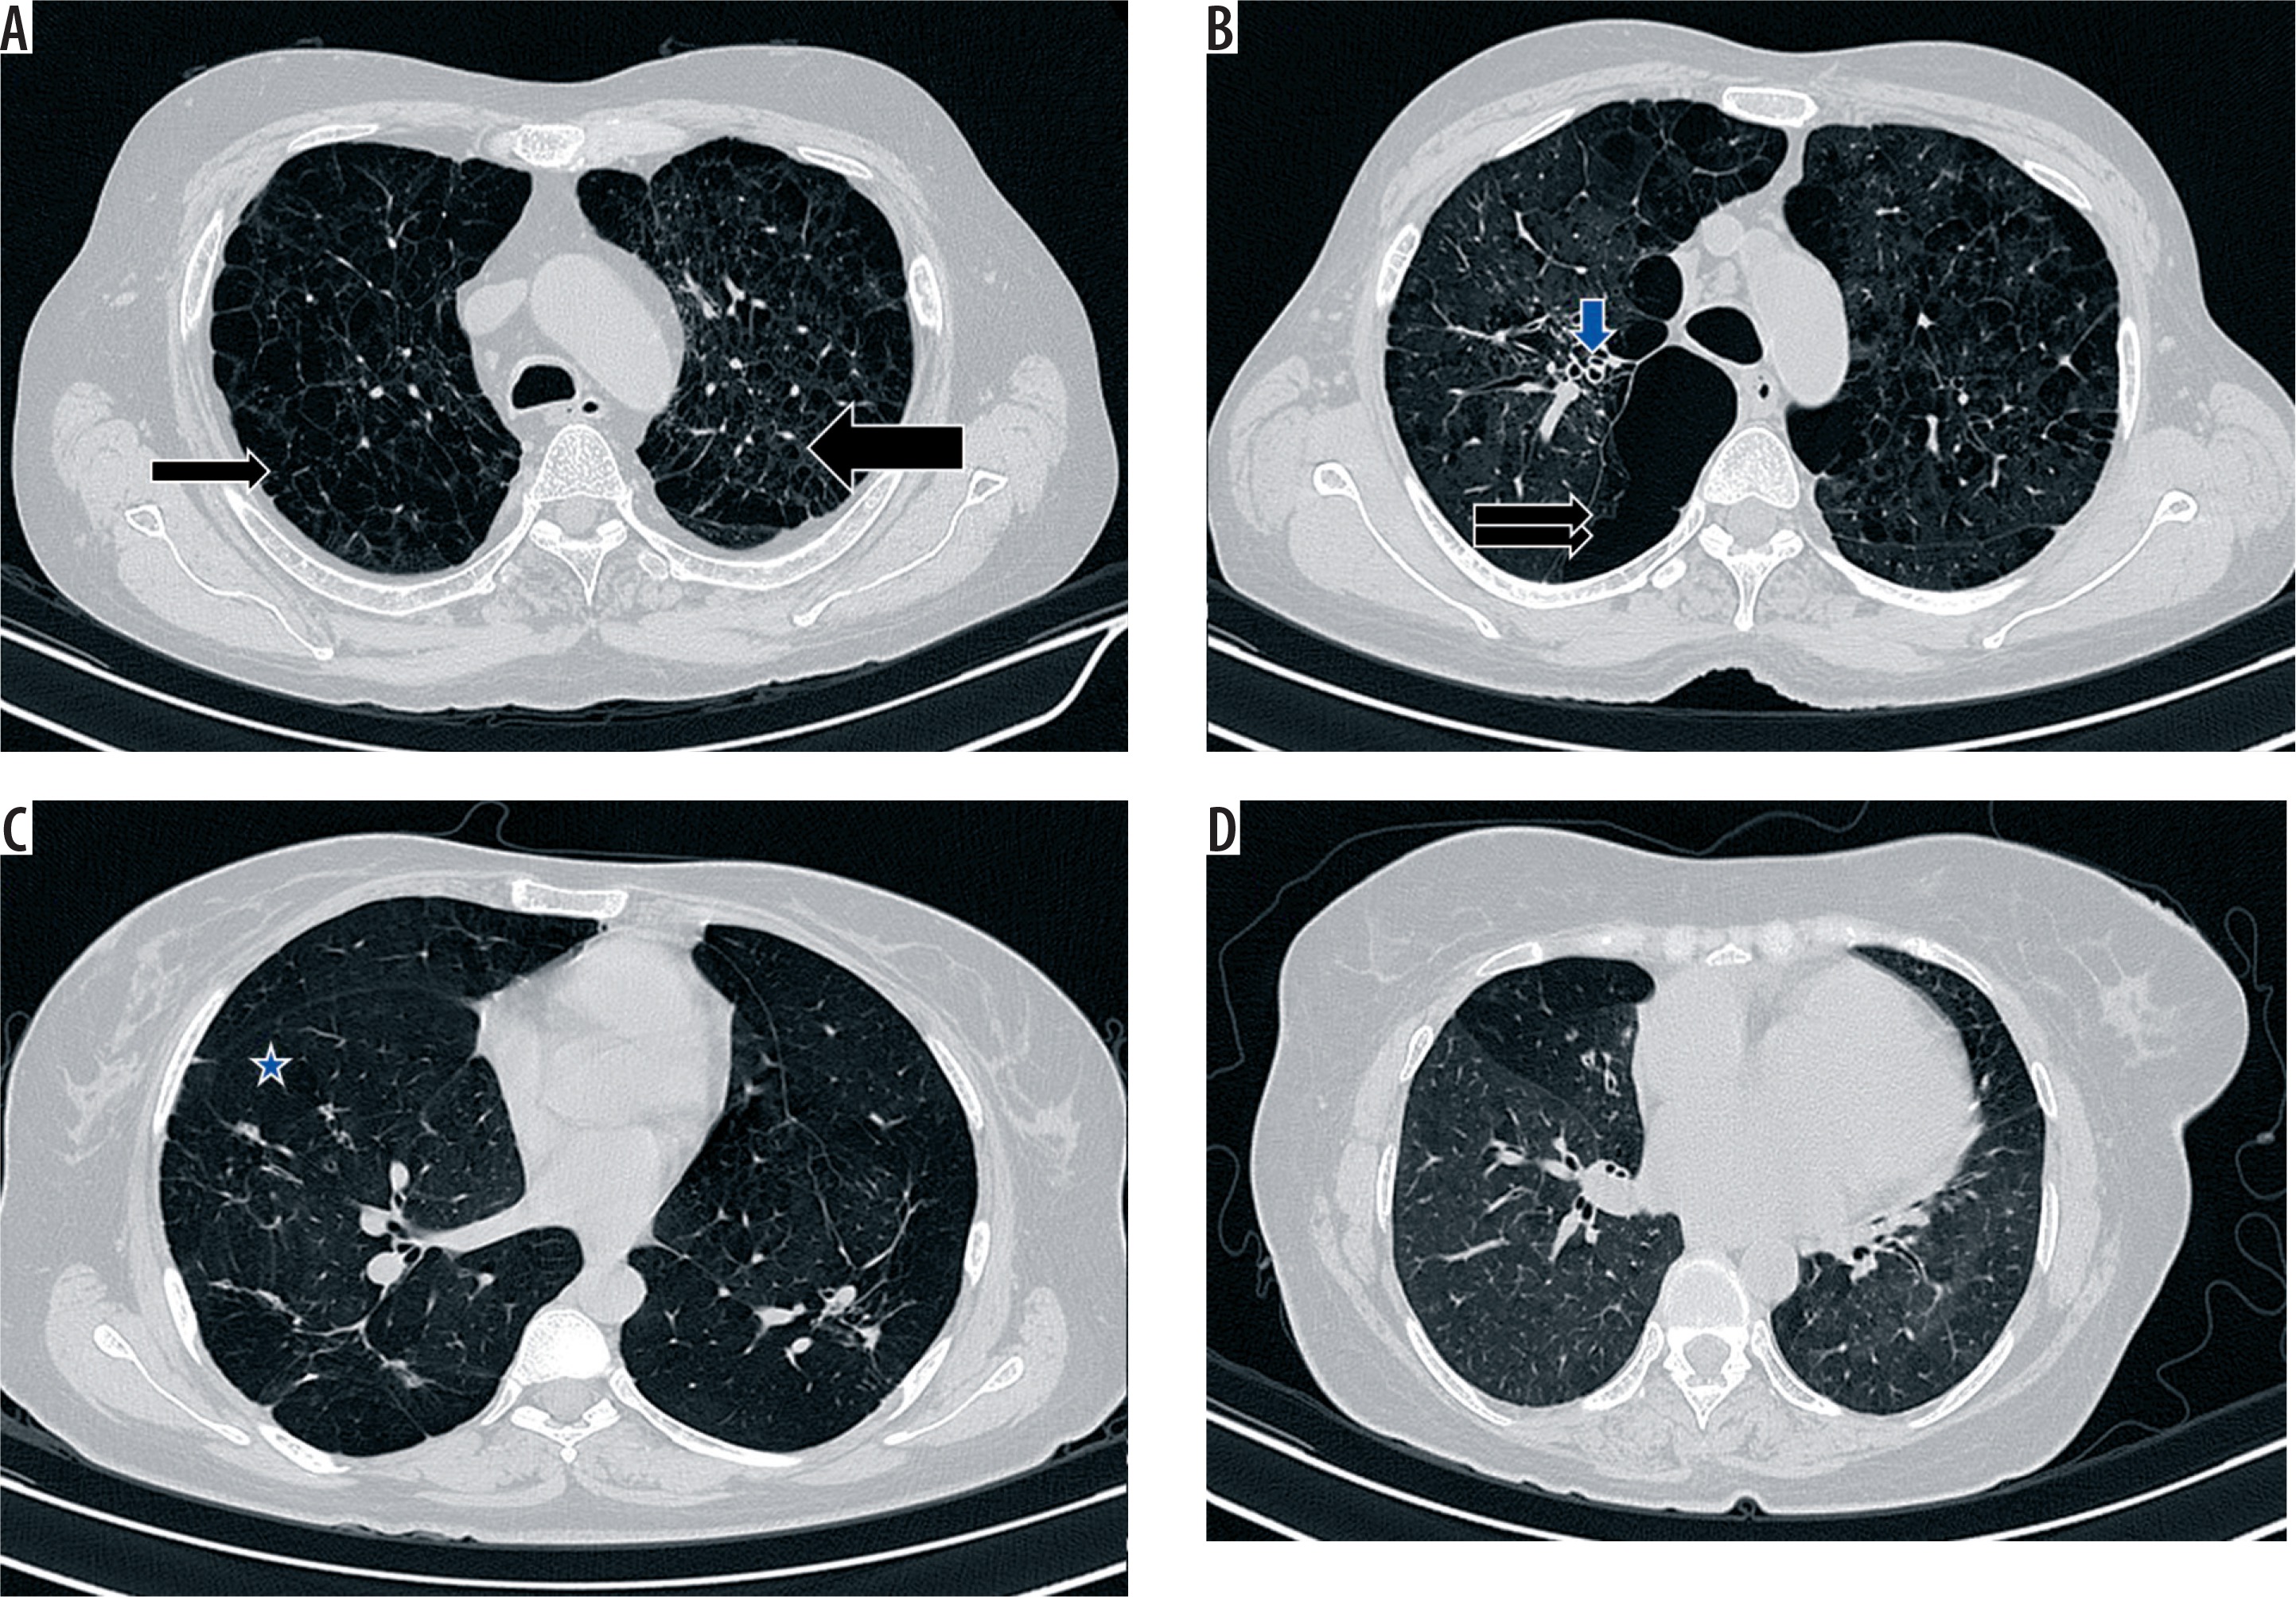
Figure 2
High-resolution computed tomography section of the thorax demonstrating qualitative parameters of chronic obstructive pulmonary disease. A) Paraseptal emphysema (thin arrow) and centriacinar emphysema (thick arrow), B) bullous emphysema (double arrows) and peribronchial thickening (blue arrow), C) panacinar emphysema (asterisk), D) presence of inhomogeneous lung attenuation
Statistical analysis
Continuous variables were assessed for normality of distribution using the Shapiro-Wilk test and presented as mean ± standard deviation, range as appropriate. Student’s t test was used for comparisons of continuous variables. Correlations between continuous variable were assessed using either the Pearson or Spearman correlation coefficient, as appropriate. Statistical analysis was performed using SPSS version 16.0 for Windows (SPSS, Chicago, IL).
Results
High-resolution computed tomography
Out of 128 subjects, 90 were cases and 38 were controls. There were 105 males and 23 females. Among the 90 cases, 58 were smokers, whereas among the 38 cases, only seven were smokers. There were significantly more smokers among the cases. DLCO and DLCO/VA were only done in 11 patients, and RV, TLC, and RV/TLC were done only in 10 patients. Among the 90, there were 18 mild, 33 moderate, 19 severe, and 20 very severe cases. The demographic, PFT, and various quantitative parameters for cases and controls are given in Table 2.
Table 2
Comparison of spirometric and quantitative high-resolution computed tomography parameters between cases and controls
[i] FVC – forced vital capacity, FEV1 – forced expiratory volume in 1 second, FEV1% – forced expiratory volume for 1 second expressed as a percentage of the forced vital capacity, PEFR – peak expiratory flow rate, DLCO – diffusion lung capacity for carbon monoxide, VA – alveolar volume, RV – residual volume, TLC – total lung capacity, TCR – thoracic cage ratio, TCSA – thoracic cross-sectional area
There were significant differences between the cases and control groups for spirometric indices and in the quantitative parameters of HRCT, except sterno-aortic distance. The frequency of emphysema pattern among cases is given in Table 3.
Table 3
Frequency of emphysema pattern among the cases
Typing of the emphysema was not possible in eight cases, in which there was either focal or diffuse reduction in attenuation with no vascular alteration, hence it was difficult to categorise them as panacinar variety.
Qualitative parameters of chronic obstructive pulmonary disease in high-resolution computed tomography
The correlations of various qualitative parameters with the variables of pulmonary function test are given in Table 4.There was significantly strong correlation between the total score for the entire lung and physiologic parameters like FVC, FEV1 [actual], FEV1% (forced expiratory volume for 1 second expressed as a percentage of the forced vital capacity), FVC%/FEV1, and PEFR (peak expiratory flow rate). Separate total scoring for the right and left lung separately also showed significant strong correlation with FVC, FEV1 [actual], FEV1%, FVC%/FEV1, and PEFR. Correlation with the spirometric indices was also assessed for upper lobes, middle lobe/ lingula, and lower lobes separately, to look for regional heterogeneity. Moderate to strong significant correlation was noted between the middle lobe/lingula as well as lower lobe scores and lower lobe scores with FVC, FEV1 [actual], FEV1%, FVC%/FEV1, and PEFR. However, a significant but weak correlation was noted between the upper lobe scores and various spirometric indices.
Table 4
Correlation between qualitative high-resolution computed tomography parameters and pulmonary function test
[i] FVC – forced vital capacity, FEV1 – forced expiratory volume in 1 second, FEV1% – forced expiratory volume for 1 second expressed as a percentage of the forced vital capacity, PEF – peak expiratory flow, DLCO – diffusion lung capacity for carbon monoxide, VA – alveolar volume, RV – residual volume, TLC – total lung capacity
Correlation with pulmonary function test was also assessed for qualitative parameters of chronic bronchitis like presence of peribronchial thickening, bronchiectasis, and inhomogeneous attenuation. Significant but weak correlation was noted between the inhomogeneous attenuation and the various spirometric parameters.
Quantitative parameters of chronic obstructive pulmonary disease in high-resolution computed tomography
The correlation of various quantitative parameters with the pulmonary function test variables are given in Table 5.The length of the anterior junction line showed strong correlation with the RV/TLC; however, the number of cases and controls who underwent lung volume assessment was lower. Weak correlation was observed with FEV1%, FEV1%/FVC, and PEFR. The sternoaortic distance did not show any correlation with any of the spirometric variables.
Table 5
Correlation between quantitative high-resolution computed tomography parameters and pulmonary function test
[i] FVC – forced vital capacity, FEV1 – forced expiratory volume in 1 second, FEV1% – forced expiratory volume for 1 second expressed as a percentage of the forced vital capacity, PEF – peak expiratory flow, DLCO – diffusion lung capacity for carbon monoxide, VA – alveolar volume, RV – residual volume, TLC – total lung capacity
Pearson’s correlation coefficient test was done to look for correlation of thoracic cage ratio with the pulmonary function indices. Thoracic cage ratios at aortic arch and inferior pulmonary levels showed weak but significant correlation with FEV1, FEV1/FVC, and PEFR. Moderate correlation with FEV%/FVC and weak correlation with PEFR was observed with average cross-sectional area/square of height taken at the inferior pulmonary vein level.
Tracheal index showed significant strong correlation with the RV/TLC variable alone; however, the observed correlation is of questionable significance because the number of patients who underwent RV/TLC is too low. Correlation between patient’s height and various HRCT quantitative parameters was found to be not significant.
Calculating the threshold values for various quantitative parameters in ROC curve was performed for various quantitative parameters such as length of anterior junction line, thoracic cage ratio, and thoracic cross sectional area, and it was found to be significant. The sensitivity and specificity for the threshold value as well as values corresponding to 100% specificity derived from our study are given in Table 6.
Discussion
The advantage of HRCT over pulmonary function test is that even the milder forms of emphysema with normal spirometric indices can be detected on HRCT. Secondly, regional variation of the emphysema can also be identified. The main observation in emphysema is that of the presence of decreased attenuation areas (less than –910 HU) with a decrease in the diameter and number of pulmonary vessels in the area of the emphysema. The indication of HRCT in a patient with suspected COPD is to exclude other obstructive lung diseases. The available threshold values for various quantitative parameters are from western literature and may not be applicable to the Indian population, as is evident from this study.
The present study differs from the previous studies in the objectives achieved as well as in the methodology. The methods we used in the evaluation of HRCT are simple and can be easily adapted to a regular reporting system. Most of the previous studies have used quantitative evaluation of emphysema using a special software program known as the “density mask” program. This requires additional expense and is time consuming and laborious [5]. It may thus not be feasible to adapt this method to a daily reporting protocol, hence was not used in our study.
Qualitative evaluation of chronic obstructive pulmonary disease on high-resolution computed tomography
There were six cases that had diffuse reduction in attenuation of lung fields and two cases that had focal reduction in attenuation; however, as the emphysematous areas were difficult to identify from the surrounding lung fields qualitative scoring could not be done in these patients. Panacinar emphysema was the most common subtype of emphysema in our study, in contrast to centriacinar emphysema being the most common in the study done by Gupta et al. [9]. Unlike the study by Goddard et al. [7], in which eight scans were performed from the apex to the base, we selected one representative section of emphysema from each lobe, and the visual scoring according to Goddard’s method was done. Bergin et al. [5] calculated a subjective emphysema score for the entire lung and also for the lobes separately. Miniati et al. [10] used six hemislices obtained at three anatomical lung levels: the top of the aortic arch, the origin of the lower lobe bronchus, and 3 cm above the top of the diaphragm. Gurney et al. [6] assessed entire lung fields for the subjective scoring of emphysema. All the different methods for qualitative scoring of emphysema on HRCT have shown correlation with PFT.
There was significant correlation between the qualitative scoring for entire lung, right and left lung separately, and the lobes separately with the spirometric indices. The scoring for the middle lobe/ lingula and lower lobes demonstrated a better correlation with spirometry than the upper lobe scores. Gurney et al. [6] and Haraguchi et al. [11] showed that lower zone parameters have stronger correlation with DLCO and lung volumes than upper zone parameters. However, we did not find any significant correlation between qualitative scoring and diffusing lung capacity and lung volumes.
We also evaluated the qualitative indices of chronic bronchitis like peribronchial thickening, bronchiectasis, and inhomogeneous attenuation of the lung; however, these features are highly non-specific as can be seen in other airway diseases. Aziz et al. [12] assessed the airway abnormalities associated with emphysema by measuring the bronchial wall thickening, and the extent and severity of bronchiectasis. In their study Gupta et al. [9,13] included features like vascular attenuation, vascular distortion, mosaic attenuation, and directly visible small airways and found significant correlation with spirometric indices. Around 29% of patients in the study done by Brien et al. [14] had bronchiectasis, predominantly of tubular type. We excluded patients with more than mild bronchiectasis because we thought that the bronchiectasis itself might cause an obstructive pattern in PFT, and it would be difficult to distinguish COPD-related bronchiectasis from primary bronchiectasis.
Quantitative evaluation of chronic obstructive pulmonary disease on high-resolution computed tomography
Among the quantitative markers, the thoracic cage ratio showed significant correlation with spirometric indices. The thoracic cage ratio measurements at aortic arch level and inferior pulmonary level showed significant correlation with spirometry. The threshold value obtained for the thoracic cage ratio at the aortic arch level was 0.6, which has a sensitivity of 81% and specificity of 50%. Gupta et al. [9] used a threshold value of 0.75 for measurements at the carina as well as 5 cm below the carina. Only 13 patients in our study had a TCR above 0.75 at the aortic arch level, two of whom were controls. According to our study, a value greater than or equal to 0.78 will give a specificity of 100%. At the inferior pulmonary level the generated ROC was not significant enough to calculate a threshold value.
The length of the anterior junction line showed strong correlation with RV/TLC in our study. Significant correlation was also found with most of spirometric variables. Hagen et al. [15] observed that 10 of the 22 patients had an AJL length greater than 3 cm, but this was not seen in any of the control groups. Based on the ROC generated from our study, a threshold value of 2.99 cm showed a sensitivity of only 4%, but the specificity was near 100%. In our study, only four of the 128 patients showed an AJL length of more than 3 cm. Two had very severe obstruction on spirometry and the other two cases were of moderate stage. The generated ROC curve showed a threshold value of 1.3 cm to be a better cut-off point because it had a sensitivity of 61% and specificity of 78%. For threshold values above 2.99 cm, the specificity was 100%. A sterno- aortic distance of more than 4 cm was seen only in 11 out of 128 patients, including two controls. The threshold value could not be calculated from our study as the ROC was not significant. Only 5 out of 40 cases had sterno-aortic distance more than 4 cm in the study done by Gupta et al. [9]. However Hagen et al. [15] observed that 16 of the 22 patients had sterno-aortic distance more than 4 cm, but this was not seen in any of the control groups.
The thoracic cross-sectional area/square of the patient height taken at aortic arch showed no significant correlation with spirometry, whereas that calculated at the inferior pulmonary vein level showed correlation with spirometry, except for FVC. Kasai et al. [16] suggested that in the group with grade IV dyspnoea, the TCSA/Ht2 ratios were significantly greater than those in the groups with grade II and III dyspnoea combined. TCSA/height² taken 1 cm below the aortic arch more than 80 cm²/m² was present in 28 out of 40 patients in the study conducted by Gupta et al. [9]. Forty-three of the cases and eight of the controls in our study showed TCSA/height² more than 80 cm²/m². The threshold value for TCSA/height², taken at aortic arch level of 73 cm²/m², has a sensitivity of 77% and a specificity of 74%. Values above or equal to 92 cm²/m² showed 100% specificity based on our study. TCSA/height² was not calculated at the inferior pulmonary level in any of the other studies. Based on our study, the generated ROC showed the threshold value of 84.7 cm²/m² to have a sensitivity of 85% and specificity of 55%. Values above or equal to 108 cm²/m² showed 100% specificity. Only five of the 128 patients had tracheal index less than 0.67 in our study as compared to 35% in the study by Gupta et al. [13]. The tracheal index showed strong correlation with RV/TLC in our study. However, only 11 patients underwent lung volume measurements in our study. Probably, if the numbers were high, more significant correlation with lung volume measurements could have derived.
Limitations
The number of patients who underwent diffusion lung capacity and lung volume measurements was low, hence only a few of the qualitative and quantitative parameters showed significant correlation with them. The number of cases was lower than the sample size calculated, due to unexpected exclusions because of associated findings of infection, fibrosis, and pleural effusion, because they can also influence the pulmonary function test. Interobserver variations in the assessment of qualitative and quantitative parameters were not assessed in this study.
Conclusions
Based on our study, we found that quantitative parameters such as the thoracic cage ratio taken at aortic arch and inferior pulmonary levels and the thoracic cross sectional area/height² taken at the inferior pulmonary vein level showed correlation with spirometry, whereas the length of the anterior junction line and tracheal index showed a correlation with lung volume measurements. Qualitative scoring of emphysema on HRCT showed significant correlation with spirometry and could be used to predict the severity. For the Indian population the threshold values for various HRCT quantitative parameters are lower than those seen in the western population. Thus, HRCT plays distinctive and defined roles in the evaluation of chronic obstructive lung disease. HRCT is indicated to exclude other causes of obstructive lung disease and can be used to predict the severity of emphysema.