


Introduction
Metabolic imaging using fluorine-18-fluorodeoxyglucose (18F-FDG) positron emission tomography (PET) with integrated computed tomography (CT) (18F-FDG PET/CT) is now the standard of care in clinical oncology. It has been used successfully for staging, restaging, patient stra-tification, and treatment response planning and prediction [1,2]. Lymphoma is a heterogeneous type of disease that arises from the constituent cells of the immune system or from their precursors that arise in lymph nodes close to any organ or tissue in the body. Therefore, all organ systems may be involved at some stage of the disease including the central nervous system, head and neck, thorax, abdomen, gonads, bone, and others [3,4].
CT is the most often used imaging modality for staging malignant lymphoma due to its excellent availability and relatively low cost [5], but sometimes CT impedes identification of disease in normal-sized organs and detection of lesions that have poor contrast with the surrounding tissues. Another reason is that CT is not effective in diagnosis lymphoma with less reliability. It can detect bone marrow infiltration (BMI) in the late stage of the disease [6].
PET/CT has been validated to assess patients with different types of malignant tumours, including lymphomas, despite its relatively high cost [7]. The incidence of marrow disease varies with the histological subtype of lymphoma. Bone marrow biopsy is fundamental in identifying marrow involvement for therapy purposes [8]. Marrow diseases can be diagnosed with 18F-FDG PET/CT scan and the visual interpretation of marrow features of FDG uptake throughout the whole body. PET scans can efficiently determine marrow disease status in a high proportion of lymphoma patients. Therefore, PET has the potential to reduce the guide for staging marrow biopsy [9]. However, interobserver variability remains a limiting factor in qualitative image analysis.
The sensitivity of FDG PET scan is similar to bone marrow biopsy (pathological sample) that confirms that PET scan is essential during the staging of lymphomas [10,11]. This result, if confirmed, will provide two identical methods for diagnosis of lymphomas. However, the use of 18F-FDG PET/CT in the sole assessment of the bone marrow and whether it can replace bone marrow biopsy is still controversial, and thus investigation with PET/CT scan through image analysis is potentially advised [5]. However, it could be useful to strengthen the diagnostic power of PET imaging through sophisticated data analysis using the diverse capabilities of PET texture analysis.
The aim of this study was to explore whether the textural features are able to provide diagnostic information of BMI in patients with lymphoma using 18F-FDG PET/CT.
Material and methods
Patients
Forty-four patients (43.2, 56.8% male) who were diagnosed with lymphoma were retrospectively retrieved from our data records. The retrospective nature of the study obviated the need to ask for patient consent. Ethical approval was obtained to perform the study. The inclusion criteria were those patients who had not had prior treatment before initial 18F-FDG diagnosis. Bone marrow involvement were confirmed by two clinical observers who have 5 and 10 years of experience in reading and interpretation of 18F-FDG PET/CT. The number of patients who had BMI was 18 (41%), as agreed by the two observers. Patients’ demographics and characteristics are combined and summarised in Table 1.
Table 1
Clinical characteristics and acquisition parameters of the study population
Fluorine-18-fluorodeoxyglucose positron emission tomography computed tomography image acquisition
Patients fasted for six hours and had serum glucose concentration < 200 mg/dl before the intravenous injection of 185-370 MBq of 18F-FDG (0.1 mCi/kg of body weight). 18F-FDG PET/CT was performed using a Gemini 64 LXL PT/CT scanner (Philips Healthcare) in seven patients, whereas in five patients it was performed on a Gemini 64 TF TOF PT/CT (Philips Healthcare). The remaining 32 patients were imaged on a Biograph 20 mCT scanner (Siemens Medical Solutions).
During the imaging process, patients were in supine position with both arms extended in the cranial direction and breathing quietly. PET images were obtained at 2 min/bed frame for patients less than 60 kg, 2.5 min/bed frame for patients less than 90 kg, and 3 min/bed frame for patents up to 90 kg. PET images were reconstructed using CT-based attenuation correction by an ordered-subset expectation maximisation iterative reconstruction algorithm with a slice thickness of 3 mm, and a pitch of 4 mm for the Biograph mCT, and slice thickness of 4 mm and a pitch of 4 mm for both imaging systems.
Radiomics extraction and features analysis
All images were transferred to a personal computer that contained Chang-Gung Image Texture Analysis (CGITA) toolbox version 1.4. PET images were then imported into the CGITA toolbox. CGITA is an open-source software code with a graphic user interface for texture analysis running on MATLAB (Math Works Inc., version 2015a) [12]. PET images were manually or semi-automatically contoured with an iso-contour threshold that was set to an absolute standardised uptake value (SUV) value of 3.0, as previously described [13]. All scans were analysed by senior residents independently (more than five years of experience) and were interpreted by a senior radiologist (10 years of experience).
The second step consisted of resampling or interpolating the non-cubic voxel grids into cubic voxels (2 mm) and performing quantisation (also called discretisation, down sampling, or resampling) of the original intensities into a discrete set of values between the minimum and maximum within the volume of interest (VOI). This number determines the size of the matrices from which the different texture features will be subsequently calculated. Bin numbers of 4, 8, 16, 32, and 64 were employed in this study. The third step comprised the extraction of a total of 73 radiomics parameters from images, including texture features and conventional PET metrics such as SUVmax, SUVmean, SUVpeak, and total lesion glycolysis (TLG) for each VOI. SUVpeak was defined as the mean SUV within a 1-cm sphere centred on the maximum pixel [14].
Texture analysis
Texture analysis includes first-, second-, and higher-order texture methods as well as various transform-based methods. The most “direct” features were those based simply on intensity values within a region of interest (ROI). Texture features in the lymphoma are based on the same parent matrices that were utilised in tumour sites. Examples of these include the grey-level co-occurrence matrix (GLCM), the grey level run length matrix (GLRLM), the neighbourhood intensity difference matrix (NIDM), neighbourhood grey-level dependence matrix (NGLDM), and the intensity size-zone matrix (ISZM) [15-17].
The derived features from voxels of the segmented PET images were grouped into different categories. First-order features were derived from the histogram of voxel intensities (SUVmean, SUVmax, skewness, kurtosis, etc.). Second-order textural features were based on matrices that contained information about the regional spatial arrangement of the voxels, such as their homogeneity, contrast, and coarseness, simulating the human perception of the image. Higher-order features such as grey-level run-length features focused on local collinear voxels with the same grey level. Table 2 describes the extracted features using the CGITA toolbox from the segmented images.
Table 2
Spearman correlation between texture features and the most commonly used positron emission tomography quantitative metrics. The table shows variable degree of associations being highest and strong correlation coefficient
Statistical analysis
Spearman correlation coefficient (rho) was used to evaluate the pairwise relationships between SUVmean, SUVmax, SUVpeak, TLG, surface area, and the derived 72 texture features including all bin sizes. Because not all the parameters contributed to differentiating lymphoma disease, we resorted to the results of the operation characteristic curve at each bin size, and to test the diagnostic potential of the quantitative indices including the conventional metrics as well as texture features, in the discrimination of bone marrow invasion (Table 2) [18,19]. Specificity and sensitivity (including 95% confidence intervals [CIs]) for each of the investigated parameters were also derived and calculated. The Youden index is the vertical distance between the 45-degree line and the point on the receiver operating characteristic (ROC) curve. Receiver operative characteristic data analysis was performed. Binary logistic regression test was used to express results of univariate then multivariate analysis for those features of high area under the curve (AUC) derived from ROC data plots. All statistical analysis was performed using SPSS software (IBM Corp, Armonk, New York, version 23). A p-value of < 0.05 was defined as statistically significant. No adjustment for multiple comparisons was made in this analysis.
Results
Correlation between conventional positron emission tomography metrics and texture features
The results of correlation of PET texture indices with the conventional quantitative metrics, namely maximum SUV (SUVmax), mean SUV (SUVmean), TLG, metabolic tumour volume (MTV), SUVpeak, and surface area, are summarised in Tables 2 and 3. A general observation was that texture features obtained from all analysed bin sizes showed a moderate to strong correlation with conventional PET metrics. Spearman’s rank correlation coefficients (rho) ranged from 0.50 to 0.97 for positive correlation and from –0.52 to –0.97 for the inverse correlation.
Table 3
Spearman correlation between texture features and the most commonly used positron emission tomography quantitative metrics. The table shows variable degree of associations being higher and moderate correlation coefficient
Receiver operative characteristic curves
The area under curve from ROC analysis was determined for every texture index. Out of the complete 73 textural features derived from CGITA, it was found that eight textural features had AUC significantly higher than 0.6 (p < 0.05) for bin sizes 4, 8, 32, and 64, while data derived from 16 bin did not contain any significant results. Table 4 describes the texture features that showed significant AUC higher than 0.6 (p < 0.05). Receiver operating characteristic curves of the significant data are shown in Figure 1. For all significant data, the code similarity had a higher AUC, with sensitivity of 55.6 and 50% and specificity of 84.6 and 88.5% for 32 and 64 bin, respectively.
Table 4
Area under curve results of receiver operating characteristics demonstrated for those parameters that showed a statistically significant area greater than 0.5
Figure 1
A) The figures describe traditional standardised uptake value (SUV) measurements through different positron emission tomo graphy–computed tomography (PET/CT) workstation and (B) figures describe steps of features extraction through Chang-Gung Image Texture Analysis (CGITA) package code depending on given SUV. The CGITA GUI provides users with a simple image display interface that allows users to examine different slices and views. The computation of heterogeneity indices is achieved simply by button clicking. The current functions and interfaces of CGITA can be customized by users familiar with MATLAB programming. The screen shot here shows a subject with the 18F-FDG-PET images

Univariate and multivariate binary logistic regression
Univariate and multivariate binary logistic regression (UVA and MVA) analysis was performed for the features of high AUC derived from ROC data plots, and the results are shown in Table 5. In univariate binary logistic analysis two textural features showed statistically significant association with bone infiltration, whereas multivariate analysis yielded one texture feature (long-run emphasis [LRE] 64 bin, p = 0.031; odds ratio 1.022; 95% CI = 1.002–1.043) that showed statistically significant association with bone infiltration. The set of variables in the MVA included all the significant variables in the univariate setting, using the forward likelihood method.
Table 5
Univariate and multivariate binary logistic regression analysis performed for those features of high area under curve derived from receiver operating characteristics data plots
Discussion
Quantitative features are descriptors extracted from the images using computational mathematical algorithms. The extracted features from PET/CT images using different matrices include GLCM, GLRLM, NIDM, NGLDM, and ISZM [12,20].
18F-FDG PET\CT plays an important role in diagnosis, staging, treatment monitoring, prognosis, and assessment of lymphoma [21]. Also, a heterogeneity metric can only have complementary (or higher significant association) value if it is not highly correlated with the corresponding volume [22]. The correlation between heterogeneity metrics and the conventional PET indices showed significant association for 21 parameters (rho ≥ 0.7) with strong correlation and 16 parameters with moderate correlation (0.7 > rho ≥ 0.5).
The hypothesis of this study was to find a correlation between tumour texture heterogeneity as revealed by radiomics analysis of primary lymphomatous lesion and bone marrow involvement. The use of texture features in differentiating between tumour cells of low or high metastatic spread could be a key tool in bone marrow involvement or at least serve as an adjunct in improving the diagnostic performance of 18F-FDG PET/CT in the staging and management of lymphoma patients.
Bone marrow biopsy has been the conventional method of assessment of BMI. It has several staging, treatment, and prognostic implications [23]. Limitations of bone marrow biopsy include site-dependence and discordance in morphology between lymphomatous cells in extramedullary sites and those cells in the bone marrow [24]. In addition, histological data may report a different pathologic non-lymphoma-related malignancy or disorder as well as its invasive nature, pain, and clinician expertise.
Other drawbacks include extra medical staff, sample fixation, and decalcification as well as a longer stay in the clinic. No more likely but also adding some burden to the examination is the addition of trephine biopsy with bone marrow aspiration, which may cause some adverse events including haemorrhage and morbidity [25]. Another major shortcoming is the likelihood of missing focal disease because the biopsy normally does not cover the entire portion of bone marrow. These shortcomings of bone marrow biopsy stimulate the search for alternative methods that might obviate the need for such procedures whilst being able to provide at least equivalent if not better diagnostic performance.
However, 18F-FDG PET/CT has several advantages in this context, including full body coverage, less invasiveness, precise local assessment of diffuse vs. focal infiltration using anatomical features, as well as the possibility of quantitative data interpretation. The current study focuses on the latter advantage using not only the conventional PET metrics but also incorporating the new advances in texture feature analysis and radiomics data extraction.
The replacement of 18F-FDG PET/CT to bone marrow biopsy is still a matter of active debate. However, the quantitative capacity and recent advances in radiomics data analysis open up new avenues in this context. The present paper aimed to find a major PET feature that could be utilised in future studies as a benchmark or evident source in eliciting more biological characteristics of bone marrow invasion.
Several researches have confirmed a relationship between greater FDG uptake and more aggressive course of malignancy in lymphoma [26,27]. The resulting significant features confirmed that 18F-FDG PET images have advantages of combining practical and anatomical information, which is regarded as a popular contemporary reference for the management of lymphomas [28]. In another study, when looking into the prognostic performance of the texture data, MTV was found the most statistically significant parameter that shoed the largest correlation coefficient [22]. A recent report looking at the differences that arise from tumour volume segmentation has shown that low MTV had a significantly longer progression-free survival and overall survival compared to patients with high MTV. These findings were obtained regardless of the segmentation methods used [29].
The conventional PET indices depend on radioactivity concentration measured by the PET scanner within a region of interest (ROI) (18F-FDG uptake interior contoured lesion) [30], while biopsy (i.e. pathological sample) is the gold standard for determining tumour genetics [31]. However, genomic features of gene expression and pathways can be predicted by FDG uptake features from the lesion [32]. Therefore, the correlation between conventional matrix (such as SUVmean, SUVmax, TLG) and quantitative features from PET images (especially those with strong correlation) can be considered as an acceptable surrogate to replace those features instead of guided biopsy, to prevent delayed diagnosis and the other associated complications described earlier.
While ROC analysis could provide a static assessment of risk identification through cut-off points that maximise sensitivity and specificity, it can also provide important information about diagnostic test performance [33,34]. In this work, the event in the ROC curve depends on the presence or absence of BMI for each individual patient. By comparing AUC of ROC curves of texture parameters, we found that texture parameters could have strong discriminating capabilities in identifying patients who have BMI This effective diagnostic capacity was statistically absent in the conventional and standard method of quantitation including SUVmax, SUVmean, SUVpeaks, TLG, and MTV.
For texture feature investigated in the present study, high-intensity large run emphasis (HILRE) achieved the highest AUC (0.718, CI: 0.563-0.873) among all significant data of ROC curves. Long-run emphasis, however, has a significant strong correlation with metabolic volume, which might underscore its performance in bone marrow involvement.
18F-FDG PET/CT has been widely used for lymphoma diagnosis because the specificity and sensitivity have higher indications in lymphoma regions, especially in the initial staging procedures [11,35]. In fact, second-order and high-order statistics (i.e. based on grey-level matrix, nearest neighbour spatial dependence matrices, voxel-alignment matrix, intensity size-zone matrix, texture feature coding co-occurrence matrix, etc.) provide information from the spatial relationship of image voxels. Moreover, a multitude of features may be derived from the grey-level matrices to characterise the structure of interest [36]. These features are independent of tumour position, orientation, size, and brightness and |consider the local intensity-spatial distribution [37].
Figure 2
Receiver operative characteristic curves of the positron emission tomography (PET) heterogeneity indices. It was observed that the texture features had higher discriminative power than the conventional PET metrics
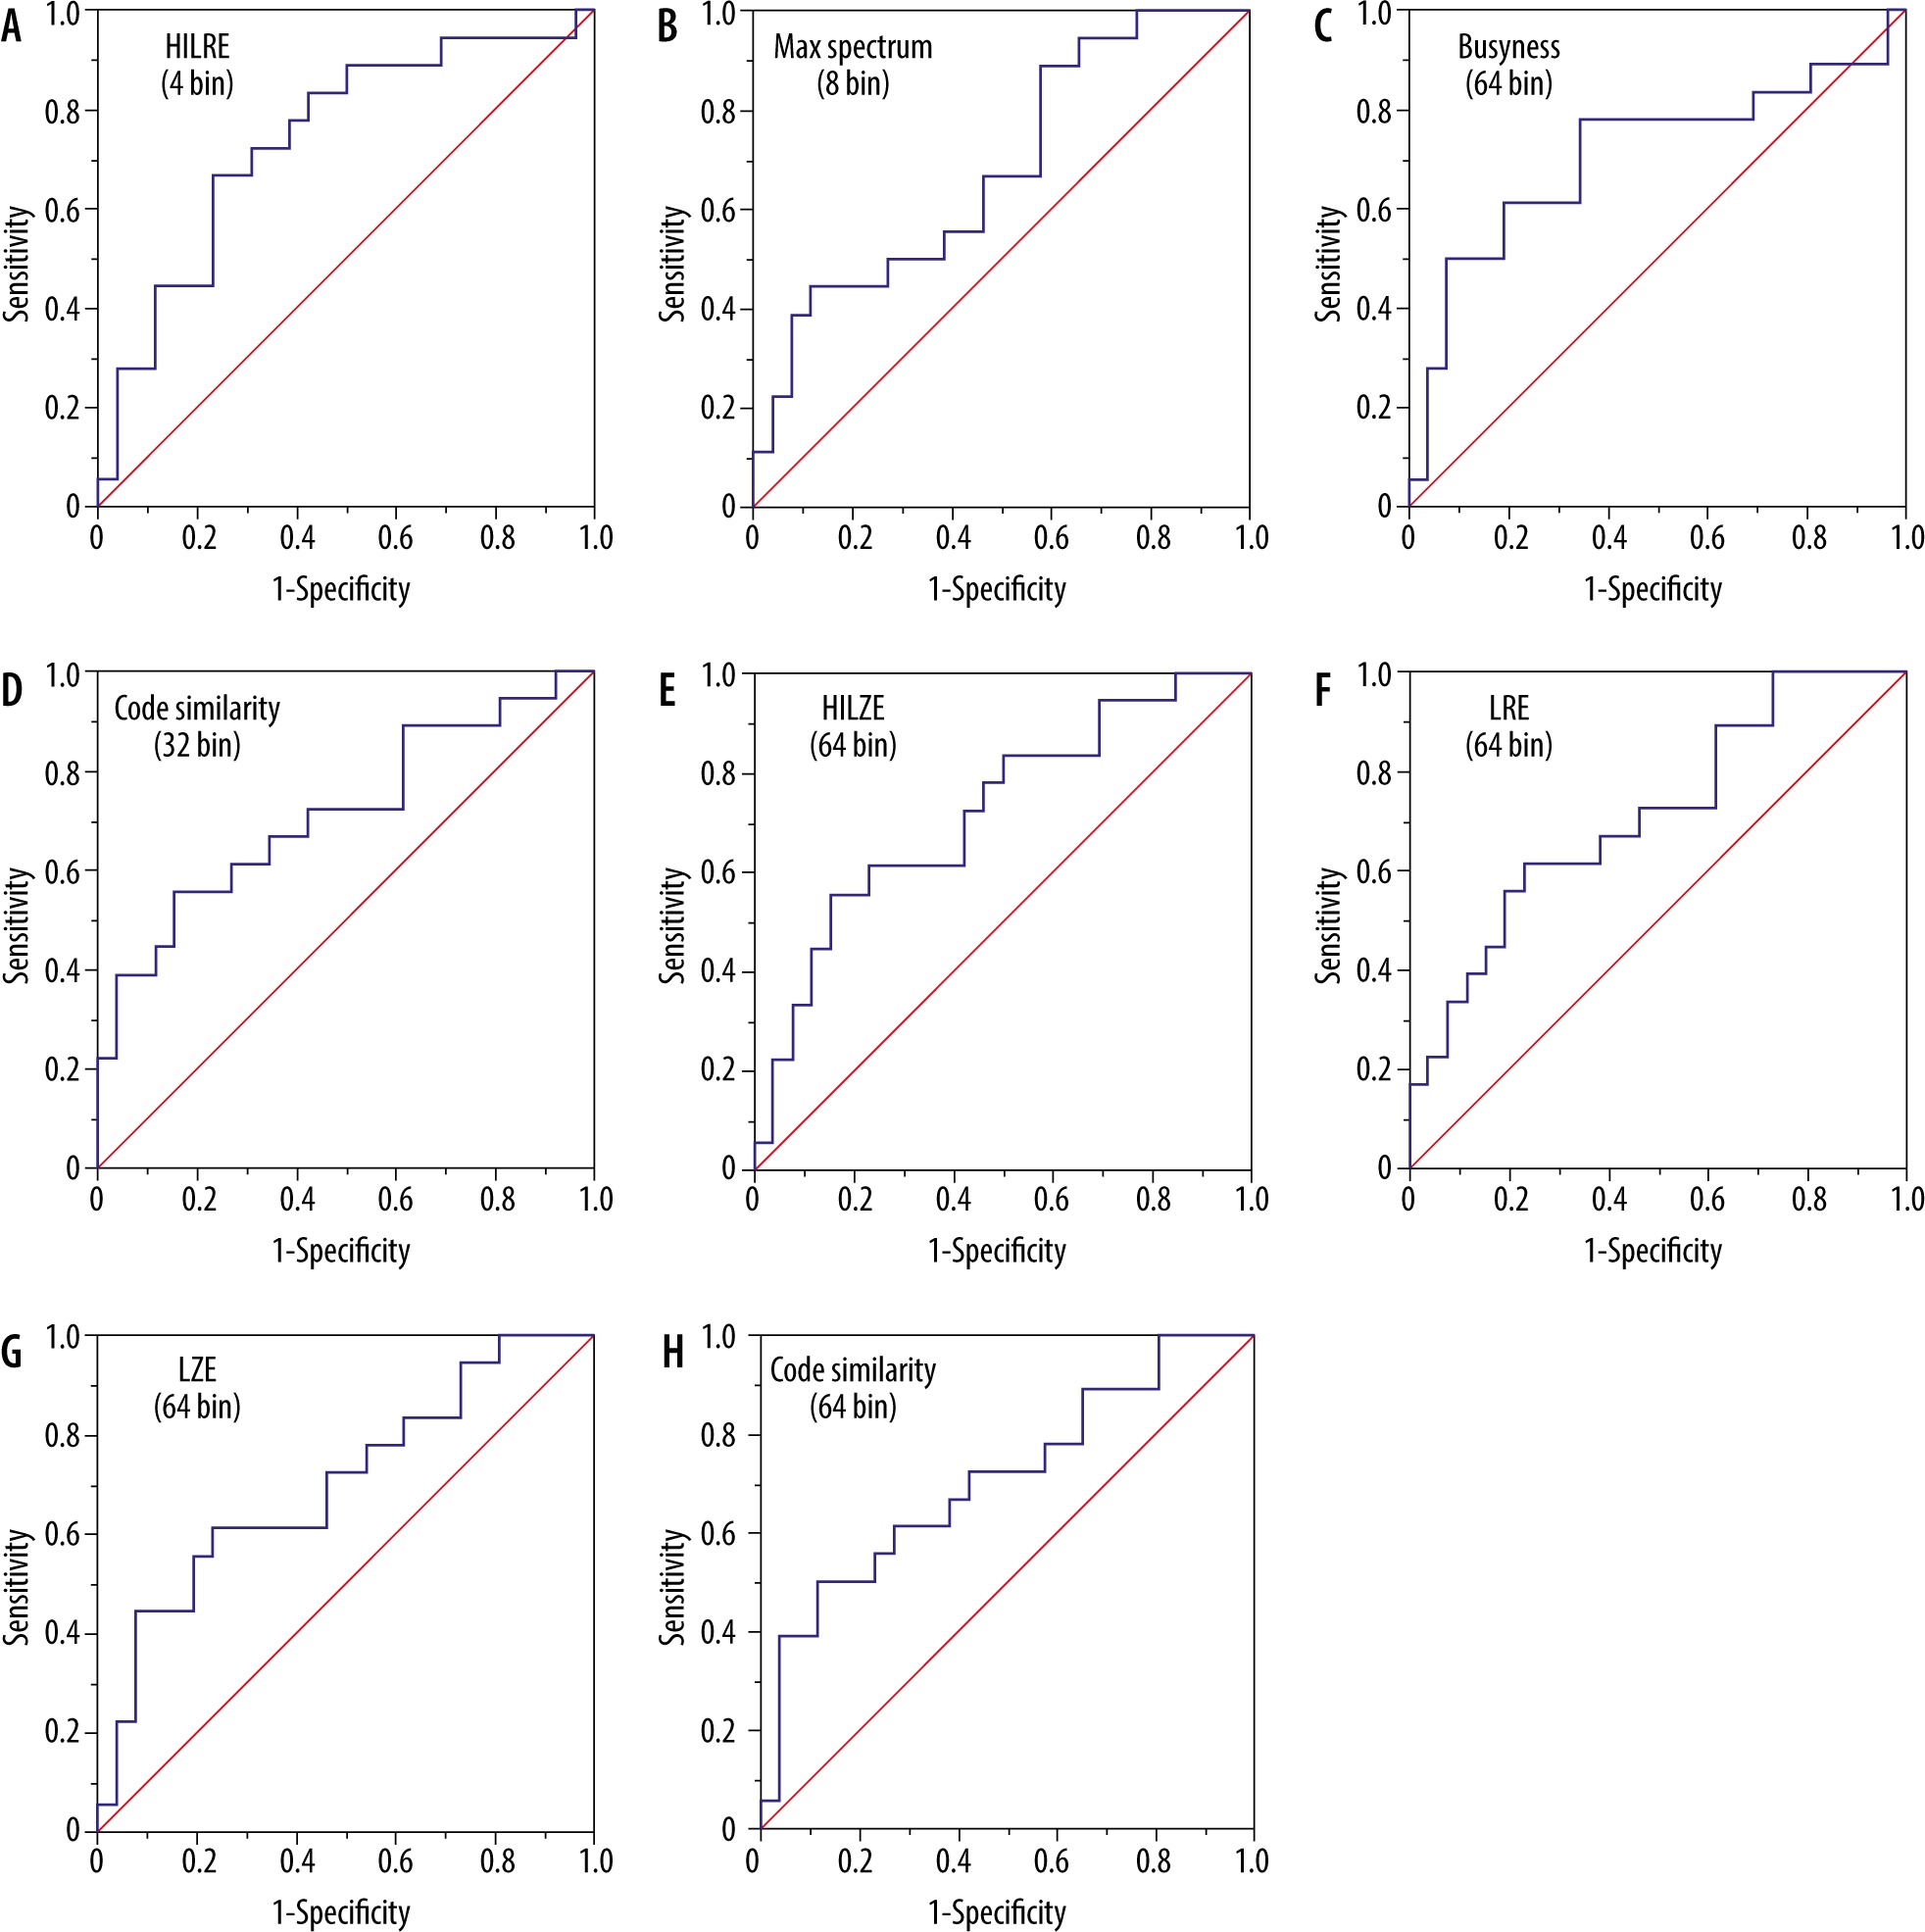
Based on the ROC curves, the results showed that HILRE (4 bin) long-run emphasis (LRE 64 bin) (i.e. voxel-alignment matrix [38]), high-intensity large-zone emphasis 64 bin, large-zone emphasis (large zone emphasis 64 bin) (i.e. intensity size-zone matrix [39]), max spectrum (8 bin) (i.e. spectrum matrix) [40], busyness (64 bin) (neighbourhood grey intensity difference matrix [41]), and code similarity (32 bin and 64 bin) (coding co-occurrence matrix [42]) were significant predictors of BMI (p < 0.05). These features were extracted from the second- and higher-order matrix, highlighting the relevance of voxel arrangement and their spatial correlation to the underlying biological processes of BMI. To our knowledge, this finding has not been reported in the literature.
Busyness extracted from contoured PET images offered a greater discriminatory power marked by higher accuracy, specificity, and sensitivity than commonly used quantitative metrics such as SUVmax, which was not significant in this study. It has been reported that the NGIDM texture features were able to differentiate malignant pulmonary nodules [43]. The enhancement in discriminatory performance shown in this study could benefit patients by preventing the high false-positive rate of PET for FDG uptake regions.
One limitation of the present study was the pathological guidance of BMI in the selected patient cohort. This should be tackled in validation studies investigating the role of texture feature analysis in diagnosing BMI in lymphoma patients. Future studies are therefore highly warranted to confirm the performance of the texture data described herein, with special emphasis placed on code similarity and long-run emphasis.
Conclusions
In conclusion, our study confirmed the role of texture analysis and therefore proposed a new method for differentiating lymphoma disease with BMI. More investigations are highly warranted, to combine the role of texture analysis in providing additional diagnostic as well as prognostic values to 18F-FDG PET/CT in the initial staging of patients with lymphoma.