


Introduction
Tuberculosis (TB) is a lung disease that occurs owing to bacterial infection [1]. TB is caused by a type of bacteria called the bacillus Mycobacterium tuberculosis. This airborne communicable disease is considered as the one of the top 10 leading causes of death worldwide [1]. In contrast to other infectious diseases, early diagnosis of TB is relatively difficult, and therefore several diagnostic tests will be required to detect TB [2]. Hence, World Health Organization (WHO) recommends broad use of systematic screening strategy to provide early diagnosis of TB. Although chest X-ray (CXR) has low specificity and remarkable intra- and inter-observer variations, WHO recommends postero-anterior chest radiography as one of the primary methods for detection and screening of TB owing to its relatively high sensitivity [3,4]. As stated above, however, there are significant intra- and inter-observer variations in the interpretation of CXR, resulting in misdiagnosis of TB [5,6]. Moreover, CXR interpretation is a time-consuming and a subjective process. Also, there is similarity between radiologic patterns of TB and other lung diseases that can lead to misdiagnosis [6]. To this end, in recent years, computer aided diagnosis (CAD) systems have emerged to automatically detect TB from chest radiography [7]. CAD solutions apply image segmentation, texture and shape feature extraction, and classification procedure for diagnosis of pulmonary TB from chest radiography [8].
Over the last decade, artificial intelligence (AI) based solutions have been applied for automated detection of breast cancer and brain tumor, physiological monitoring, etc. [9-11]. Machine learning as a branch of AI enables the computers learn without human intervention (self-learn), automatically without being explicitly programmed [12-14]. In other words, machine learning can discover pattern in data (e.g., images). Deep learning is a subfield of machine learning which uses multiple layers to extract higher-level features from the raw input. In recent years, deep learning algorithms are considered as the state of the art for image classification. Among deep learning approaches, deep convolutional neural networks (DCNNs) have emerged as an attractive technique for image classification [12-14]. Recently, several studies have used CNNs for automated detection of lung diseases such as pneumonia from CXR [11]. In deep learning framework, concept transfer learning is utilized to identify TB using pre-trained models and their ensembles [15]. Herein, we aimed to train a CNN model from scratch to automatically detect TB from CXR images and compare its performance with transfer learning based technique of five different pre-trained CNNs.
Material and methods
Dataset
In the current study, two publicly available datasets of postero-anterior chest radiographs were used, which are from Montgomery County, Maryland, and Shenzhen, China (Table 1) [16]. Figure 1 shows sample cases of normal and TB of both datasets. Both datasets are publicly available here: http://archive.nlm.nih.gov/repos/chestImages.php.
Table 1
Summary of tuberculosis (TB) chest X-ray datasets
Figure 1
Samples of chest X-ray images from the Shenzhen, China dataset (A) and Montgomery County, MD dataset (B) with corresponding labels
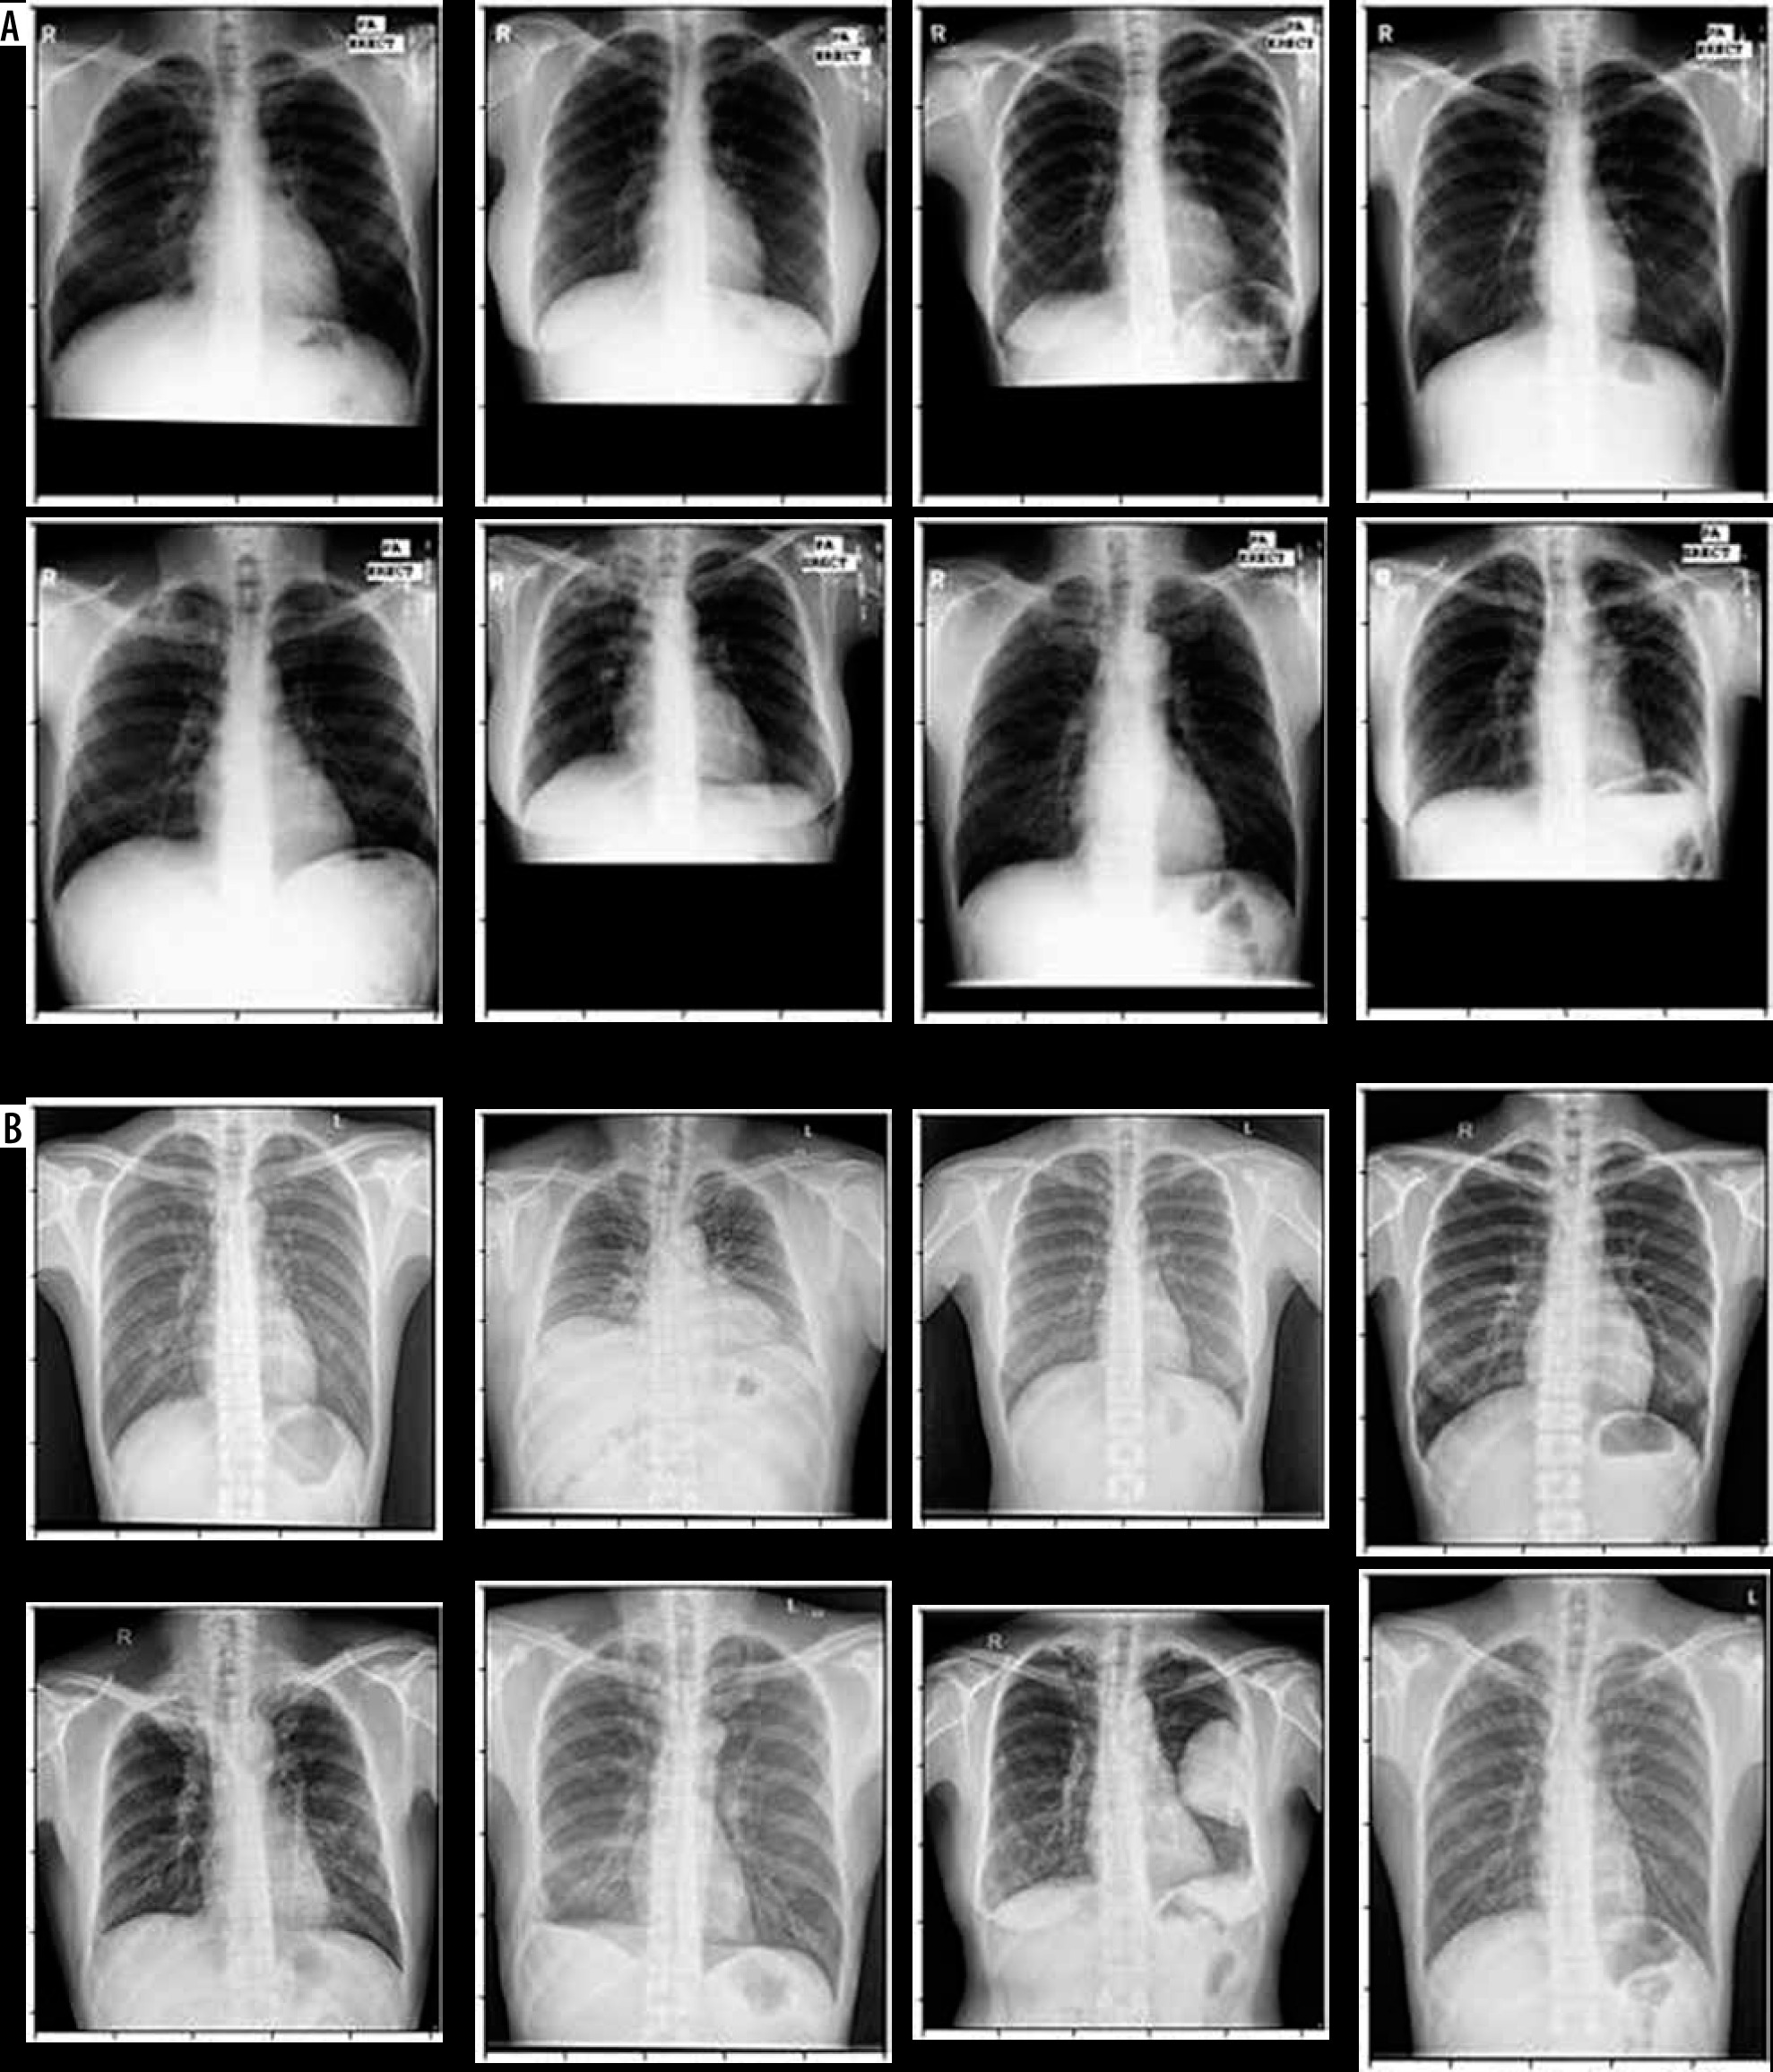
China Set – The Shenzhen set
It was collected by the National Library of Medicine, Maryland, USA in cooperation with Shenzhen No. 3 People’s Hospital, Guangdong Medical College, Shenzhen, China. The radiographs were captured using a Philips DR Digital Diagnose system. This dataset consists of 662 CXR images, of which 326 are normal cases and 336 are infected with TB along with radiologist reading.
Montgomery County X-ray Set
The radiographs of this dataset were acquired by The National Library of Medicine in collaboration with The Department of Health and Human Services of Montgomery County, MD, USA. This dataset has a total of 138 postero-anterior chest radiographs, of which 58 CXR images are TB and 80 are normal CXR images. Radiology readings also are available for this dataset.
Data preprocessing and augmentation
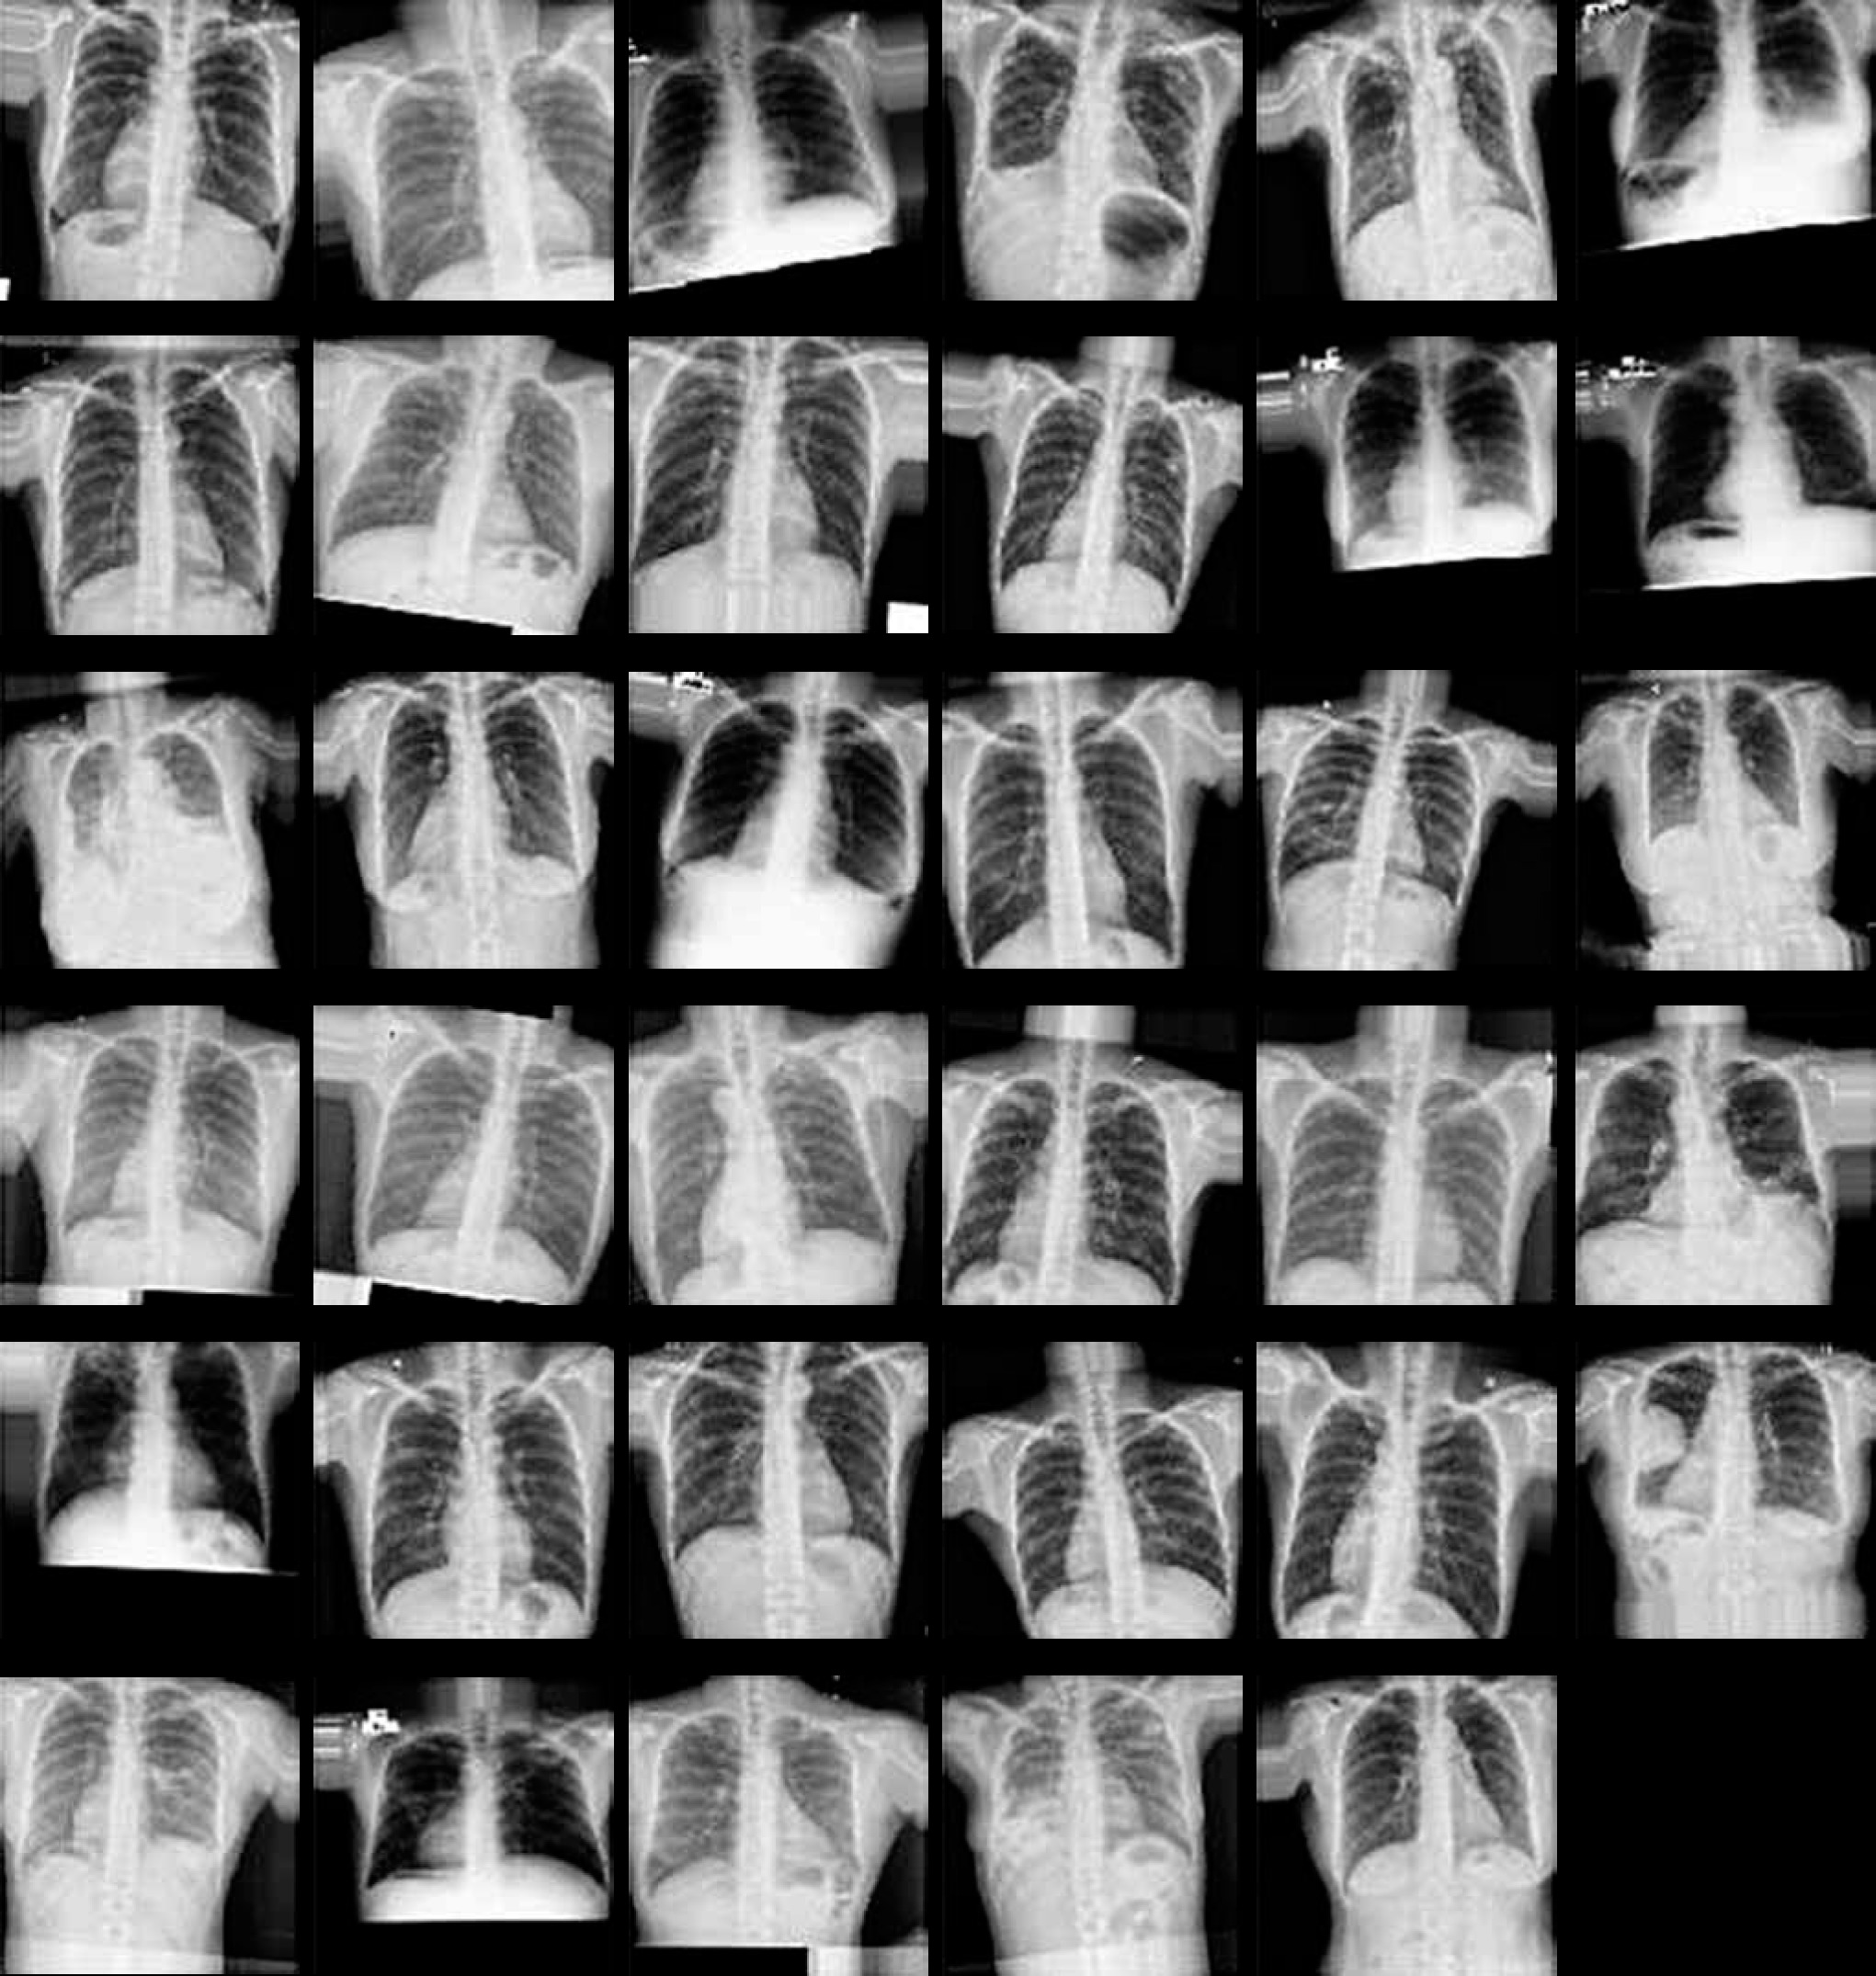
In the present study, the CXR images were resized to 256 × 256 pixels because the size of input images was different. Then, data augmentation techniques were applied. It has been reported that using data augmentation can result in improving classification accuracy of deep learning algorithms. Furthermore, data augmentation can significantly increase the samples in the datasets for training models. Herein, we performed image augmentation with a rotation range of 10, a width shift range of 0.1, a height shift range of 0.1, a zoom range 0.1, and horizontal/vertical filliping. Figure 2 shows the samples of image augmentation. After data augmentation, 2040 images were belonged to 2 categories for training phase (49.2% TB and 50.8% normal). 120 images (49% TB and 51% normal) for validation phase and 120 images (49% TB and 51% normal) for testing phase were belonged.
Proposed model
In this work, we trained a convolutional neural network (CNN or ConvNet) from scratch that the term “Conv” indicates the convolution layer. :
Convolutional layer
Convolutional layers are considered as the core building block used in CNN. CNNs use convolution in place of general matrix multiplication. Convolutional layers consist of a series of filters also known convolutional kernels. The main task of convolutional layer is to extract certain features from an input image using kernels. Usually, Rectified Linear Unit (ReLU) is used as activation layer for deep learning.
Pooling layer
In CNN, after convolutional layer, an optional pooling or down sampling layer is applied to decrease the spatial size of the input data, resulting in reducing the number of parameters in the network. Max Pooling is known as the most common pooling technique. Beside, average pooling and L2-norm pooling are other pooling techniques.
Fully connected layer
Fully connected layers connect each neuron in previous layer to every neuron in next layer. The output from the final Pooling or convolutional layer that is flattened is the input to the fully connected layer. Softmax and Support Vector Machines (SVM) are the two most important classifiers used in CNN.
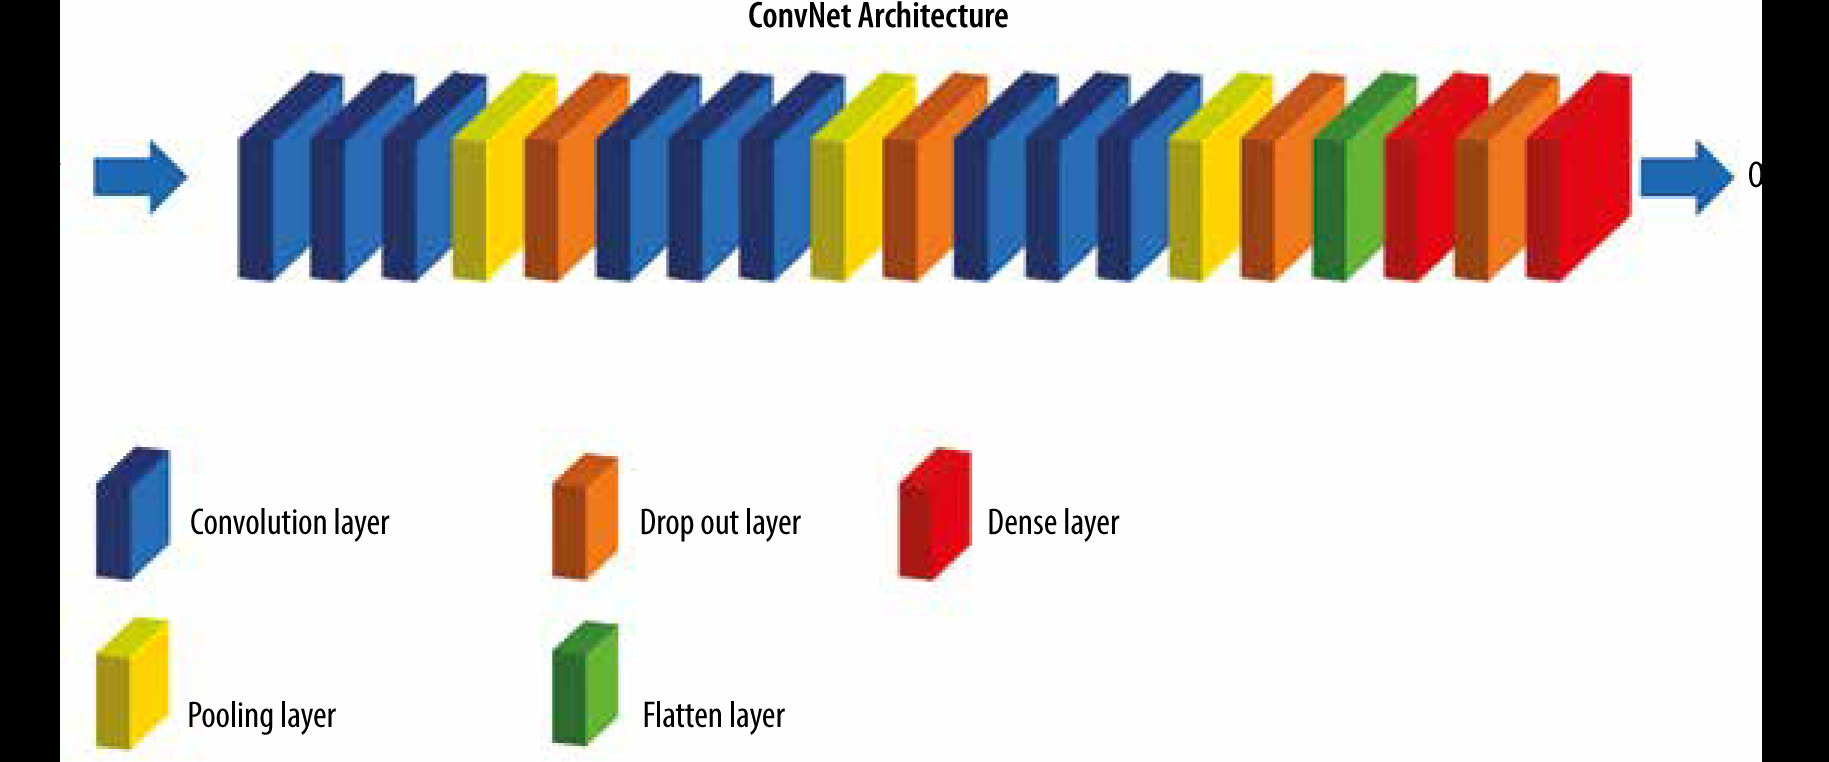
Figure 3 illustrates training process of our proposed CNN model. The size of input image was 96 × 96 pixels. Our model consists of three blocks. In the first block, three convolutional layers were used, each of which has 32 filters, each with 3 x 3 dimensions, and a ReLU activation function. Then, we used a Max Pooling layer with a pool size (2, 2) to perform down-sampling. As stated earlier, this factor was used to reduce the size of the images, which reduces the model parameters while preserving the image information. The second and third blocks are the same. But in the second block, 64 filters with size 3 × 3 and in the third block, 128 filters with size 3 × 3 have been used. A flatten layer was used to convert the tensor extracted from the third block into a one-dimensional vector. Next, a dense layer with 256 nodes and a ReLU activation function was used. Then, we utilized a dropout with a threshold of 0.03 to improve generalization. Finally, we used the last dense layer for reducing the vector of height 64 to a vector of 2 elements. The output of the classification model in this problem was two-class classification.
Pre-trained transfer models
Herein, the datasets containing TB CXR images were used. For the training process, the image augmentation techniques were used following dataset pre-processing and splitting. The data augmentation results in preventing the risk of over-fitting.
A CNN-based model was used to detect TB from CXR images. In the current work, a CNN-based transfer learning approach using five different pre-trained models, including Inception_v3, Xception, ResNet50, VGG19, and VGG16 was utilized for the classification of CXR images to normal and TB (binary classification). The overall architecture of the proposed CNN models consists of feature extractors and a classifier (sigmoid activation function). In other words, the architecture of all pre-trained transfer models is similar and contains 4 following parts: (1) convolution layer, (2) pooling layer, (3) flattening layer, and (4) fully connected layer. Herein, the fully connected layer comprises following layers: (1) flatten, (2) dense with a size of 256 units, (3) dropout with a threshold of 0.2, and (4) a last dense with the two-element softmax activation to predict the normal and TB cases (binary classification).
Training phase
We trained the proposed models using the categorical cross-entropy loss function and Adam optimizer to reduce the dimension of extracted features. For training, the following solver parameters were applied: learning rate of 0.00001, batch size of 50, and epoch value of 200. As mentioned above, data augmentation methods have been used to increase training efficiency and prevent overfitting. In the present study, we used Python library for training, validation, and testing of different algorithms. The training of CNNs was implemented using a standard PC with a GeForce GTX 8 GB NVIDIA and 32 GB RAM. The performance of binary classification of the proposed models was evaluated using the Holdout method.
Evaluation criteria
The performance of different proposed models for testing dataset was evaluated and compared using five performances metrics, including accuracy, sensitivity/recall, Precision, Area under curve (AUC), and F1 score, as shown in equation (1-4).
where: TP – true positive, FP – false positive, TN – true negative, and FN – false negative.
Results and Discussion
Table 2 outlines the performance metrics of each proposed model for detection TB on the test dataset. As shown in Table 2, all CNNs provided an acceptable accuracy for two-class classification. Our proposed CNN architecture (i.e., ConvNet) achieved 88.0% precision, 87.0% sensitivity, 87.0% F1-score, 87.0% accuracy, and AUC of 87.0%, which is slightly less than the pre-trained models. Among all models, Exception, ResNet50, and VGG16 provided the highest classification performance of automated TB classification with precision, sensitivity, F1-score, and AUC of 91.0%, and 90.0% accuracy, as observable in Table 2. Loss for validation dataset for each proposed model is outlined in Table 2. The closer the value of the validation loss is to zero, the more efficient the model. Previously, several groups of researchers have applied classical machine learning techniques to classify TB and non-TB cases from CXR images [17,18]. Using deep learning algorithms have been also reported in the detection of TB. The idea of transfer learning in deep learning framework is the detection of TB utilizing pre-trained models and their ensembles. In a study, Hooda et al. have used a deep learning approach to classify chest radiographs into TB and non-TB categories with an accuracy of 82.09% [19]. Also, Evalgelista et al. have reported accuracy of 88.76% for automated detection of TB using CNNs [20]. In another study, Nguyen et al. have evaluated the performance of a pre-trained DenseNet model to classify TB and normal cases from CXR images from Shenzhen, China and Montgomery County databases using fine-tuned model, and found the AUC values of 0.94 and 0.82, respectively [21]. Ahsan et al. have utilized a generalized pre-trained CNN model for classifying TB. Their model provided accuracies of 81.25% and 80% with and without using image augmentation, respectively [22]. Yadav et al. reported 94.89% accuracy for TB detection using transfer learning technique [23]. As outlined in Table 2, our data are in line with the aforementioned studies.
Table 2
Model performance on the test set
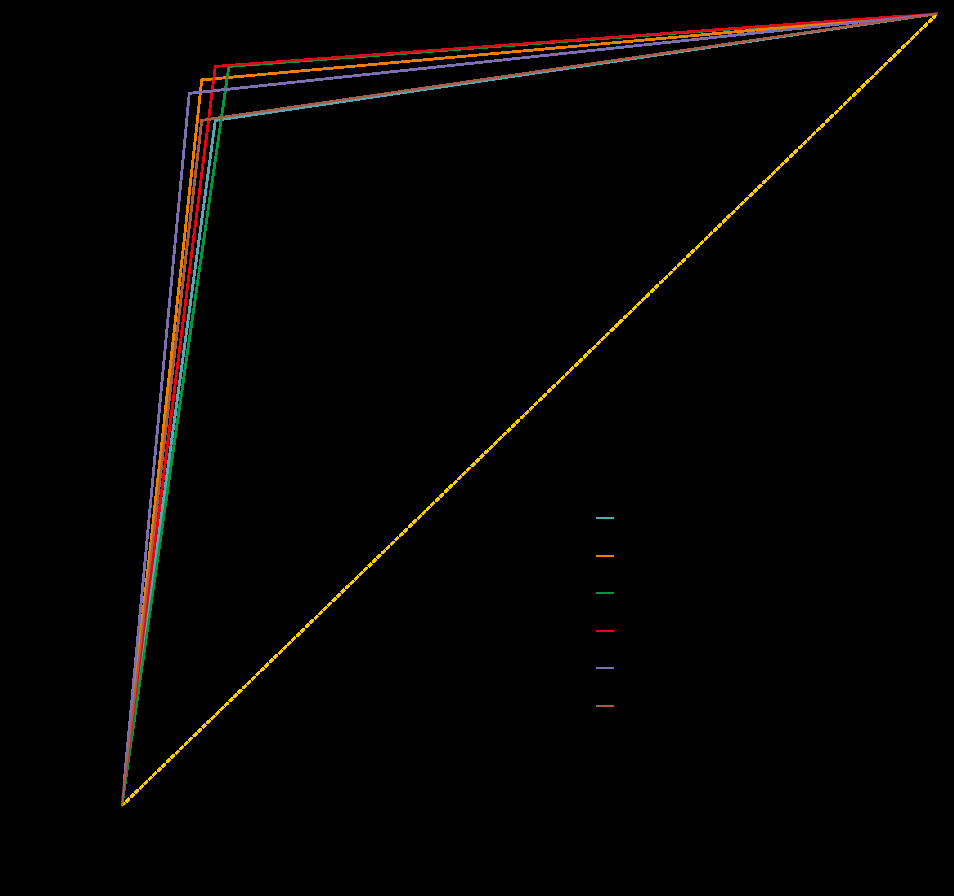
Figure 4 illustrates the receiver-operating characteristic (ROC) curves of all CNN models on the test set. The ROC curve indicates the trade-off between recall and specificity [24]. The AUC is considered as an effective way to indicate the accuracy of ROC produced by each proposed model.
Conclusions
Our study presents a transfer learning approach with deep CNNs to automatically classify TB and normal cases from the chest radiographs. The performance of six different CNN models was evaluated for the detection TB CXR images. Exception, ResNet50, and VGG16 models outperformed other deep CNN models for the datasets with image augmentation methods. The classification accuracy, precision, sensitivity, and F1-score for the detection of TB were found to be more than 87.0% for all models used in the study. Using bigger dataset can increase the accuracy and robustness of our proposed models, which this point needs to be addressed in future works.