


Introduction
Nasopharyngeal carcinoma (NPC) and lymphomas are among the most prevalent tumours in the nasopharynx cavity, with a high incidence rate in southern regions of China [1]. Although they might manifest similar clinical symptoms, they are different regarding tumour behaviour, clinical management, and prognosis. Therefore, their accurate differentiation is necessary before starting proper treatment [2].
Magnetic resonance imaging (MRI), as the preferred imaging modality, can reflect biochemical features of masses in the oral and pharyngeal cavity, which is very useful for diagnosis, treatment monitoring, and prognosis evaluation of patients with head and neck malignancies [3]. Although endoscopy is the gold standard for diagnosing NPC, this method sometimes has limitations for identifying lesions located at the submucosa or within the pharyngeal recess. MRI is a very useful and non-invasive tool for detection of suspected NPC as well as lymphoma [4]. Therefore, initial application of MRI before performing more invasive methods such as endoscopy and biopsy can provide valuable information for further management and the next diagnostic steps.
Many studies have highlighted the applicability of diffusion-weighted imaging (DWI), a technique based on magnetic resonance imaging (MRI), which analyses the microscopic rate of water diffusion within tissues [5]. Apparent diffusion coefficient (ADC) as a DW-MRI-derived parameter was shown to correlate negatively with tumour cellularity in different solid cancers [6]. Results of accumulating meta-analyses showed that the ADC value, depending on cancer type [7-9], could distinguish benign from malignant lesions [10-12], predict response to treatment [13,14], and determine the expression of tumour biomarkers [15,16]. However, there are few studies investigating the diagnostic accuracy of ADC for differentiating lymphomas from other malignant tumours.
A recent meta-analysis by Du et al. has pointed out that the ADC value has excellent accuracy for distinguishing between high-grade gliomas and primary central nervous system lymphomas [17]. Furthermore, Surov et al. previously showed that lymphomas have the lowest mean ADC value compared to other malignant masses located in the head and neck, such as sarcoma or squamous cell carcinomas [18]. Likewise, a meta-analysis by Payabvash et al. showed similar results for lymphomatous lymph nodes compared to metastatic lymph nodes originating from squamous cell carcinomas in the head and neck region [19].
In this systematic review and meta-analysis, we first aimed to investigate the differences of ADC values between nasopharyngeal carcinoma and lymphomas in both primary and metastatic sites and then evaluate their diagnostic performance. Considering that there is still no radiomics study related to the objective of this study, assessing the diagnostic performance of the ADC value could be promising and might pave the road for future radiomic studies. In addition, ADC values are easier to obtain because they can be acquired directly from MR images, and diagnosis based on ADC values is more widely used in clinical practice compared to radiomics analysis, which has limited applicability and uneven methodological quality [20,21].
Material and methods
This systematic review was conducted according to the Preferred Reporting Items for Systematic Reviews and Meta-Analyses of Diagnostic Test Accuracy Studies (PRISMA-DTA) guidelines [22]. No overlapping systema-tic review related to the topic of this study was found in the Cochrane Library. Institutional review board approval or written informed consent was not mandatory because of the nature of the study.
Search strategy
Electronic databases, including PubMed, Web of Science, and Embase, were searched to identify studies evaluating the diagnostic test accuracy of ADC features or their differences in distinguishing nasopharyngeal carcinomas from lymphomas. The following combinations were used to search databases: nasophar* AND (Carcinoma OR Cancer OR NPC) AND (Lymphoma OR NPL) AND (apparent diffusion coefficient OR ADC); a detailed search strategy is provided in Supplementary File 1. No retrieval date restrictions were applied; however, the search was limited to articles published in English, and the end date for the search was 19 June 2022. In addition, a new search was done on 8 September 2022 to find recent publications. All the citations identified by the database searches were imported into the Mendeley bibliographic database.
Study selection, inclusion, and exclusion criteria
After retrieving articles from databases, duplicate studies were removed. Then 2 authors screened titles and abstracts of retrieved articles and excluded unrelated records, including animal studies, articles not in English language, review papers, conference papers, editorials, comments, and case reports. At the next stage, the remaining records were screened in terms of matching the research questions, and studies with insufficient data or studies suspected to have cohort overlap were excluded. At each stage of study selection, the authors checked the excluded records by reading their full text, and any disagreement was resolved after reaching a consensus.
Studies that met the following criteria were included: (a) the research purpose was to differentiate nasopharyngeal carcinomas and lymphomas using the ADC value; (b) the mean and standard deviation (SD) for ADC values were provided before pretreatment (e.g. surgery, chemotherapy, or radiotherapy); or (c) diagnostic performance of ADC value in terms of sensitivity and specificity or true positive (TP), false negative (FN), false positive (FP), and true negative (TN) rates were reported; and finally (d) the type of cancer was diagnosed by pathology. Studies that fulfilled any of the following criteria were excluded: (a) reviews, case reports or series, letters, editorials, consensus statements, conference abstracts, or animal studies; (b) duplicate studies or studies from a single institution from which an analogy of their data has been published elsewhere; and (c) studies that had insufficient data.
Data extraction
The following data were extracted from studies that met the inclusion criteria: first author’s name, year of publication, country, study design (retrospective or prospective), number of lesions (including NPC and lymphoma), method of diagnosis (reference test including pathology or imaging/clinical follow-up), MRI device magnetic field strength (1.5T or 3T), b-values, repetition time (TR), echo time (TE), slice thickness, threshold value, area under curve (AUC), sensitivity, specificity, TP, FN, TN, FP, number of NPC and lymphoma lesions, and mean ± standard deviation of the ADC value for lymphoma and NPC lesions. The key information we extracted was the numbers of TP, FP, FN, and TN. When these values were not reported, they were calculated using the indexes of sensitivity, specificity, and numbers of lymphoma and NPC lesions; then, the results were rounded to the nearest whole number. When studies reported different ADC measurements, we only extracted the data for ADCmean. If sensitivity and specificity were not mentioned directly in the text, the ROC curve was used to extract these values using the top left method.
Quality assessment
The methodological quality of included studies was assessed using the Quality Assessment of Diagnostic Accuracy Studies (QUADAS-2) assessment tool in R with the robvis package. The QUADAS-2 tool evaluates the quality of a study in 4 separate areas, including patient selection, index test, and reference standard, as well as flow and timing [23]. Every included article was assessed in each domain, and the potential risk of bias was classified as high risk, unclear, or low risk. Two reviewers separately completed the assessments, and any disagreements were resolved by reaching a consensus between the 2 reviewers.
Statistical analysis
Firstly, using RevMan 5.4, we created forest plots for continuous variables and determined the standardized mean difference (SMD) for nasopharyngeal cancer and lymphoma. Additionally, the restricted maximum likelihood (REML) with inverse variance method was applied. Cochran’s Q-test and the Higgins inconsistency index (I2) test were used to determine the heterogeneity of the pooled data. I2 values greater than 50% indicated significant heterogeneity. To visually and quantitatively evaluate the publication bias for the continuous variables, funnel plots and Begg’s test were utilized using the meta package in R v4.2 (R Foundation for Statistical Computing, Vienna, Austria). In addition, the causes of study hetero-geneity were investigated through subgroup analysis. Using MIDAS and METANDI modules in STATA 14.0 (StataCorp), data provided as sensitivity and specificity were pooled using hierarchical logistic regression modelling, and a hierarchical summary receiver operating characteristic (HSROC) plot was created. A coupled forest plot was generated, and then by computing the Spearman correlation coefficient (r) between the logit TP rate and logit FP rate, the presence of threshold effects was analysed in MetaDisc 1.4. Meta-regression analyses were carried out to explore the sources of study heterogeneity. A Deeks’ funnel plot was created for testing publication bias, and statistical significance was determined by the Deeks’ asymmetry test. The post-test probability was computed by creating a Fagan plot. P-values lower than 0.05 were considered significant in this study.
Results
Literature search
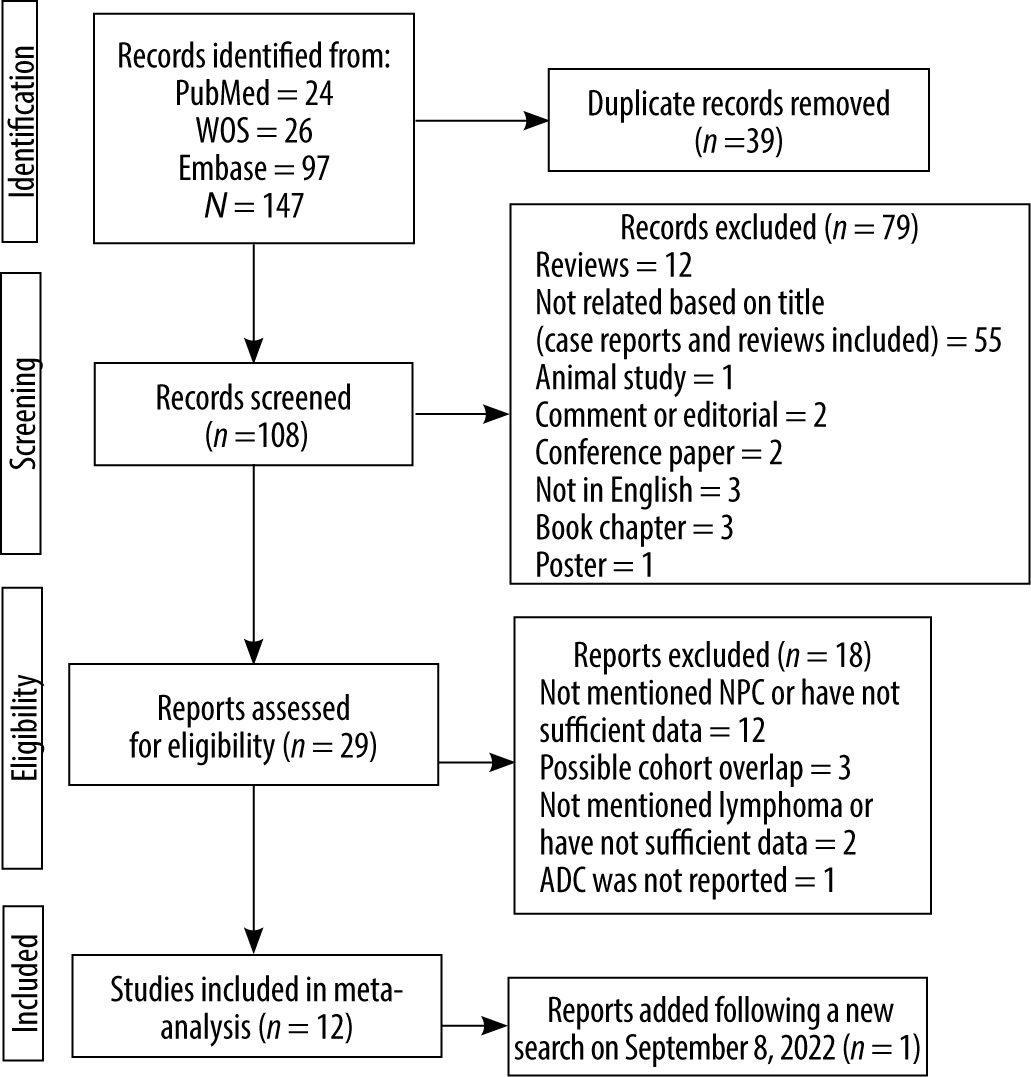
The electronic searches yielded 147 records, of which 39 were excluded due to duplicate titles. After screening the titles and abstracts of the remaining articles, 79 studies were excluded. Then 29 possible studies were evaluated for their eligibility in the meta-analysis, of which 18 were excluded because they had not provided sufficient data (n = 15) or had possible cohort overlap (n = 3). In addition, an eligible study was added following conducting a new search on 8 September 2022. Finally, 12 studies [24-35] were included in the meta-analysis, consisting of 181 lymphoma and 449 NPC lesions (N = 630) in the head and neck region (Figure 1).
Characteristics of included studies
Characteristics of studies are listed in Table 1. The publication date of included studies ranged from 2007 to 2022. Of the 12 studies, 9 were retrospective, one prospective, and 2 with no sufficient information regarding the study design. Nine studies were conducted in Asian regions (4 in China, 3 in Hong Kong, 2 in Japan, and one in Turkey), and 2 studies were conducted in African regions (both in Egypt). Nine studies evaluated DW-MRI parameters at the primary tumour sites, 2 studies at lymph nodes, and one at the site of the trigeminal nerve. Two studies evaluated DW-MRI parameters in paediatric po-pulations. The MRI scanner manufacturers were Siemens (n = 5), Philips (n = 5), and GE (n = 1), and one study used a mix of these scanners. Scanner’s field strength in 4 studies was 3.0 T, and in the rest of the studies was 1.5 T.Ranges of b-values were from 0 to 1000 (10-3 s/mm2). Repetition time (TR) ranged between 2000 and 5600, echo time (TE) ranged from 8 to 100, the slice thickness in 5 studies was 4 mm, in 4 studies was 5 mm, in one study was 10 mm, in one study was a mix of 3 and 4 mm, and was not mentioned in one study. Data for diagnostic test accuracy (DTA) analysis were available in 5 studies, and in 4 of them, cut-off values ranged from 0.694 to 0.77. In addition, quantitative extracted data from the studies are listed in Table 2.
Table 1
Characteristics of included studies
Table 2
Quantitative extracted data from the studies
ADC difference between NPC and lymphomas
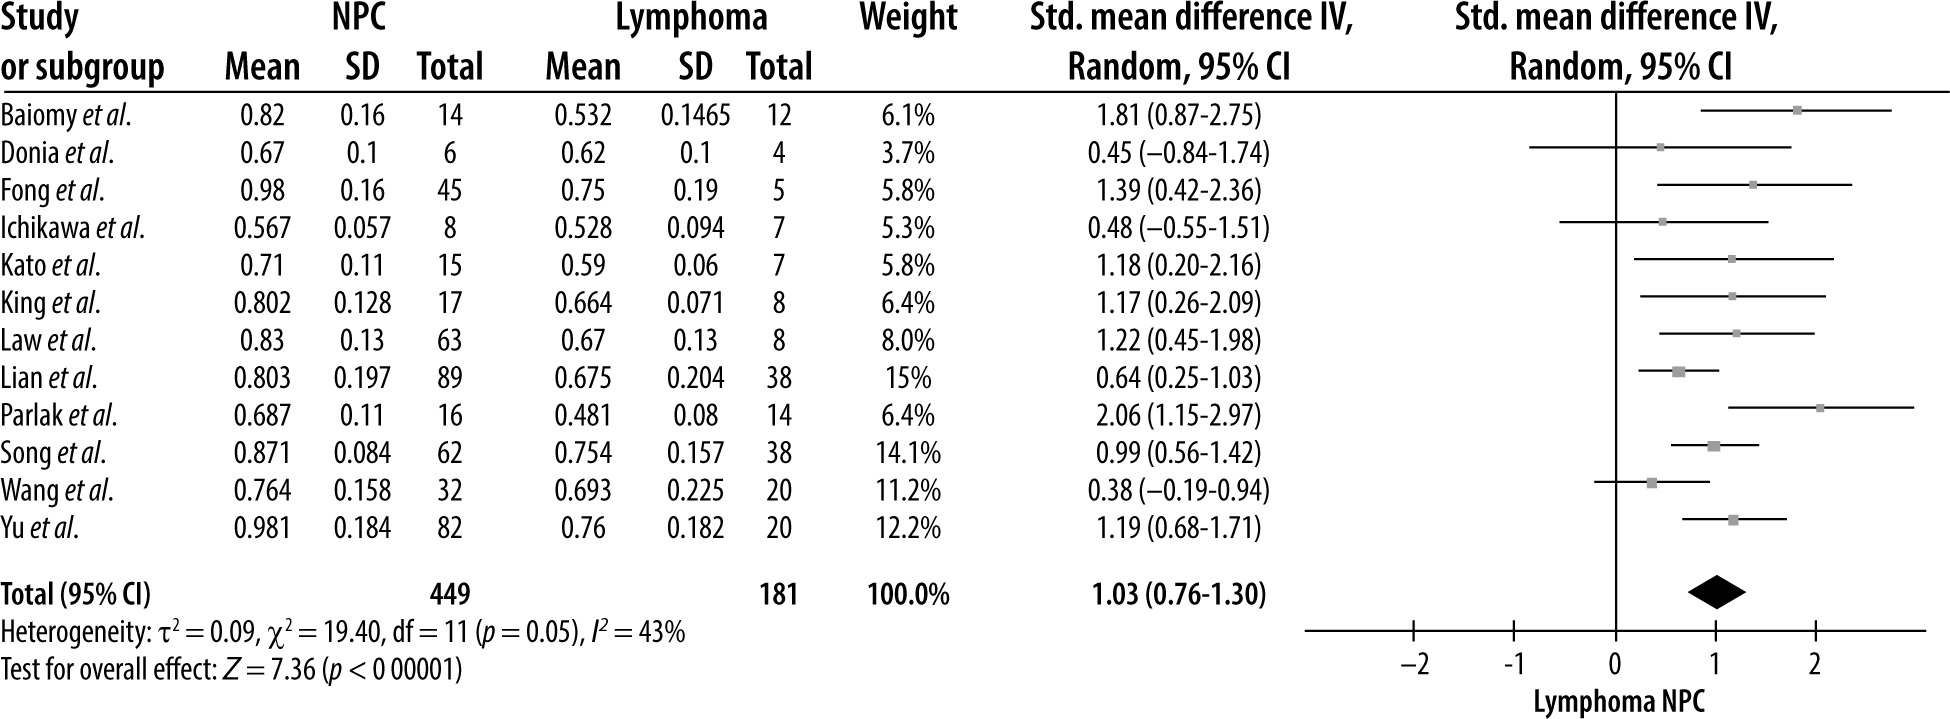
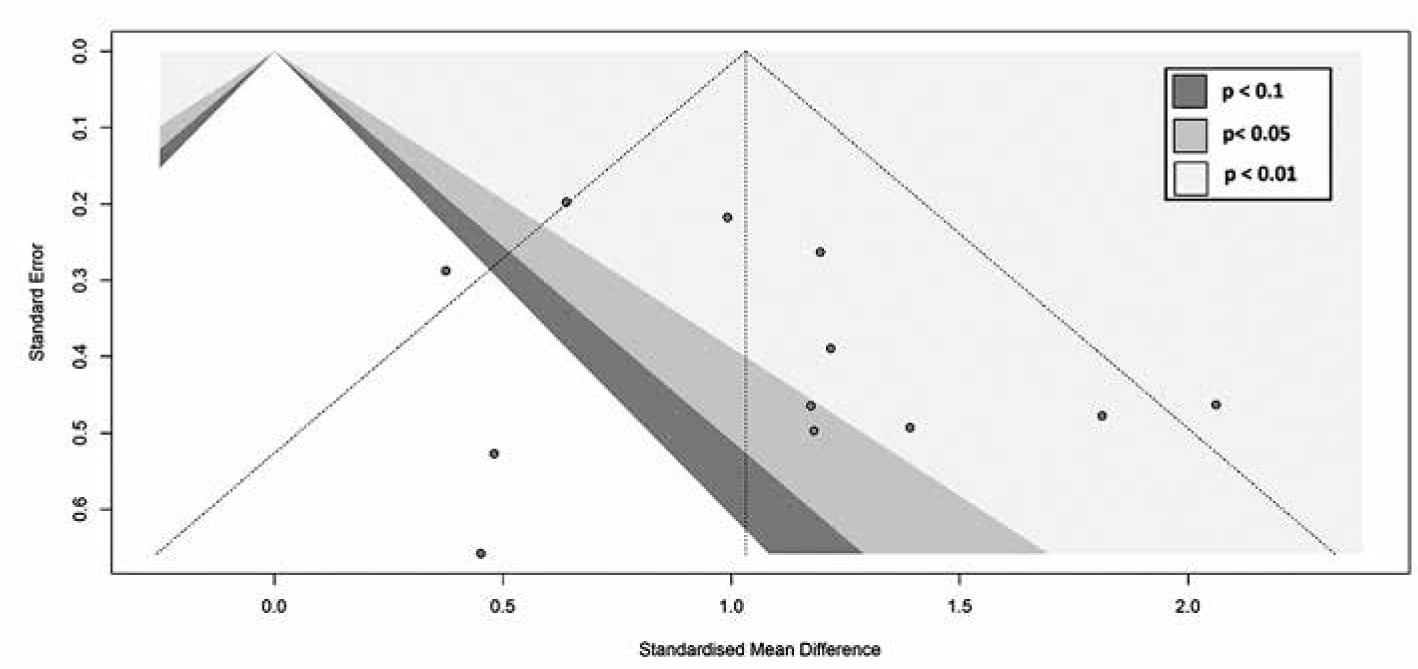
A random-effects model meta-analysis of the 12 studies resulted in an SMD of 1.03 (CI = 0.76, 1.30) (p < 0.00001), indicating that NPC lesions had a significantly higher ADC value than lymphoma (Figure 2). For testing heterogeneity, an I2 of 43% (Q = 19.40 and df = 11) with a p-value of 0.05 showed there was not a significant heterogeneity among studies. According to Begg’s test, no publication bias was found for the ADC value (p = 1.00) (Figure 3).
Subgroup analysis of the ADC difference between NPC and lymphoma
After performing a subgroup analysis, the test for subgroup differences showed that the SMD of the ADC value for NPC was significantly higher in studies using a magnetic field strength of 1.5T (c2 = 4.51, df = 1, p = 0.03, and I2 = 77.8%) and paediatric populations (c2 =9.2, df = 1, p = 0.002, and I2 = 89.1%). The SMD of the ADC was higher in subgroups such as primary tumour site and TR < 3000 ms. However, the difference was not statistically significant (p > 0.05, data available in Supplementary File 2).
Diagnostic performance of ADC for differentiating NPC from lymphoma
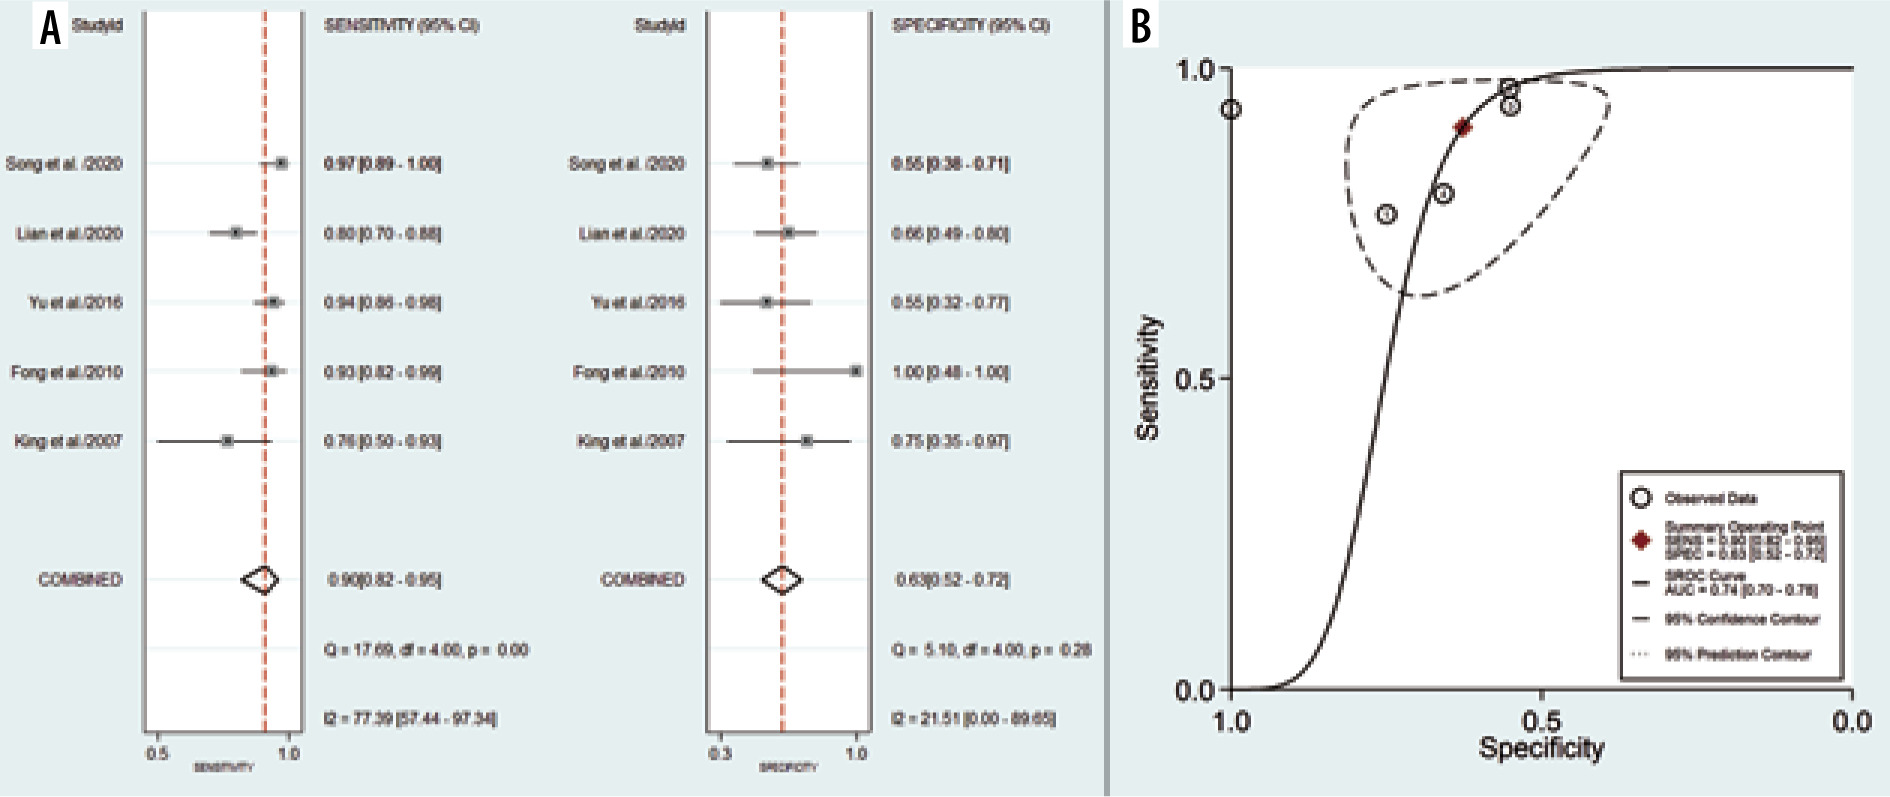
Five studies, consisting of 109 lymphoma and 295 NPC lesions, reported the diagnostic test performance of the ADC value and demonstrated a pooled sensitivity and specificity of 0.90 (95% CI: 0.82-0.95) and 0.63 (95% CI: 0.52-0.72), respectively (Figure 4A). The HSROC had an AUC of 0.74 (95% CI: 0.70-0.78) (Figure 4B). The po-sitive likelihood ratio (PLR) and negative likelihood ratio (NLR) were 2.4 (95% CI: 1.9-3.1) and 0.15 (95% CI: 0.08-0.29), respectively, with a DOR of 16 (95% CI: 8-34). The I2 values of ADC mean for sensitivity were greater than 50% (I2 = 77.39), indicating a significant heterogeneity. For threshold analysis, the Spearman correlation coefficient was measured as 0.6 with a p-value of 0.285, indicating the absence of a threshold effect.
Meta-regression and heterogeneity exploration
A meta-regression analysis was performed to identify the potential source of heterogeneity. Several variables were considered: sample size (greater than 50 vs. less than 50), study design (prospective vs. retrospective), country (China vs. Hong Kong), magnetic field strength (3.0 vs. 1.5 T), tumour site (primary site vs. lymph nodes), TR (greater than 3000 vs. less than 3000), TE (greater than 80 ms vs. less than 80 ms), slice thickness (greater than 4 mm vs. lower than 4 mm). As seen in Table 3, the dif-ference of sensitivity and specificity between each subgroup was not significant (p-values for both sensiti-vity and specificity were higher than 0.05). Because MIDAS and METANDI modules cannot be utilized for fewer than 4 studies, I2 for each subgroup was calculated using MetaDiSc software. I2 values for sensitivity were found to be lower in studies conducted in/with 1.5 T scanners (54.1 vs. 90.07), Hong Kong (68.0 vs. 85.6), TR < 3000 ms (68 vs. 85.6), TE < 80 ms (68.2 vs. 87.1), and slice thickness < 4 mm (68.2 vs. 87.1). In addition, I2 values for specificity were found to be lower in subgroups with 3.0 T scanners (0 vs. 63.6), China (0 vs. 53.8), TR > 3000 (0 vs. 53.8), TE > 80 ms (0 vs. 67.2), and slice thickness > 4 mm (0 vs. 67.2).
Table 3
Results of meta-regression for each variable
Sensitivity analysis, clinical utility, and publication bias
When each included study was removed from the analysis one by one, no significant changes were observed, except for the study by Lian et al., which after removal resulted in AUC, sensitivity, and specificity of 0.84, 0.93, and 0.64, respectively. Moreover, the level of I2 for sensitivity decreased to 66.01. When the study by Fong et al. was removed, I2 for specificity was significantly reduced (Table 4).
Table 4
Results of sensitivity analysis after eliminating each study
According to the Fagan diagram (Figure 5A), the probability before the prediction is 25%. The likelihood of dia-gnosing NPC increases to 45% in the presence of positive DWI. When the result was negative, the post-test probability of diagnosing NPC was reduced to 5%.
Figure 5
A) Fagan plot analysis to evaluate the clinical utility of ADC for differentiation of NPC lesions from lymphoma. B) Deeks’ funnel plot
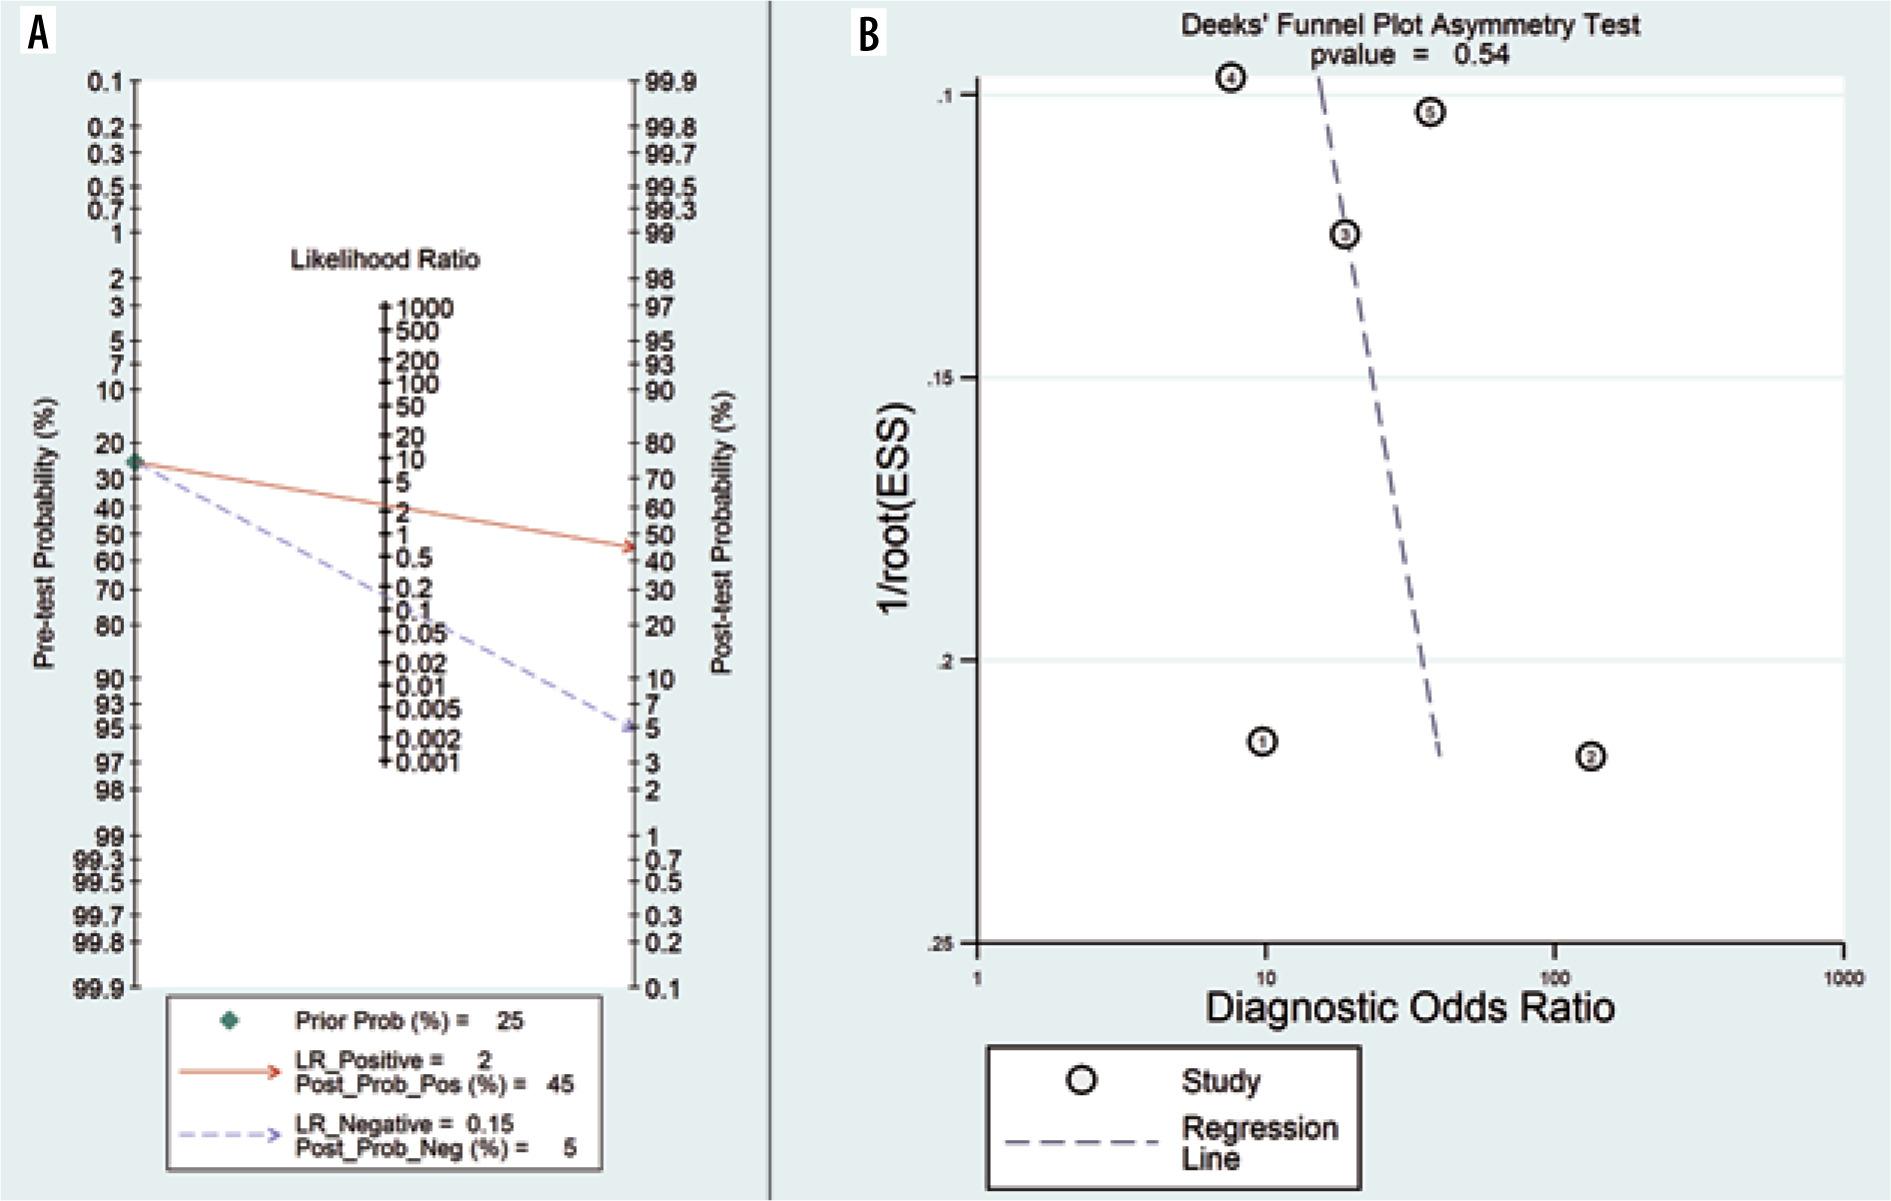
Deeks’ funnel plot asymmetry test was used to evaluate publication bias. Because the funnel plot used to measure publication bias was almost symmetrical, and the coefficient of bias showed a p-value of 0.54 (> 0.05), and a low publication bias was further validated (Figure 5B).
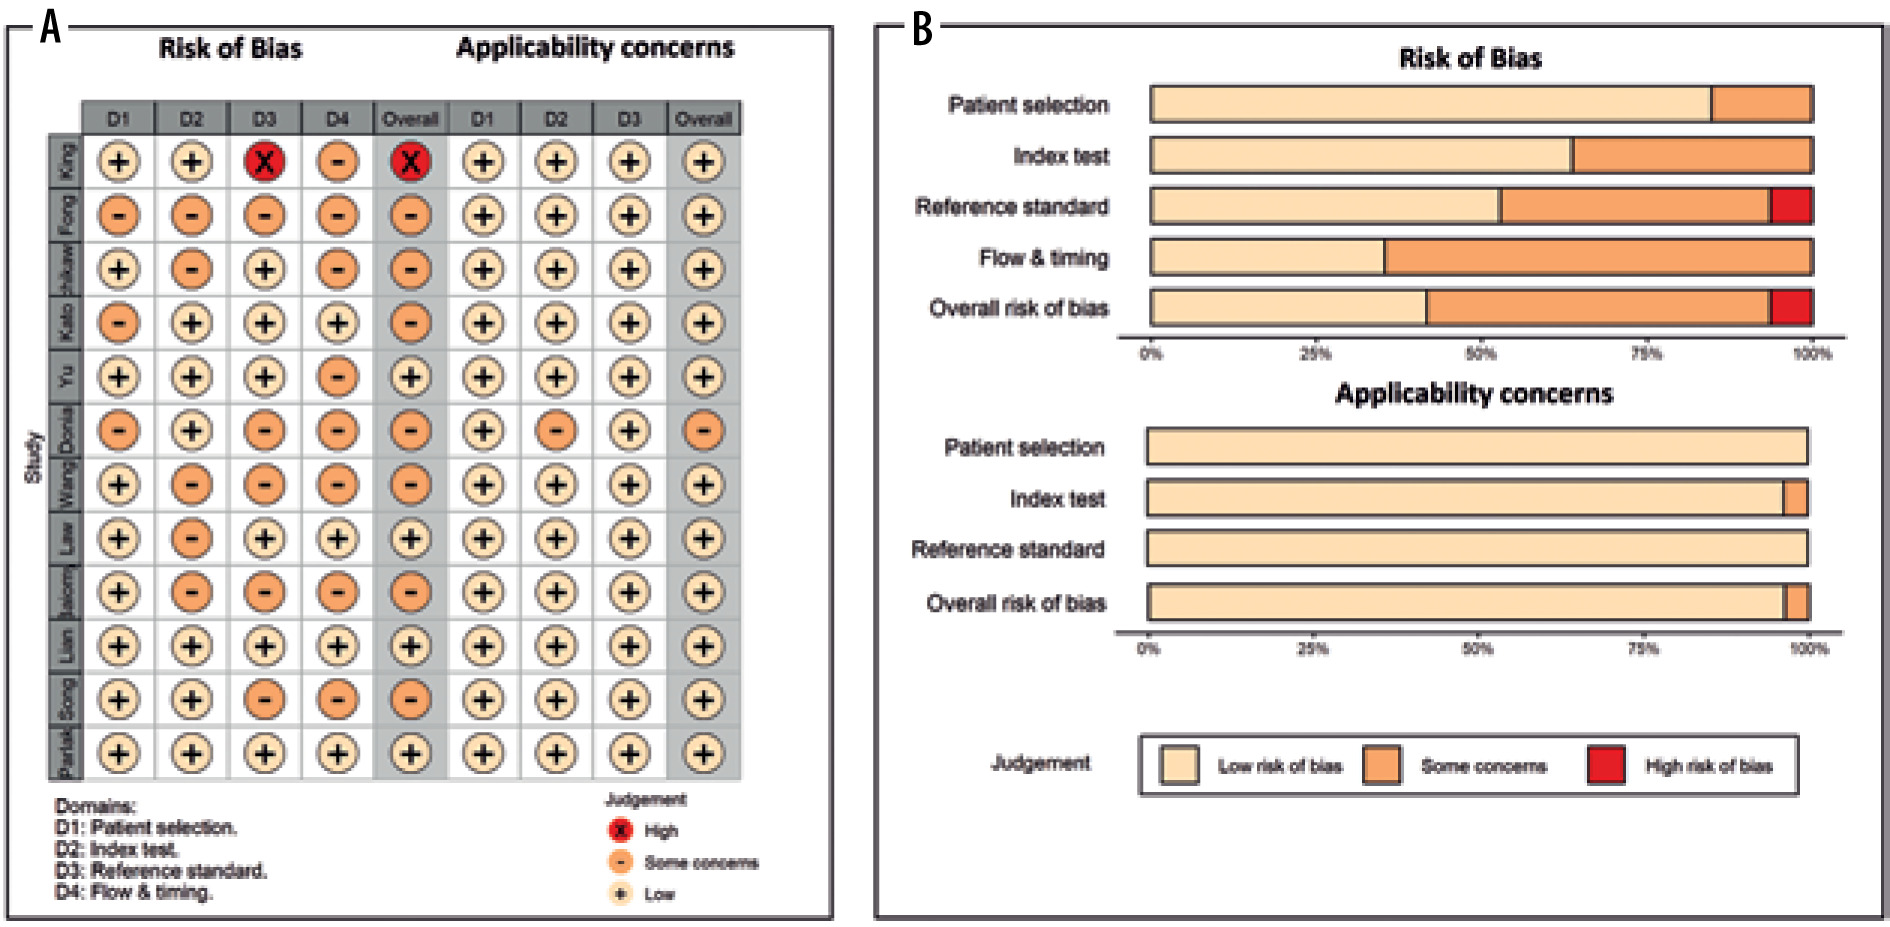
Quality assessment
The results of the QUADAS-2 assessment, including risk of bias, applicability concerns, and weight-adjusted summary plots, are depicted in Figure 6. For risk of bias assessment, the risk was low for most studies, with some concerns on patient selection domain in 3 studies due to unclear patient exclusion or study design. Similarly, some concerns existed in the index test domain for 5 studies due to unclear information regarding blinding results to the reference test. In addition, there were some concerns about 5 studies in the reference standard domain due to unclear information regarding blinding results to index test, and risk of bias was high in one study due to using imaging criteria instead of pathology for lymph nodes. In the flow and timing domain, there were some concerns about 8 studies due to unavailable information regarding the time interval between index test and reference standard. Applicability concerns were low in almost all domains.
Discussion
Nasopharyngeal carcinoma (NPC) and lymphomas are common tumours affecting the nasopharynx, and they have similar symptoms, such as epistaxis, headache, and nasal obstruction. However, they are quite different in terms of therapeutic methods to the extent that radiotherapy is the primary treatment strategy in NPC while chemotherapy is the choice for lymphoma treatment. Therefore, differentiating these 2 nasopharyngeal tumours is important for treatment optimization [2]. Traditional MRI is one of the main imaging modalities used to delineate the lesions of the nasopharynx cavity [3].
As an MRI-based technique, diffusion-weighted imaging (DWI) tracks water molecule movement through the tissue and provides insight into the main tissue structure. Generally, cellular proliferation leads to increasing tumour cellularity. Water molecules move randomly in a process called molecular diffusion. This movement depends on tissue cellularity and extra- or intracellular compartments, which inversely is correlated with tissue cellularity and cellular membrane integrity [36]. Consequently, the magnitude of water molecule movement is altered. Thus, we record a different DWI in normal and neoplastic tissue. Also, we can quantitatively evaluate the magnitude of water molecule movement utilizing a quantitative DWI parameter: the apparent diffusion coefficient (ADC) [37]. DWI not only has excellent diagnostic performance for the differentiation of malignant from benign lesions in several malignancies [38-41] but can also be helpful in distinguishing 2 distinct malignant tumours from each other [17,42]. Differences in cellularity, necrosis, and perfusion can explain why each tumour has a specific range of ADC [29].
In terms of histopathology, nasopharyngeal carcinoma differs from other squamous cell carcinomas in the head and neck region [43]. In line with this, the ADC value of NPCs was found to fall between lymphomas and squamous cell carcinomas (SCC) in both primary sites and lymph nodes [29,30,32]. Because ADC values of NPC are closer to lymphomas than to other SCC, distinguishing NPC from lymphoma can be more challenging due to possible overlaps between their ADC values [30]. A pre-vious meta-analysis has shown that metastatic lymph nodes, which originated from squamous cell carcinomas, have a higher ADC value compared to lymphomatous ones in the head and neck region (SMD = 1.36), and using the ADC value for differentiating them yields an excellent diagnostic performance (sROC AUC of 0.936) [19].
The aim of this study was to evaluate the applicability of the ADC value for differentiating NPC from lymphomas. By assessing 12 studies published between 2007 and 2022, we have observed that NPC lesions had a significantly higher ADC value than lymphomas (SMD = 1.03). The results of our subgroup analysis showed that this difference is more elevated in paediatric populations and studies that used 1.5 T scanners. In addition, NPC lesions had a higher ADC value in primary tumour sites and studies with TR < 3000 ms, although this difference is not statistically significant. Then we investigated its diagnostic test performance according to 5 studies and found that the pooled sensitivity, specificity, and AUC of ADCmean were 0.90, 0.63, and 0.74, respectively, which shows moderate diagnostic performance with a high pooled sensitivity but relatively low specificity. In addition, cut-off values ranged from 0.694 to 0.77 in 4 studies. However, we observed a significant between-study heterogeneity regarding pooled sensitivity (I2 = 77.39); thus, we performed a meta-regression analysis. It was found that I2 was lower in studies that used 1.5 T scanners, were conducted in Hong Kong, or had repetition time, echo time, and slice thickness lower than 3000 ms, 80 ms, and 4 mm, respectively. Results of funnel plots and statistical analysis suggested no substantial publication bias in our meta-analysis, and the diagnostic threshold analysis did not reveal any noticeable threshold effects.
Overall, there was a low risk of bias in the studies that were assessed, and they were appropriately performed. Nevertheless, because these MRI techniques are based on a small number of studies, their diagnostic performance data should be interpreted with caution.
This systematic review has several limitations. First, the number of included studies, especially for the diagnostic test accuracy (DTA) part, was relatively small. Overall, the prevalence of NPC is low worldwide, except in some endemic regions. Thus, the included studies also had a small sample size, limiting the reliability of the subgroup and heterogeneity analysis results. In addition, the included studies did not investigate the difference between distinct subtypes of NPC and lymphomas. It should be noted that ADC values are different in distinct subtypes of lymphomas (e.g. Hodgkin’s vs. non-Hodgkin’s), as shown previously [44]. The prevalence of the undifferentiated NPC subtype seems to be higher in Southeast Asia [45], while in the United States [46], most patients presented with keratinizing squamous cell carcinoma followed by undifferentiated subtype. Because the ADC value reflects cellularity, well-differentiated carcinomas were shown to have a higher ADC than poorly differentiated ones in the pharyngeal cavity. Considering this point, it can be concluded that in populations where the prevalence of the differentiated type is higher, due to the reduction of the overlap of this parameter with lymphoma, the specificity of the test may increase. Unfortunately, in this meta-analysis, the patient population was limited to African and Asian countries, which makes it necessary to conduct a thorough investigation in American countries.
Conclusions
This systematic review and meta-analysis showed that nasopharyngeal carcinoma has a significantly higher ADC value than lymphomas. In addition, although ADC has excellent sensitivity for differentiating between these 2 types of tumours, its specificity is relatively low, yielding a moderate diagnostic performance.