


Introduction
Pancreatic ductal adenocarcinoma (PDAC) is one of the most aggressive cancers. It has a poor prognosis, and the five-year survival rate is less than 4% [1-3]. This high mortality rate is due to the cancer’s biological aggressiveness and advanced state at the time of diagnosis [4]. In recent years, the incidence of PDAC has been increasing, and it is projected to be the second most common cause of cancer-related death in the United States in 2020 [5].
Meanwhile, pancreatic neuroendocrine tumour (PNET) is a rare pancreatic tumour originating from pluripotent stem cells in the ductal epithelium [2,6]. PNET is pathologically classified into G1, G2, and G3 according to Ki-67 index. G1 and G2 indicate well-differentiated PNET, and G3 indicates a poorly differentiated neuroendocrine carcinoma [7]. The five-year survival rate ranges from 60-100% for well-differentiated PNET to 29% for poorly differentiated PNET [8].
Surgery is the only curative treatment for patients with PNET or PDAC. Patients with PDAC need a more radical surgery that includes lymphadenectomy [4,9,10], while those with PNET, which is non-invasive and smaller in size (< 20 mm), may only require a limited resection without lymphadenectomy, such as tumour enucleation, central pancreatectomy, or laparoscopic surgery [10]. Therefore, it is important to differentiate between PNET and PDAC preoperatively to estimate the prognosis and plan a surgical strategy.
PNET usually shows arterial enhancement with progressively decreased enhancement [2,3,6,11]. Although clinicians can easily diagnose PNET on preoperative imaging because, other than PNET, the number of hypervascular pancreatic tumours is very small [11], up to 48.6% of PNET does not show arterial enhancement, as is common in most PDAC [9,12,13]. Therefore, non-hypervascular PNET can be a differential diagnosis during assessment for PDAC via imaging.
Only a few studies have focused on the differences between non-hypervascular PNET and PDAC found on diagnostic images. The purpose of this study was to evaluate the findings on dynamic computed tomography (CT) and non-enhanced magnetic resonance imaging (MRI) for differentiation between non-hypervascular PNET and PDAC.
Material and methods
Patient selection
This retrospective cohort study was approved by the review board of our institution, and the need for informed consent was waived. The records of the patients with pathologically proven PNET or PDAC were reviewed when clinical information was available. All patients underwent surgery, including pancreatoduodenectomy, distal pancreatectomy, central pancreatectomy, and tumour enucleation, between April 2011 and June 2017. According to the European Society for Medical Oncology (ESMO) Clinical Practice Guidelines, dynamic CT plays a central role in the evaluation of pancreatic tumour, especially when pancreatic cancer is suspected, and should be the first choice of imaging investigation [14]. Furthermore, MRI could be useful as a supplementary imaging modality to evaluate vessel involvement and biliary anatomy, detect liver metastasis not detected by CT, and differentiate cystic lesions [14]. Based on the literature, we evaluated pancreatic tumours with dynamic CT and non-enhanced MRI. The inclusion criteria were as follows: (a) patients who underwent dynamic CT and non-enhanced MRI according to our institutional routine protocol within six months before surgery and (b) patients who had a detectable tumour, and the region of interest (ROI) could be set via CT and MRI. Meanwhile, the exclusion criteria were patients who had tumours with visually higher enhancement than pancreatic parenchyma on arterial phase.
CT scanning protocol
All CT images were obtained using either a 64-channel scanner (SOMATOM Perspective, Siemens, n = 34) or a 128-channel scanner (SOMATOM Definition Flash, n = 32 or SOMATOM Definition AS+, Siemens, n = 36). The scanning protocol consisted of non-enhanced and biphasic contrast-enhanced scans. The non-enhanced phase was obtained through the upper abdomen, including the entire liver and pancreas. Then, a bolus of 600 mgI/kg of iodine contrast medium was administered using an automatic power injector at a rate of 2.0-3.0 ml/s for 33 seconds. The contrast media used included iohexol (Omnipaque 350 Injection, Daiichi Sankyo, n = 34 or IOVERIN 350, Teva Takeda Pharma, n = 25), iopamidol (Iopamiron 370 Inj., Bayer Yakuhin, n = 20 or Oypalomin 370 injection, Fuji Pharma, n = 18), or iomeprol (Iomeron 350, Eisai, n = 5). Arterial phase was obtained 10 seconds after reaching 80 Hounsfield units with the ROI placed on the aorta at the level of the celiac artery, while portal venous phase was obtained 90 seconds after triggering. The arterial and portal venous phases were obtained through the upper abdomen and through the whole abdomen, respectively.
MRI scanning protocol
All MRI images were acquired using a 1.5-T whole-body MRI system with a six-channel phased array as the receiver coil (MAGNETOM Avanto, Siemens, n = 43 or MAGNETOM Symphony, A Tim System, Siemens, n = 59). The following objects were analysed in the routine abdominal MRI protocol: transverse T1-weighted image (T1WI) using a fat-saturated 2D or 3D gradient echo (2D fast low-angle shot or 3D volumetric interpolated breath-hold sequence; transverse T2-weighted image (T2WI) with fast spin-echo; and transverse diffusion-weighted image (DWI) performed as a single-shot echo-planar imaging pulse sequence with b-values of 50 and 800 sec/mm2 using respiratory triggering. The apparent diffusion coefficient (ADC) was calculated with β values of 50 and 800 sec/mm2. The MRI pulse sequence parameters are summarised in Table 1.
Table 1
Pulse sequence parameters for 1.5-T MR imaging
[i] FLASH – fast low-angle shot, VIBE – volumetric interpolated breath-hold examination (T1-weighted gradient-echo sequences, which are referred to as “FLASH” and “VIBE” on Siemens Healthcare MRI systems), T2WI – T2-weighted imaging, DWI – diffusion-weighted imaging, TR – repetition time, TE – echo time, FA – flip angle, FOV – field of view, ST – slice thickness, BW – bandwidth, AT – acquisition time, ETL – echo train length, MR – magnetic resonance
Imaging analysis
An abdominal radiologist with 11 years of experience, who was blinded to pathological diagnosis and clinical information, retrospectively reviewed anonymised dynamic CT and non-enhanced MRI images on a Picture Archiving and Communication Systems workstation monitor.
For qualitative analysis, the following imaging parameters were evaluated: (a) tumour margin (well-defined or ill-defined), (b) cystic change or necrosis (present or absent), (c) calcification (present or absent), (d) upstream pancreatitis (present or absent), and (e) dilated main pancreatic duct (present or absent). Upstream pancreatitis was defined as pancreatic parenchyma showing high intensity on DWI and low intensity on fat-saturated T1WI. The dilated main pancreatic duct was defined as positive when its diameter was more than 3 mm. Pancreatic parenchyma was defined as a presumed non-pathological pancreatic region in which focal abnormalities such as pancreatitis and/or cystic lesions were not included.
For quantitative analysis, the following parameters were evaluated: (a) tumour size, (b) CT attenuation and MRI signal intensity of tumour and pancreatic parenchyma, (c) ADC values of tumour, (d) CT attenuation and MRI signal intensity ratios of tumour to pancreatic parenchyma, and (e) enhancement ratio of tumour (ERT). ROI was set to the largest solid portion of the tumour, avoiding the cystic component on CT images of non-enhanced, arterial phase, and portal venous phase, and on MRI images of fat-saturated T1WI, T2WI, DWI, and ADC map. We measured the density and signal intensity three times by ROI, and the average value was calculated. The CT attenuation and MRI signal intensity ratios of tumour to pancreatic parenchyma were calculated using the following formula: mean CT attenuation or MRI signal intensity of tumour/mean CT attenuation or MRI signal intensity of pancreatic parenchyma. The ERT during arterial and portal venous phases were calculated as follows: (Tp-Ta)/(Ta-Tn), where Tn, Ta, and Tp were the attenuation of the tumour in Hounsfield units, measured during non-enhanced, arterial, and portal venous phase, respectively.
To assess the reproducibility of significant variables, a second radiologist with three years of experience in abdominal imaging evaluated variables that showed significant differences on multivariate analyses, while being blinded to the pathological and clinical information.
Statistical analysis
Fisher’s exact test was used for qualitative variables, and the Mann-Whitney U test was used for quantitative analysis. Multivariate logistic regression analysis was performed using variables estimated to be related to outcomes based on knowledge and clinical judgment from previous reports [6,10,11,13].
The diagnostic performance of each quantitative variable was estimated via receiver operating characteristic (ROC) analysis. The optimal thresholds for differentiating between the PNET group and the PDAC group were chosen at the highest possible sensitivity and specificity on the ROC curves. Variables set with optimal thresholds were fit to the multivariate logistic regression analysis. Statistical analysis was executed using Ekuseru-Toukei 2015 (SSRI, Tokyo, Japan) and R (The R Project for Statistical Computing, version 3.3.0). For all tests, a p-value of less than 0.05 was considered statistically significant. Inter-observer agreement of findings was evaluated by calculating κ values for dichotomous variables or intraclass correlation coefficients (ICC) for continuous variables. The κ values and ICC were classified as follows: 1.0 was considered to indicate perfect agreement; 0.81-0.99, almost perfect agreement; 0.61-0.80, substantial agreement; 0.41-0.60, moderate agreement; 0.21-0.40, fair agreement; and ≤ 0.20, slight agreement.
Results
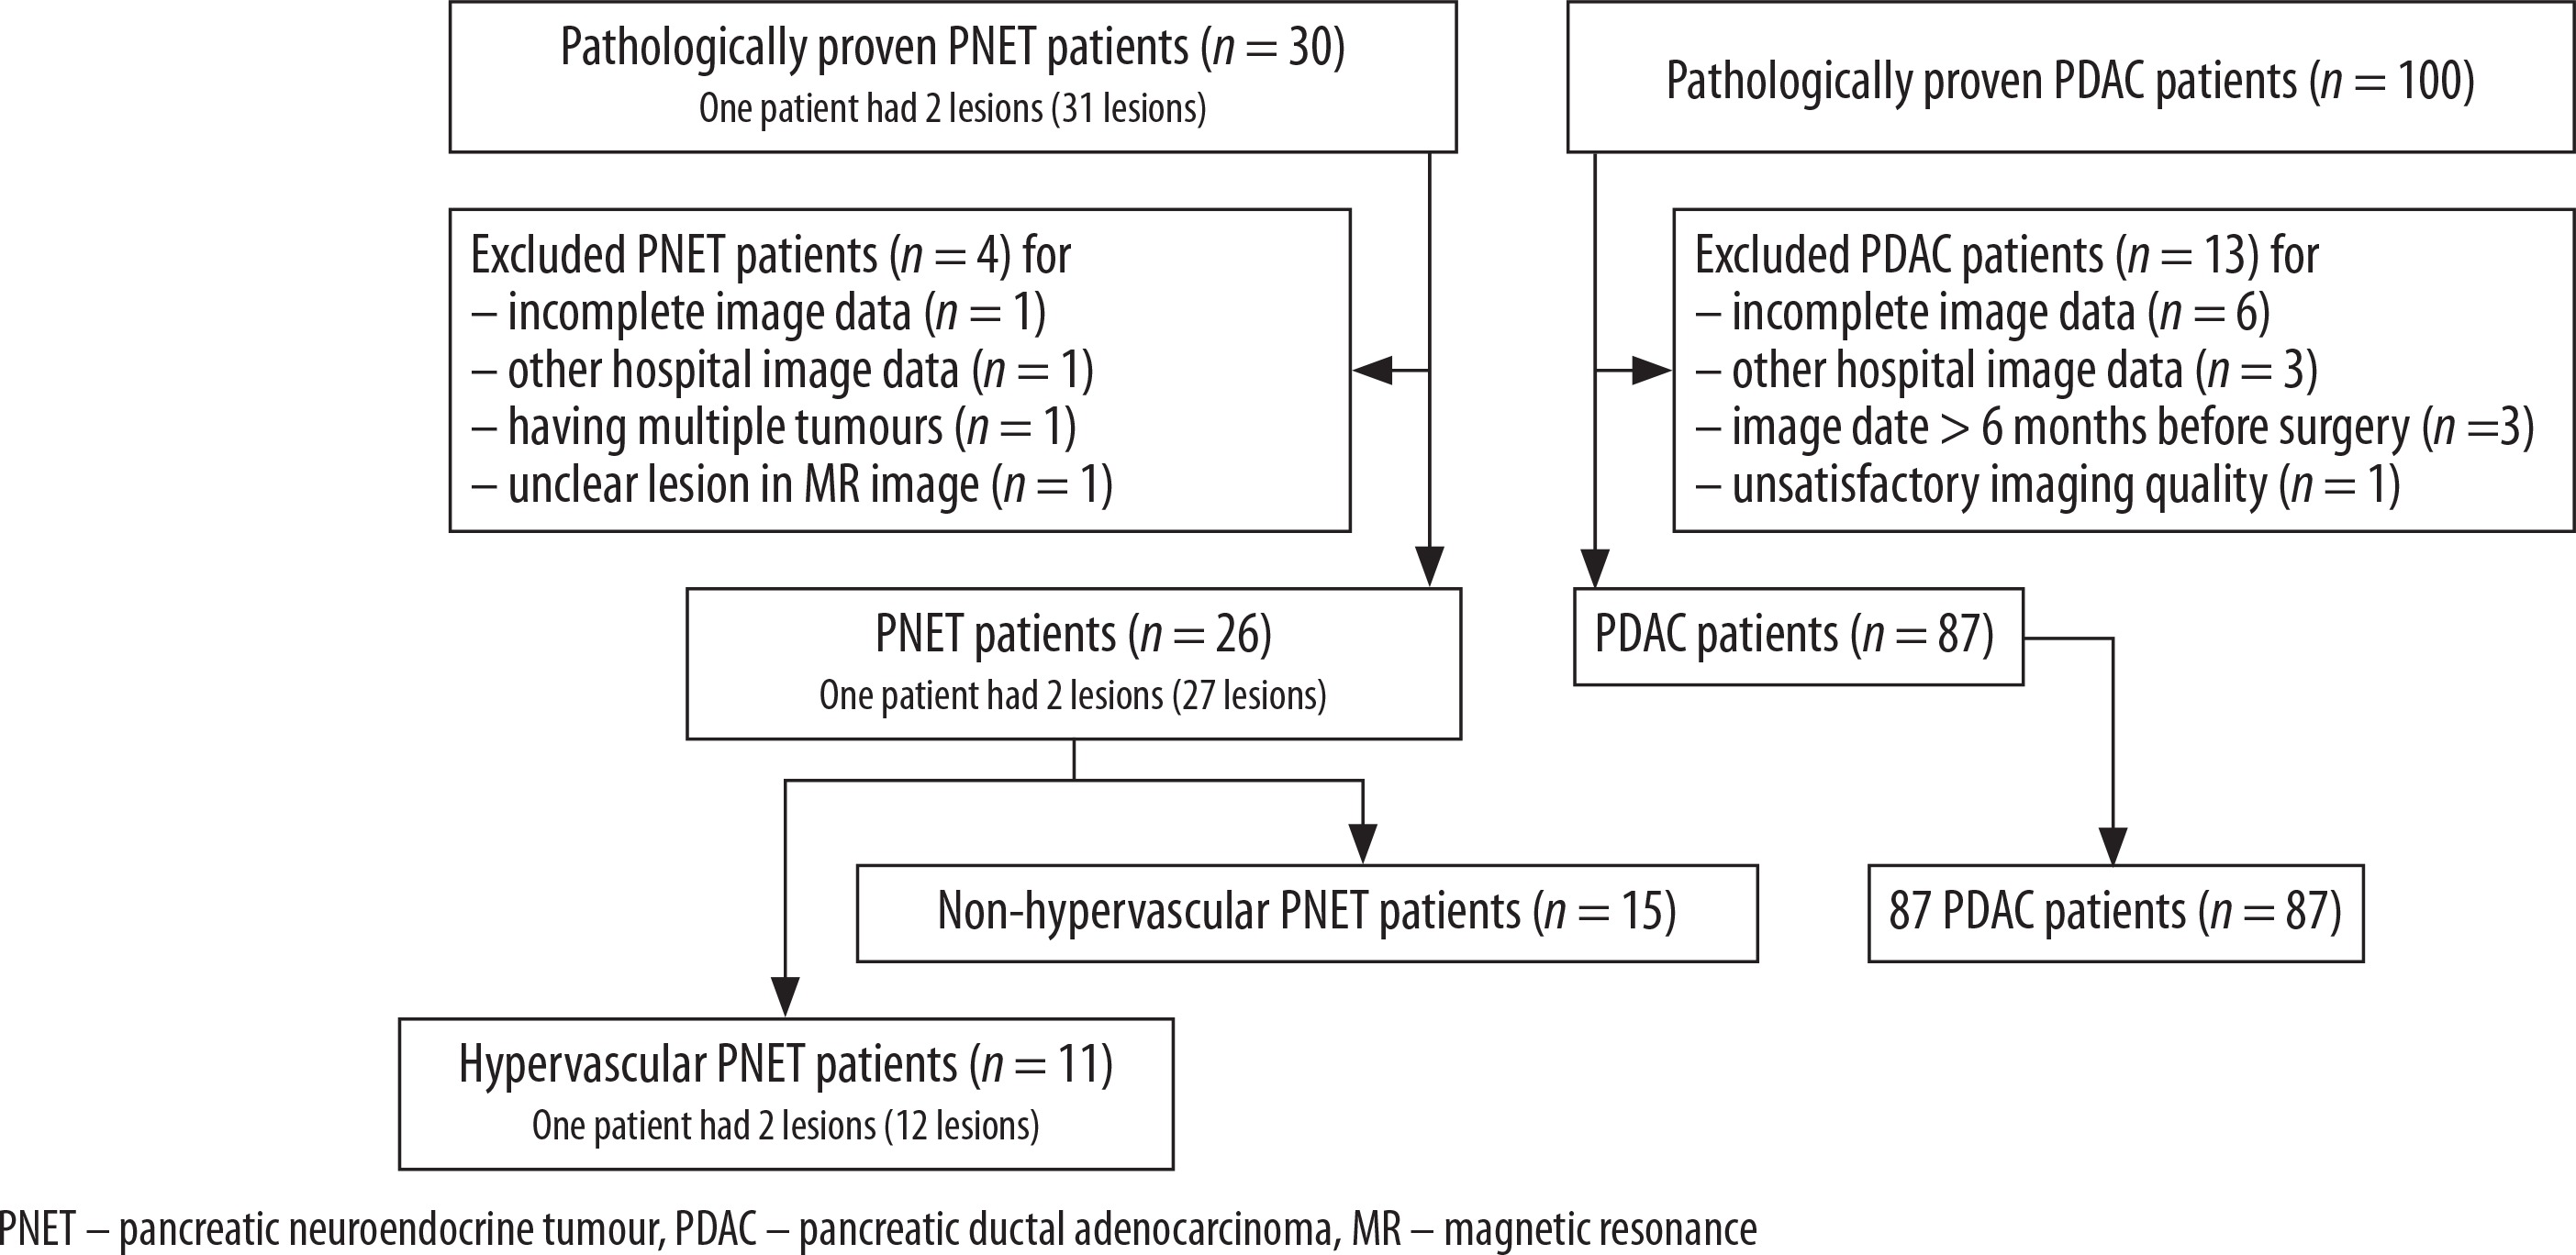
A total of 102 patients (15 patients with non-hypervascular PNET and 87 patients with PDAC) met the inclusion criteria (Figure 1). All included patients each had one lesion. No patients with hypervascular PDAC were identified. The cohort consisted of 58 men and 44 women, with an average age of 66 years (range: 31-84 years). The surgeries performed in this study were pancreatoduodenectomy, distal pancreatectomy, central pancreatectomy, and tumour enucleation; the breakdown was as follows: 3 (20%), 7 (47%), 3 (20%), and 2 (13%) patients with PNET and 51 (59%), 36 (41%), 0, and 0 patients with PDAC underwent such surgeries, respectively. Based on the 2010 World Health Organisation classification system, of 15 PNETs, five tumours (33.3%) were classified as G1, eight (55.3%) were classified as G2, and two (13.3%) were classified as G3.
The results of patient and tumour characteristic analyses are summarised in Table 2. The mean ROI of the tumours was 121.5 ± 88.5 mm2. Age and tumour size showed significant differences. PNET patients were younger (p < 0.001), and their tumour sizes were smaller than those of PDAC patients (p = 0.04).
Table 2
Results of patient and tumour characteristics
The results of quantitative and qualitative assessments are presented in Table 3. The well-defined margin was significantly different between non-hypervascular PNET and PDAC (p < 0.001). Only two PNETs (13.3%) showed ill-defined margin. These two tumours were poorly differentiated neuroendocrine carcinomas classified as histopathological G3. The remaining 13 tumours were G1 or G2. The absence of both upstream pancreatitis and dilated main pancreatic duct was significant between non-hypervascular PNET and PDAC (p < 0.001) (Figures 2-4). On univariate analysis, CT attenuation ratio of tumour to pancreatic parenchyma on arterial phase (p < 0.001) and ERT (p < 0.001) showed a significant difference, but CT attenuation ratio of tumour to pancreatic parenchyma on portal venous phase did not (p = 0.05). MRI signal intensity ratio of tumour to pancreatic parenchyma on all sequences and ADC also did not show a significant difference on univariate analysis.
Table 3
Results of quantitative and qualitative assessment
| Variable | PNET (n = 15) | PDAC (n = 87) | p-value | |
|---|---|---|---|---|
| Tumour margin | ||||
| Well-defined | 13 (87) | 3 (3) | < 0.001 | |
| Ill-defined | 2 (13) | 84 (97) | ||
| Cystic change or necrosis | ||||
| Absent | 12 (80) | 62(71) | 0.75 | |
| Present | 3 (20) | 25 (29) | ||
| Calcification | ||||
| Absent | 13 (87) | 82 (94) | 0.27 | |
| Present | 2 (13) | 5 (6) | ||
| Upstream pancreatitis | ||||
| Absent | 14 (93) | 41 (47) | < 0.001 | |
| Present | 1 (7) | 46 (53) | ||
| Dilated main pancreatic duct | ||||
| Absent | 13 (87) | 25 (29) | < 0.001 | |
| Present | 2 (13) | 62(71) | ||
| Non-enhanced phasea | 0.881 (0.791-0.930) | 0.897 (0.755-1.000) | 0.59 | |
| Arterial phasea | 0.866 (0.650-1.066) | 0.585 (0.508-0.645) | < 0.001 | |
| Portal venous phasea | 1.013 (0.898-1.233) | 0.921 (0.791-1.062) | 0.05 | |
| Enhancement ratio of tumour (ERT)b | 0.000 (-0.152-0.701) | 1.000 (0.681-1.433) | < 0.001 | |
| Fat-saturated T1-weighted imagea | 0.649 (0.540-0.777) | 0.665 (0.596-0.752) | 0.80 | |
| T2-weighted imagea | 1.279 (1.049-1.493) | 1.190 (1.052-1.387) | 0.62 | |
| Diffusion-weighted imagea | 1.577 (1.409-1.941) | 1.500 (1.220-1.860) | 0.44 | |
| ADC (x10-3 mm2/sec) | 1.214 (1.010-1.437) | 1.283 (1.159-1.412) | 0.40 | |
Numbers in parentheses are percentages.
Tn, Ta, and Tp are the attenuation of tumour (in Hounsfield Units) during non-enhanced, arterial, and portal venous phase measured, respectively.
Continuous variables are expressed as median and interquartile range (25-75 percentile).
PNET - pancreatic neuroendocrine tumour, PDAC - pancreatic ductal adenocarcinoma, ADC - apparent diffusion coefficient, CT - computed tomography, MR - magnetic resonance
Figure 2
Imaging results from a 36-year-old man with non-hypervascular pancreatic neuroendocrine tumour (PNET) in the body of the pancreas.A) Fat-saturated T1-weighted image shows well-defined hypointense lesion (arrow). B) The enhanced portal venous phase computed tomography image shows iso-enhancement of the lesion relative to the adjacent parenchyma; therefore, the lesion is difficult to detect (circle) (C) and (D). The enhanced arterial phase computed tomography image shows that the lesion is hypoenhanced relative to the adjacent parenchyma and well-defined (arrow)
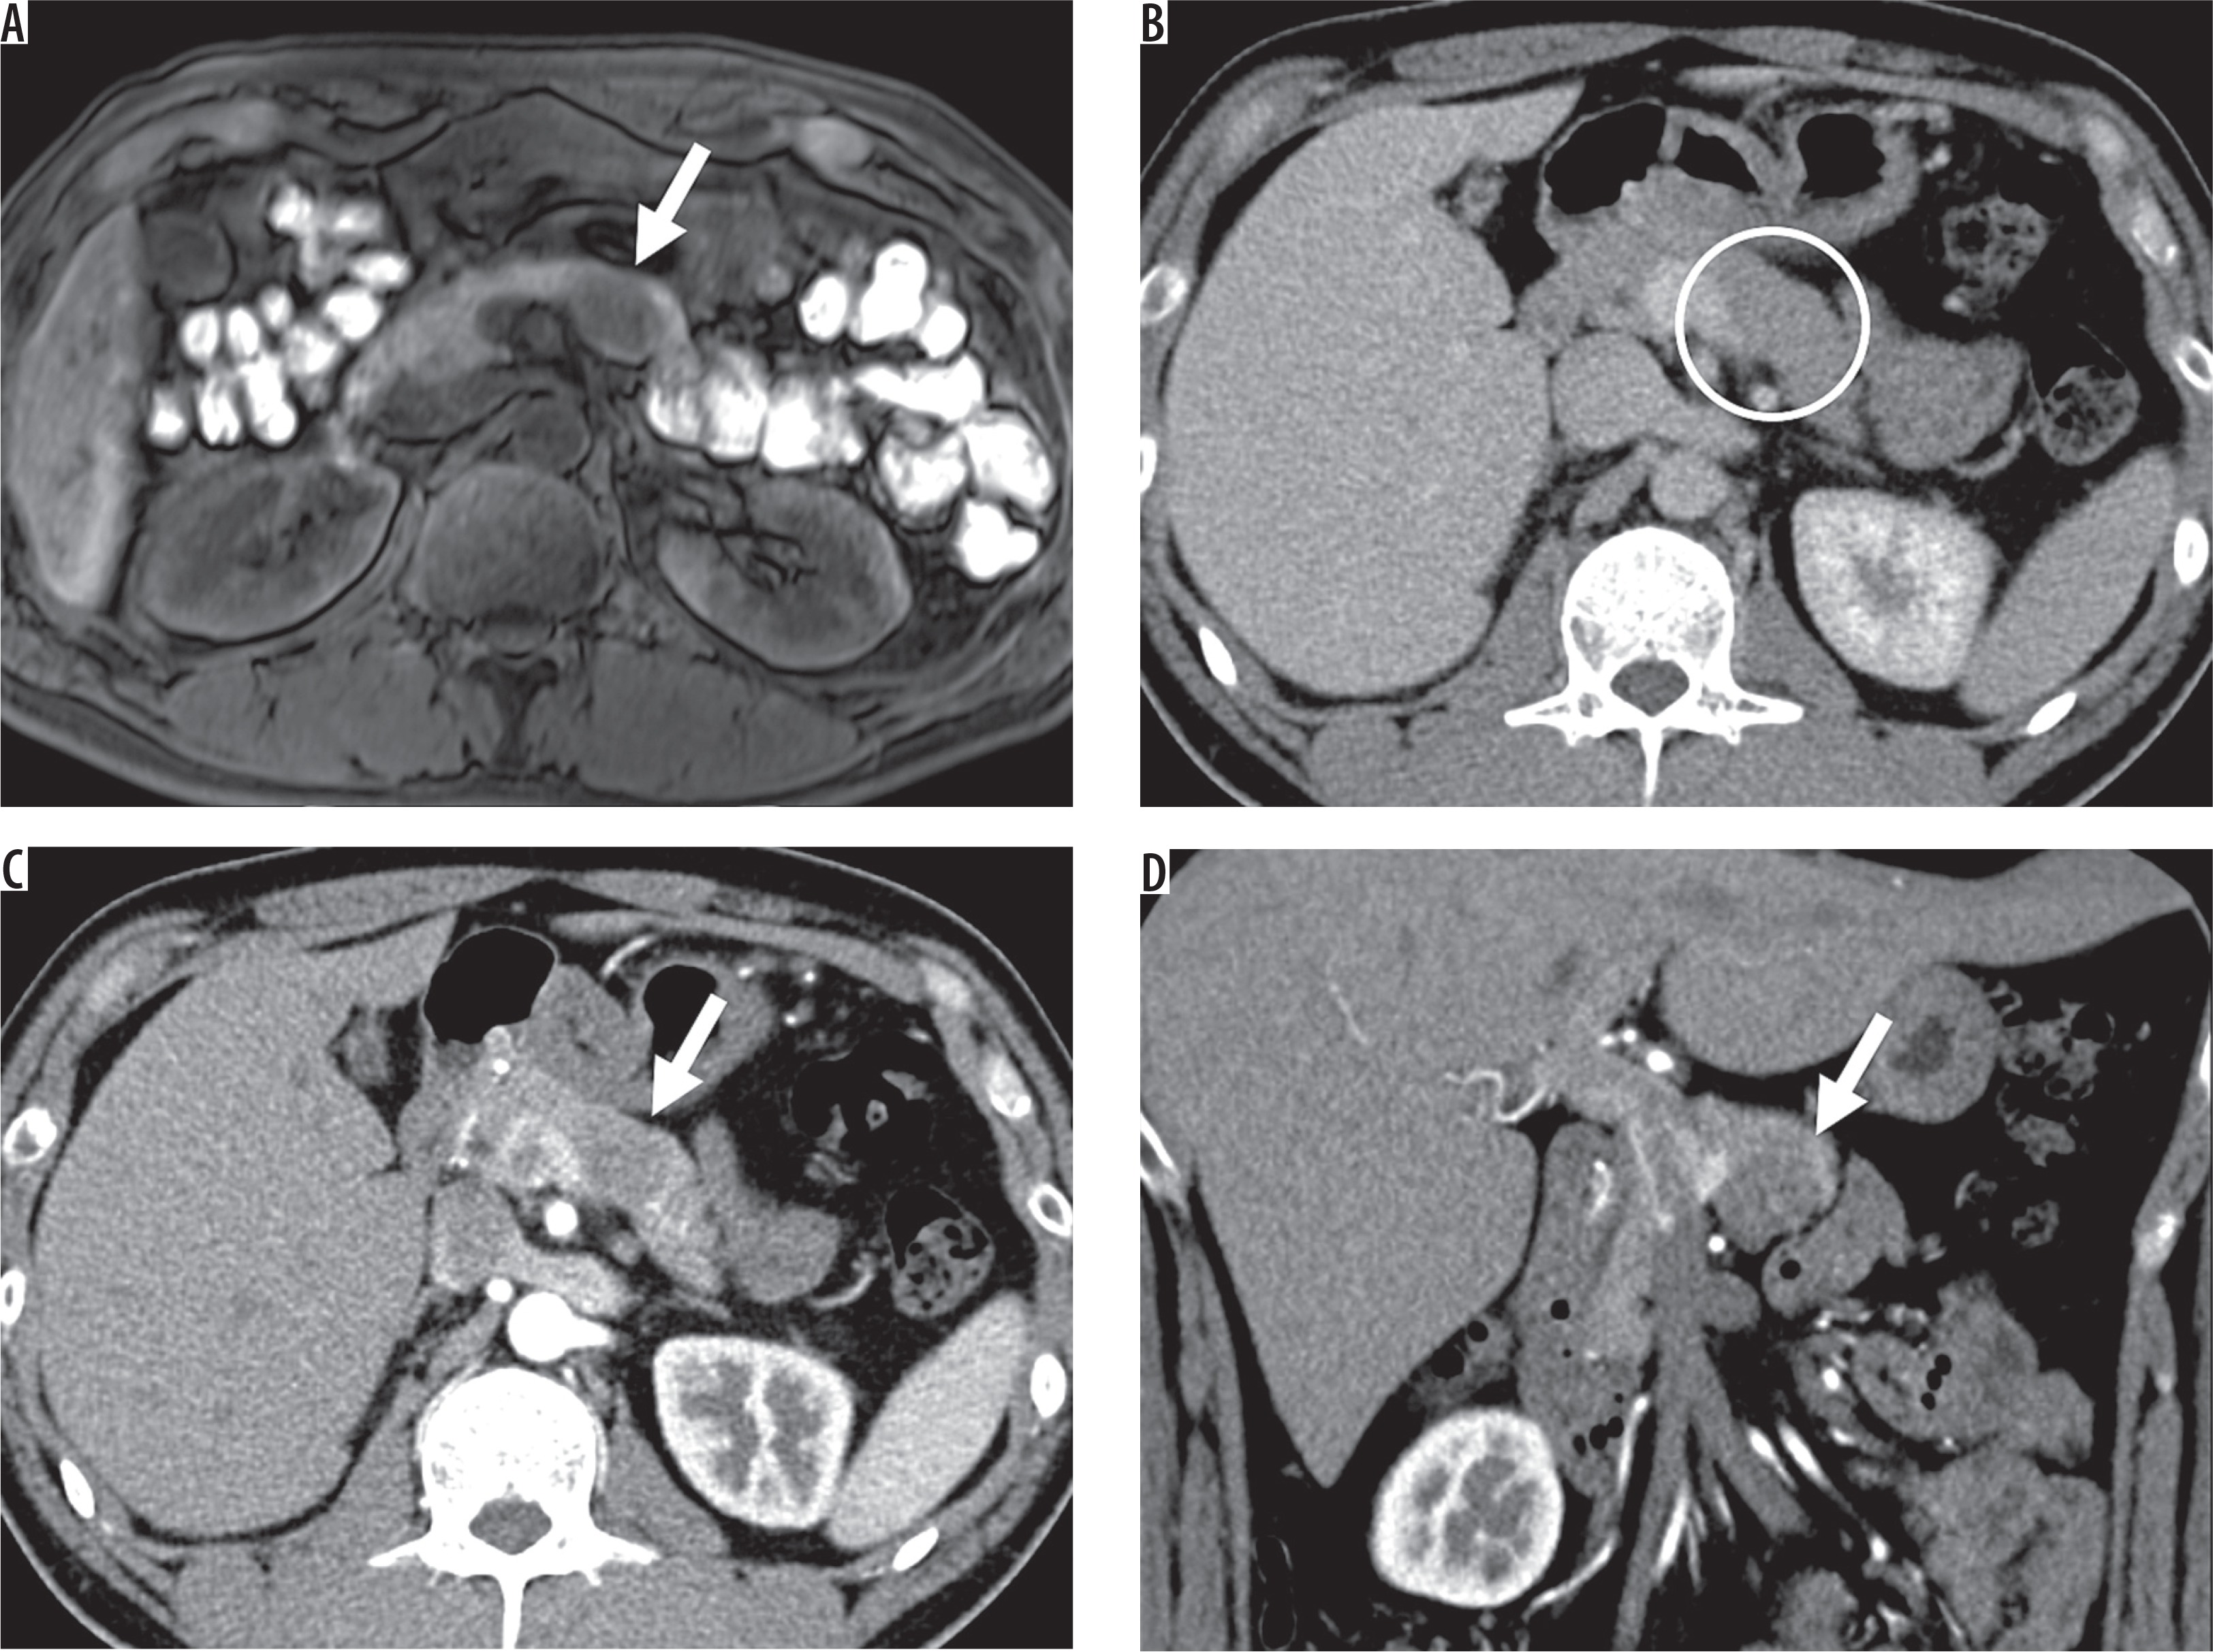
Figure 3
Imaging results from a 41-year-old man with non-hypervascular pancreatic neuroendocrine tumour (PNET) in the body of the pancreas. A) Fatsaturated T1-weighted image shows well-defined hypointense lesion (arrow). B) The enhanced portal venous phase computed tomography image shows weak enhancement of the adjacent parenchyma (arrow) (C) and (D). The enhanced arterial phase computed tomography image shows iso-enhancement of the lesion relative to the adjacent parenchyma; therefore, the lesion is difficult to detect (circle)
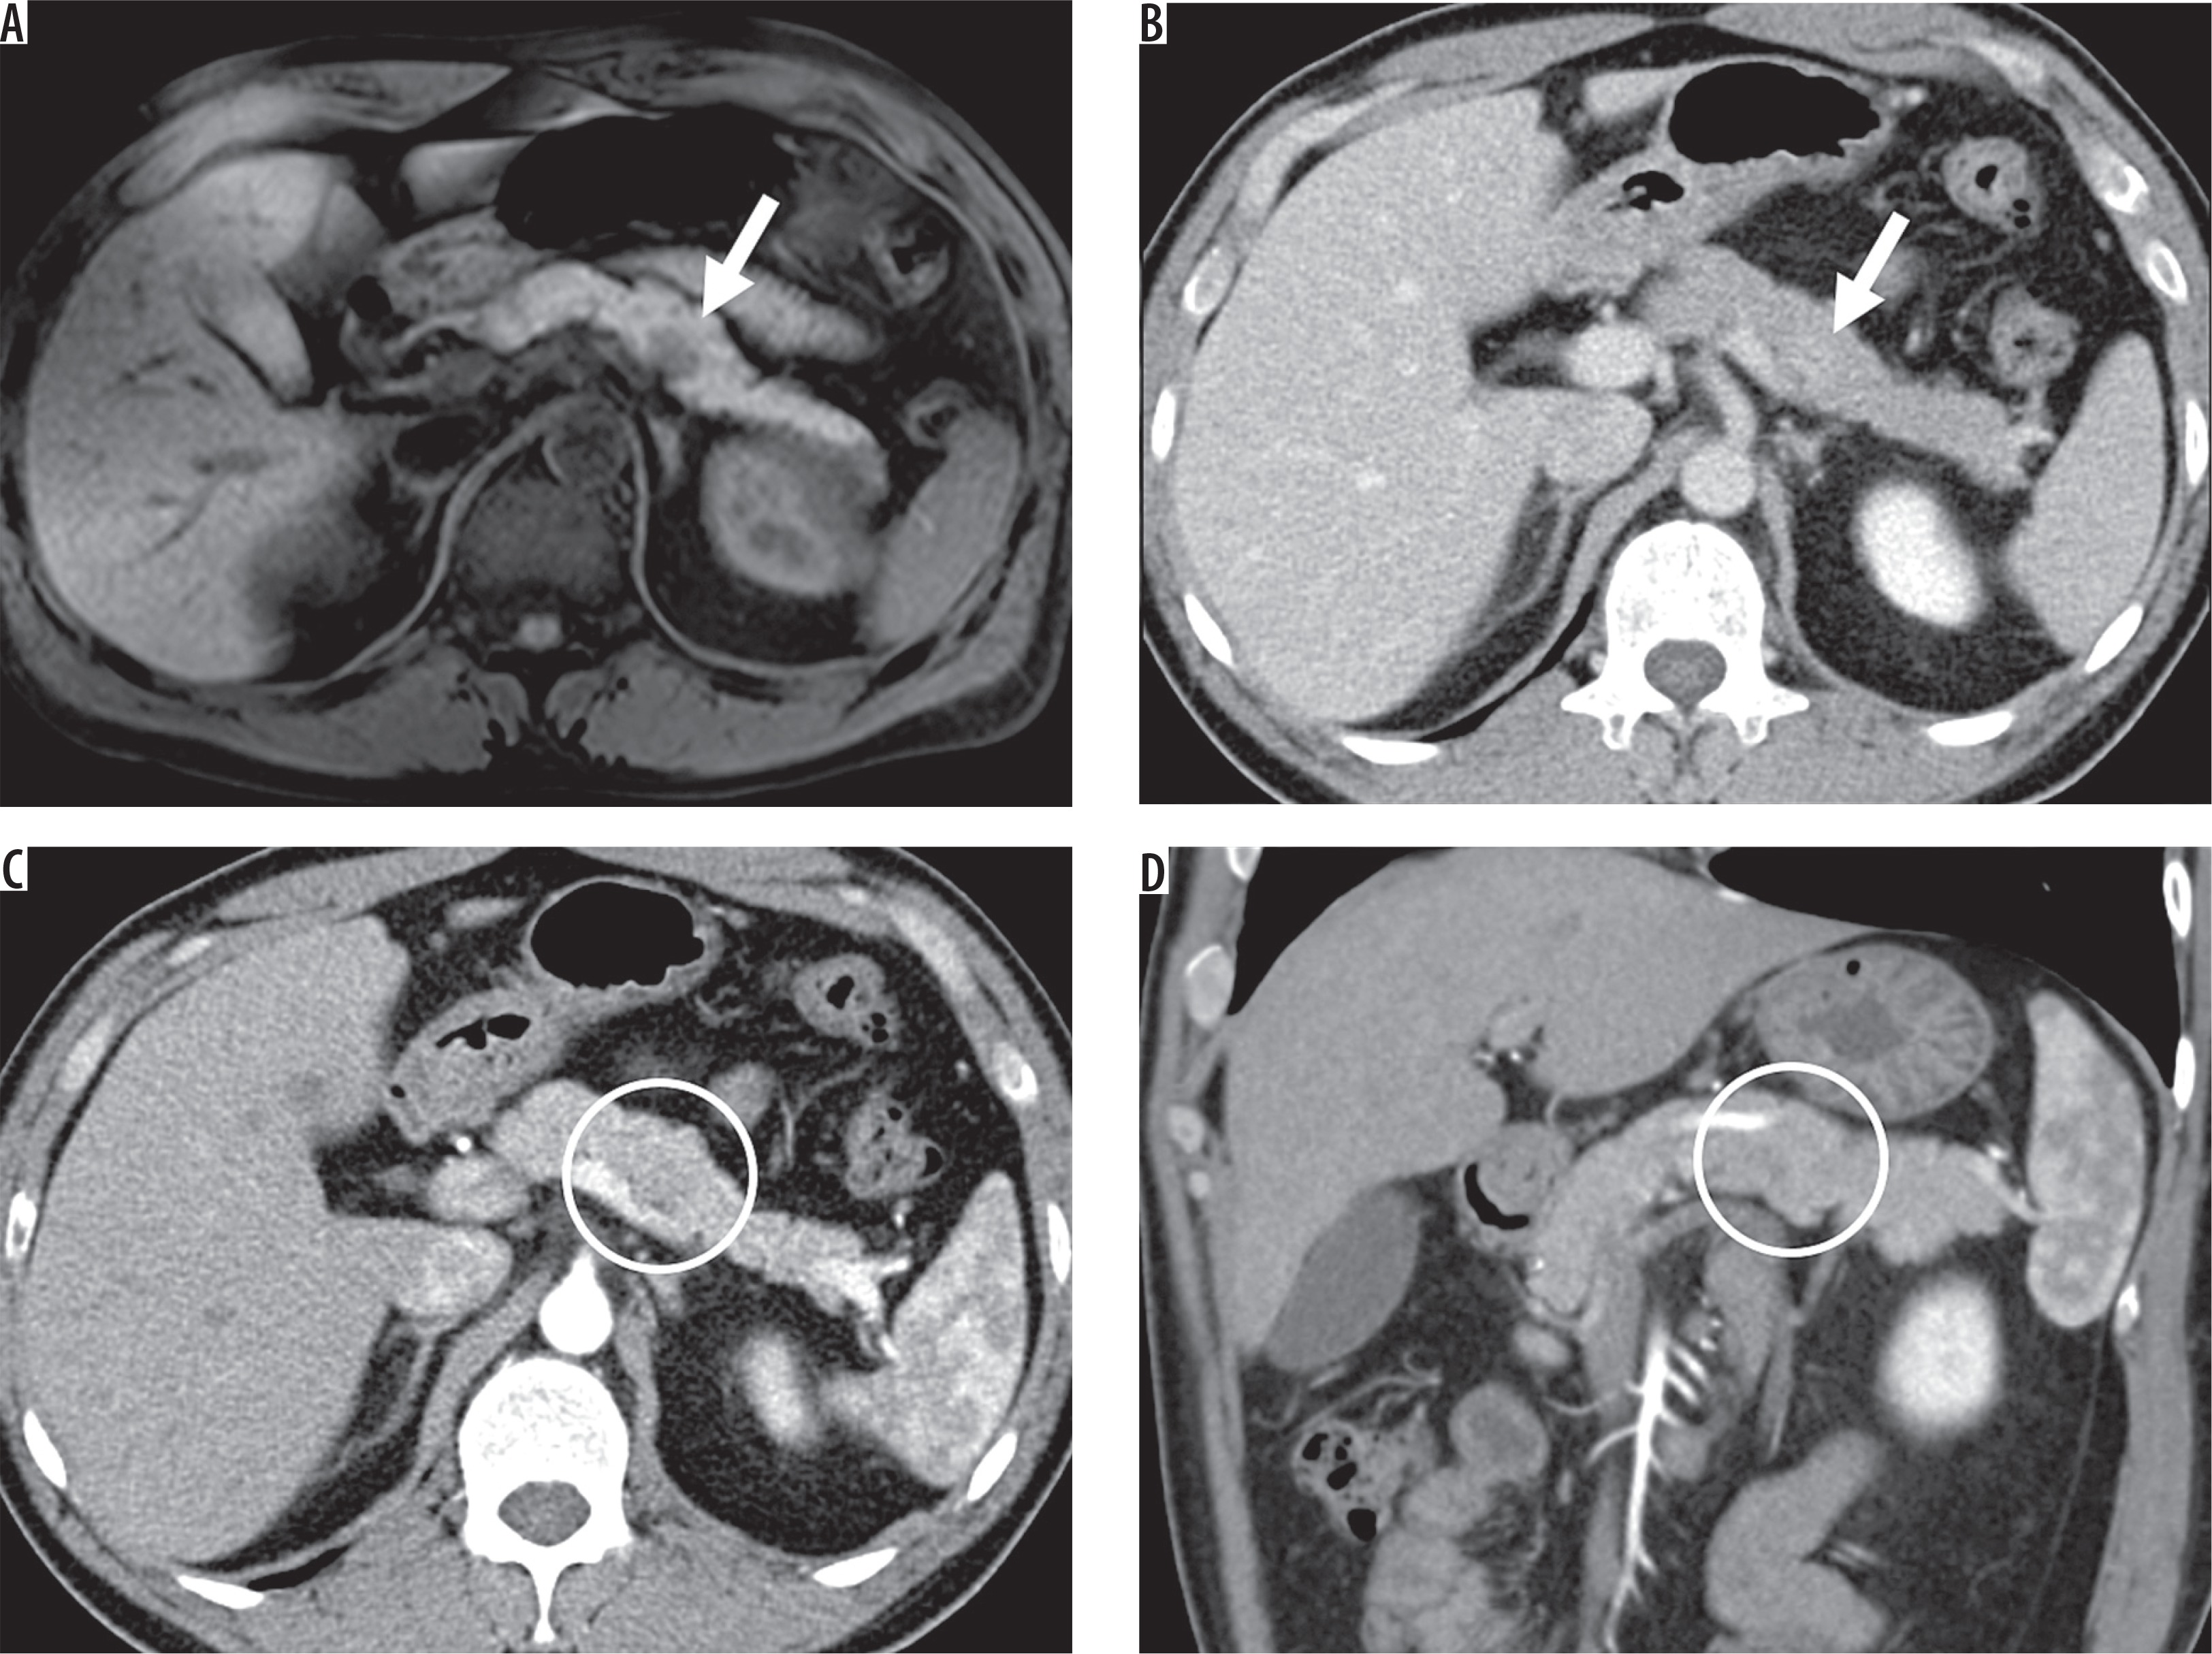
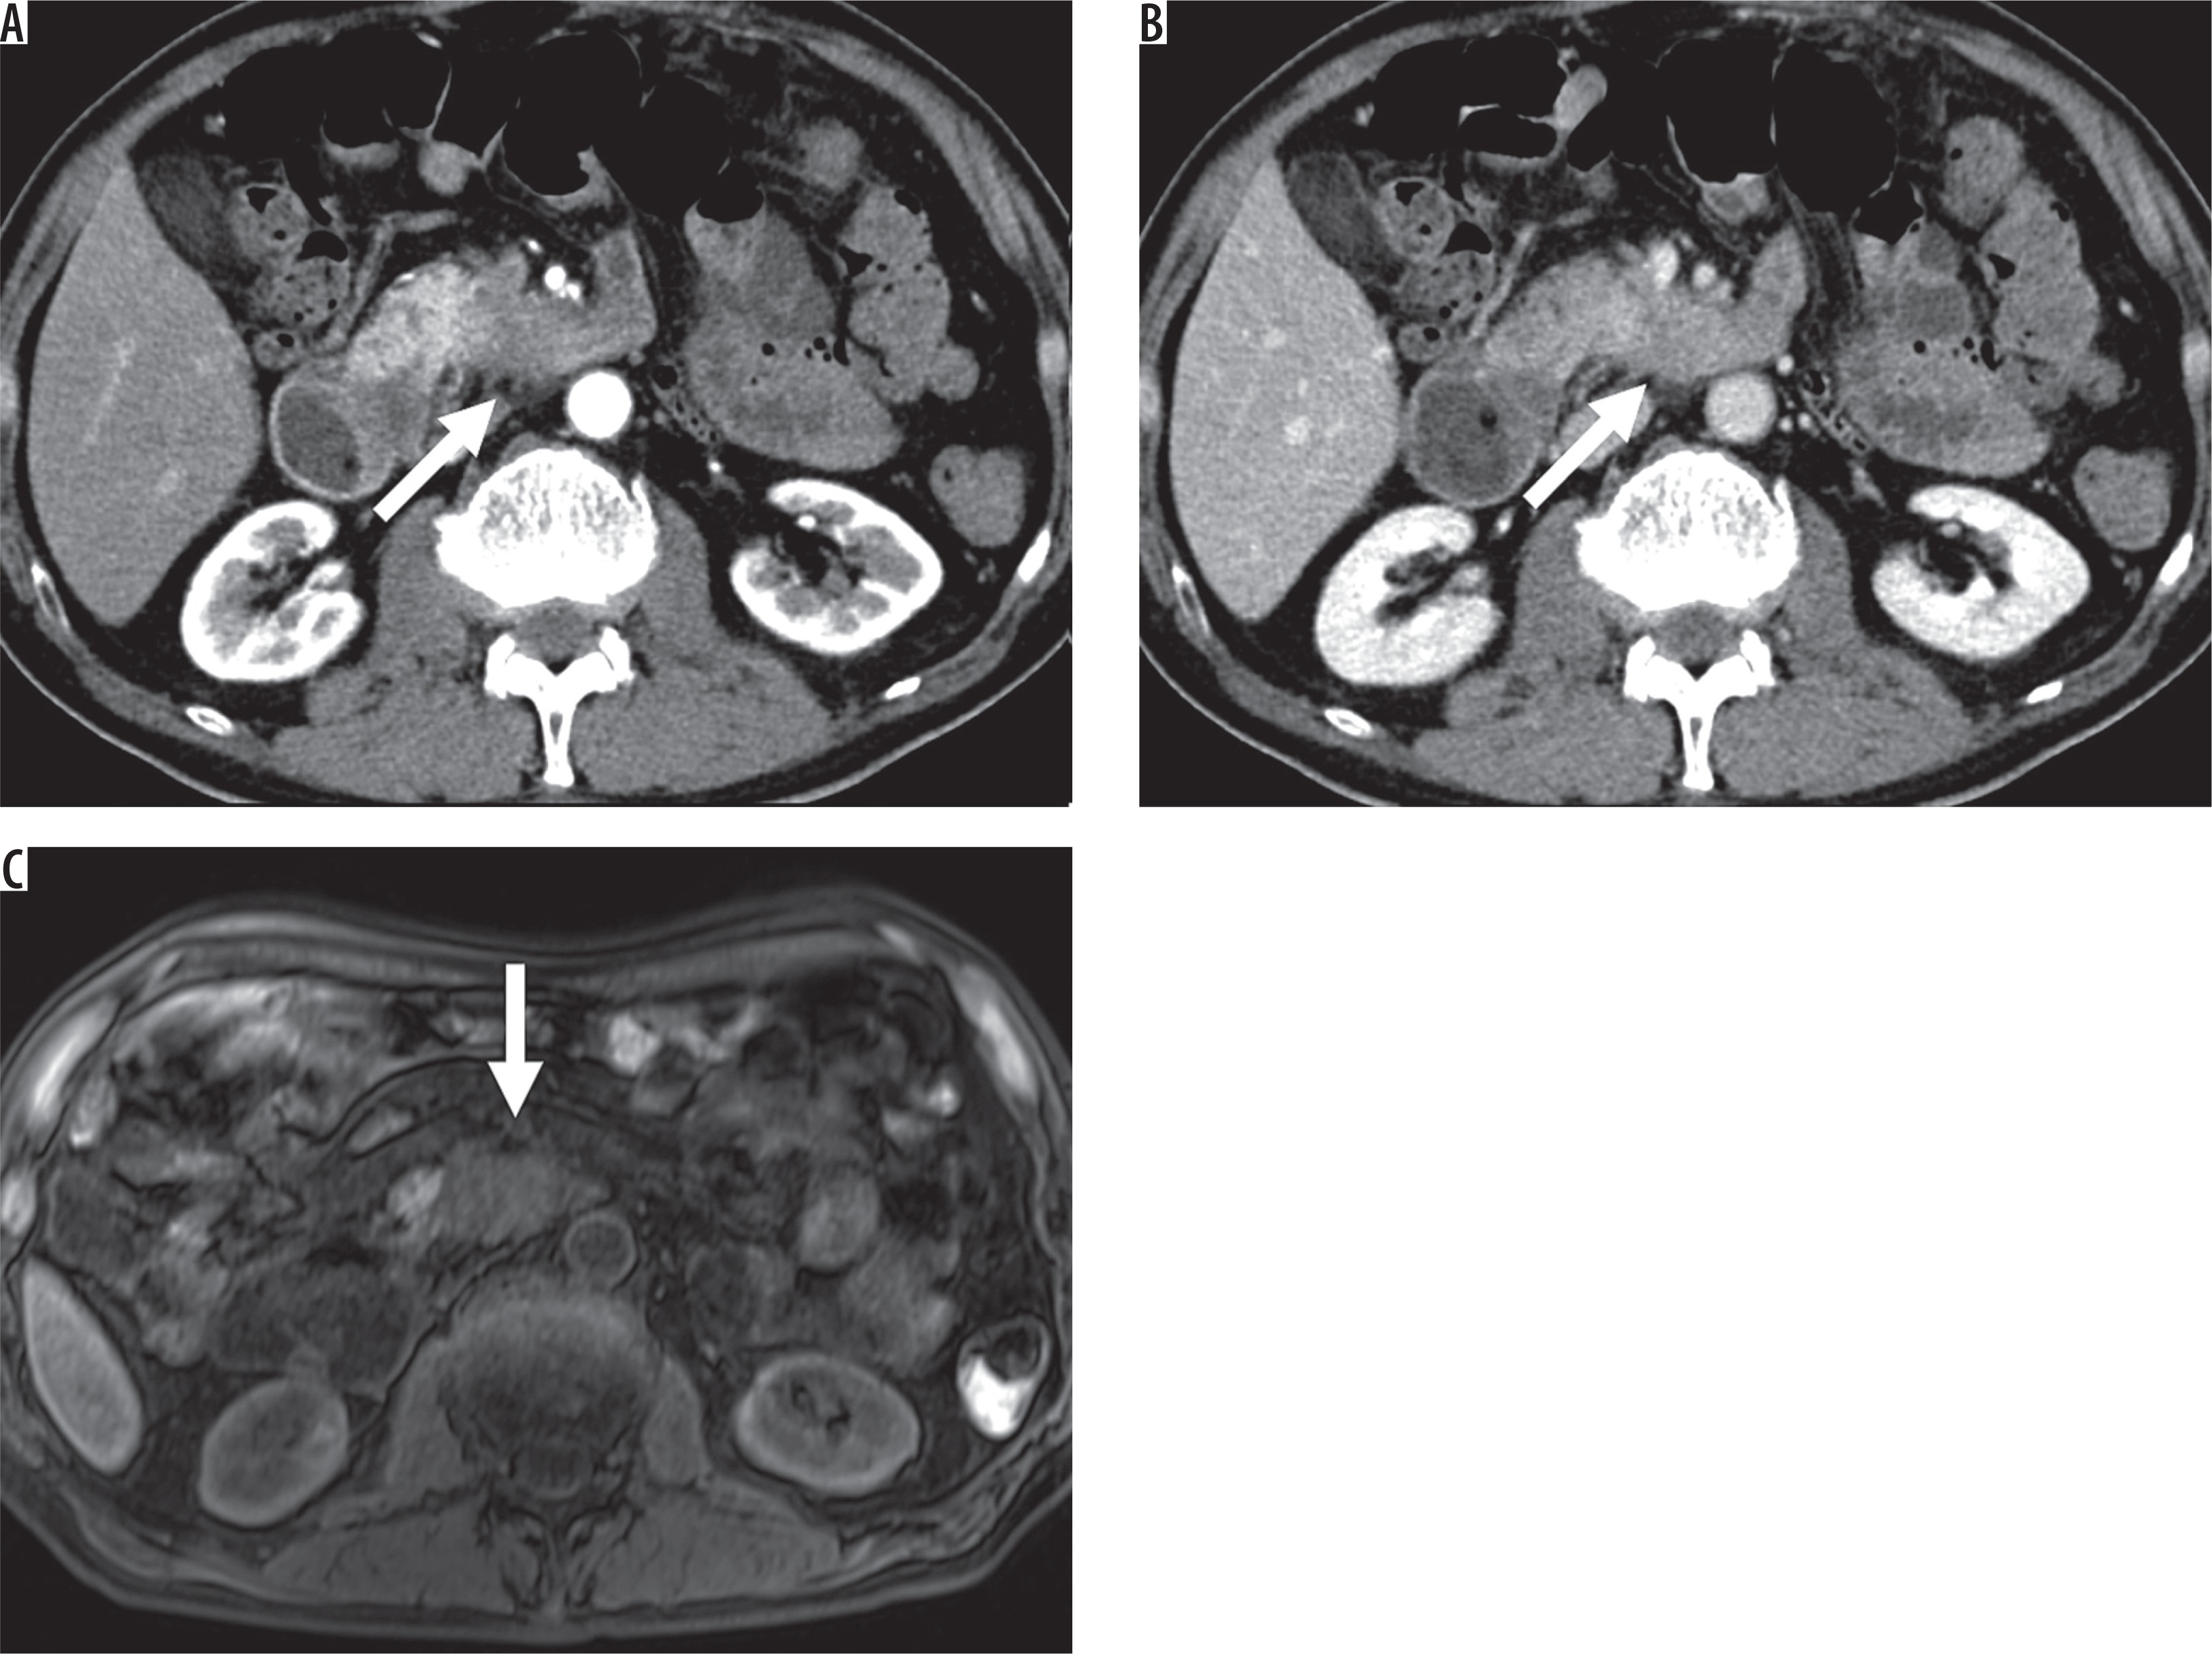
Figure 4
Imaging results from a 67-year-old man with pancreatic ductal adenocarcinoma (PDAC) in the uncinate process of the pancreas. A) The enhanced arterial phase and (B) portal venous phase computed tomography images show an ill-defined hypovascular lesion (arrow). C) The fat-saturated T1-weighted image shows a hypointense ill-defined lesion (arrow).The lesion invades beyond the superior mesenteric artery to the left side outside of the pancreas
The results of multivariate analyses are summarised in Table 4. There was a significant difference in tumour margin between PNET and PDAC (odds ratio: 168.86; 95% confidence interval [CI]: 10.62-2685.29; p < 0.001). ERT was also significantly different between groups (odds ratio: 85.80; 95% CI: 2.57-2860.95; p = 0.01). Although not significant, the quantitative assessment of CT attenuation ratio of tumour to pancreatic parenchyma on arterial phase showed relatively good discriminative performance on multivariate analyses (odds ratio: 5.31; 95% CI: 0.40-71.17; p = 0.21). The sensitivity, specificity, and accuracy of tumour margin was 86.7%, 96.6%, and 95.1%, respectively, while it was 66.7%, 98.9%, and 94.1%, respectively, for ERT.
Table 4
Results of multivariate analysis
| Variable | Odds ratio | 95% CI | p-value | |
|---|---|---|---|---|
| Tumour margin (well-defined vs. ill-defined) | 168.86 | 10.62 | 2685.29 | < 0.001 |
| CT attenuation ratio of tumour to pancreatic parenchyma on arterial phase (> 0.64 vs. < 0.64) | 5.31 | 0.40 | 71.17 | 0.21 |
| Enhancement ratio of tumour (ERT)a (< 0.25 vs. > 0.25) | 85.80 | 2.57 | 2860.95 | 0.01 |
The results of reproducibility tests of significant variables showed that the κ value for tumour margin was 0.64, and the ICC for ERT was 0.62. Both results were in substantial agreement.
Discussion
We evaluated the findings of dynamic CT and non-enhanced MRI that contributed to differentiation between non-hypervascular PNET and PDAC. We also conducted blinded observer tests to assess the reproducibility of such imaging findings.
Our results showed that there was a significant difference in well-defined margins between non-hypervascular PNET and PDAC (p < 0.001). These results were similar to previous studies that reported the same morphological tendency of hypervascular PNET [6,10,11]. The presence of well-defined margins was also a useful feature for differentiating between PDAC and PNET, even when exclusive to the non-hypervascular type, when dynamic contrast enhancement was inconclusive. Additionally, in our study, tumours with ill-defined margins were either PDAC or non-hypervascular G3 PNET. Although G3 PNET was identified in two cases, these results could also indicate that radical surgery should be considered if a patient presents with a pancreatic tumour with an ill-defined margin on preoperative imaging, because it increases the possibility of non-hypervascular G3 PNET or PDAC.
Our results show that ERT of non-hypervascular PNET is significantly lower than that of PDAC. ERT is considered to be affected by the degree of tumour fibrosis because abundant fibrosis reduces blood inflow to the tumour [15]. Histologically, PNET shows a lower degree of fibrosis, while PDAC shows abundant internal fibrosis [12,16]. As such, it is assumed that non-hypervascular PNET shows lower ERT than PDAC. ERT is not affected by attenuation changes of the surrounding pancreatic parenchyma caused by tumour-induced pancreatitis, and it could be calculated using only the attenuation of the tumour. Therefore, the use of ERT is valuable in differentiating between PNET and PDAC. Jeon et al. [13] reported that hyper- or iso-enhancement in the portal venous phase are useful for differentiating between non-hypervascular PNET and PDAC. They also reported a line chart analysis of temporal contrast-to-noise ratio (CNR), which is the enhancement ratio of the tumour adjusted by the paraspinal muscle for standardisation [13]. The line chart analysis of temporal CNR of PDAC showed a higher rate of contrast enhancement over time than that of non-hypervascular PNET. This was similar to our results that showed a lower ERT on non-hypervascular PNET and a higher ERT on PDAC. Our results on ERT also supported their results in the line chart analysis of temporal CNR as a dynamic curve. However, our results cannot be directly compared to their results because our CT acquisition times for arterial and portal venous phases were different from those used in their protocol, and we used ERT as a variable, rather than a dynamic curve.
The CT attenuation ratio of tumour to pancreatic parenchyma on arterial phase showed a relatively good discriminative performance on multivariate analyses, although not significant (p = 0.21). This could indicate that non-hypervascular PNET shows a substantially higher enhancement degree compared with PDAC in arterial phase on quantitative analysis, even though both non-hypervascular PNET and PDAC showed a similar internal enhancement in arterial phase on visual assessment. This may reflect that the inherent histopathological property of the rich capillary network of PNET is associated with vascularity in the arterial phase [6].
A previous study by d’Assignies et al. showed that the blood flow of PNET is related to its grade, and that blood flow was significantly higher in the group of benign tumours [17]. In our study, 86.7% (13/15) of tumours were low-grade tumours classified as G1 or G2. Although excluded from this study, all hypervascular PNET were low-grade tumours; of 12 tumours, 11, 1, and 0 were G1, G2, and G3, respectively. Our results agreed with those of d’Assignies et al., as the proportion of G2 and G3 tumours increased in non-hypervascular PNET compared to the hypervascular PNET. However, 86.7% of tumours among non-hypervascular PNET were low-grade tumours. Moreover, our results were similar to findings of a study by Jeon et al., in which low-grade tumours accounted for 89% of non-hypervascular PNET [13]. Although non-hypervascular PNET is more likely than hypervascular PNET to include high grade tumours, the majority of non-hypervascular PNET are low-grade tumours that require less extensive surgery; thus, it is clinically important to differentiate non-hypervascular PNET from PDAC.
Little is known about the added value of non-enhanced MRI for differentiation between PNET and PDAC. In our study, the signal intensity of MRI including DWI and ADC showed no significant difference between PNET and PDAC. Such a result was similar to previous reports [11,18]. Concerning PNET, some studies showed that DWI and ADC have predictive value for tumour grading. This is particularly useful to differentiate between G1-2 and G3 tumours [19-21].
The limitations of our study are its single-site retrospective design and the higher number of PDAC patients than non-hypervascular PNET. Non-hypervascular PNET is the less frequent type of PNET, which is generally a rare tumour, and only 15 cases of non-hypervascular PNET were seen in our study. Future studies with larger sample sizes are required to provide additional accuracy to our study. Furthermore, our study included all grades of PNET. Some previous studies reported that DWI is useful for the differentiation between G1-2 and G3 tumours [19-21]. Thus, if we subdivide the cases into different grades of PNET (G1-3) and PDAC prior to evaluation, there may be some imaging features that can differentiate these tumours. Additionally, our arterial phase protocol was conducted earlier than recommended in the European Society for Medical Oncology (ESMO) Clinical Practice Guidelines [4,14]. In our CT imaging protocol, the arterial phase was taken 10 seconds after reaching 80 Hounsfield units with ROI placed on the aorta. This was approximately 30 seconds after administration of the contrast agent, which is earlier than the 40 seconds recommended in the ESMO Clinical Practice Guidelines. The pancreatic arterial phase should also be acquired to better compare CT imaging findings to previous reports.
In conclusion, a well-defined margin and a lower ERT of non-hypervascular PNET contributed to differentiation between non-hypervascular PNET and PDAC. Consequently, by interpreting the images correctly, unnecessary extensive surgery can be avoided.