


Introduction
Migraine is a disorder in which recurrent headache occurs, which is pulsating in quality, moderate to severe in intensity, and unilateral in its location. It is usually aggravated by routine physical activity. It can be associated with nausea and/or phonophobia [1,2]. It has high prevalence, a high socioeconomic burden, and severely affects life quality. It was ranked as the sixth cause of disability worldwide and recorded among the top 10 causes of disability interfering with daily living activities [3-8]. It is generally believed that migraine is an abnormality in the brain function caused by a neurovascular disorder in which cortical spreading depression, neurogenic inflammation, and cranial vascular contractile dysfunction are shared in its pathophysiology. The characteristic headache results from dilatation of the extra-parenchymal blood vessels following the activation of the trigeminovascular system with subsequent release of multiple peptides leading to inflammation and vascular dilatation, resulting in the characteristic headache of either migraine with aura or migraine without aura [9-11].
Imaging modalities
The most powerful imaging modalities used in the diagnosis of central nervous system abnormalities is magnetic resonance imaging (MRI). In patients with migraine, routine MRI revealed normal results in most cases. In the remaining cases abnormal white matter hyperintensities could be seen on T2 and FLAIR (fluid attenuated inversion recovery) images. They are typically multiple and small, and punctate in the deep periventricular white matter and centrum semiovale. Recent studies done using 3 Tesla machines revealed increased T2 signal intensity of the cerebral cortex overlying the white matter abnormalities as well as in the brainstem [12-14]. Functional MRI provided more information by demonstration of cerebral physiological and morphological changes during attacks of migraine. Imaging using positron emission tomography (PET) showed sits of activity during migraine attacks, but it has limited anatomical resolution interfering with accurate detection of the exact structure involved during the attack [15].
Diffusion tensor imaging basics
Recent advancements in the technology of neuroimaging have provided more powerful methods helping us to understand the pathological mechanism of migraine. It can also help in identification of abnormal brain regions associated with migraine [2-8]. Diffusion-tensor imaging (DTI) is an excellent MRI technique for investigating brain parenchymal microstructural changes. This can be achieved through its power to assess the diffusion of water along and across white matter tracts [16]. The applications of DTI have been rapidly increasing in recent years because it is highly sensitive to minor changes at the microstructural and cellular levels. DTI images obtained by incorporating directionality into a diffusion-weighted measurement, allowing the extraction of the diffusion anisotropy characteristics of certain areas of the brain, thus giving details about their microstructural integrity. Fractional anisotropy (FA) and mean diffusivity (MD) are the 2 main parameters used in the quantification of directionality and amplitude of water diffusion [14].
Material and methods
Patients
Institutional review board permission was obtained for this prospective study carried out from June 2018 to February 2019. Informed consent was obtained from each patient and from controls before the MRI examination was done. The study included 33 patients (5 males and 28 females, mean age 35.03 years), which was defined as the patient group and 15 (age- and sex-matched) healthy volunteers (2 males and 13 females, mean age 35 years), which was defined as the control group. All patients were referred from the Neurology Clinic with a diagnosis of migraine without aura. The patients and controls underwent routine MRI study with DTI of the brain. The inclusion criteria were patients having migraine without aura and not having other clinically apparent disease by full neurological and general clinical examination. The exclusion criteria were those patients with claustrophobia and those having a prosthesis incompatible with MRI examination, such as a cardiac pacemaker and prosthetic cardiac valve. Patients and controls were pain free at the time of MRI examination, and patients were free of migraine for at least 2 days before the MRI exam, so the imaging was performed between migraine attacks, which is known as the interictal phase. Female patients were scanned in the mid-cycle. Initially the study included 35 patients and 16 healthy volunteers. Three were excluded because of abnormal MRI findings (2 patients had intracranial masses) and excessive movement during the examination (one volunteer). Finally, the study contained 33 patients and 15 volunteers.
Clinical examination
Full clinical and neurological examination was done for all patients (n = 33) and controls (n = 15) by a neurology consultant (BT) with 18 years’ experience. All patients were screened for history of head trauma, psychiatric disorders, or acute pain disorders other than migraine, which, when present, excluded them from the study. The diagnosis of migraine was made using the International Classification of Headache Disorders (III) diagnostic criteria [17].
Magnetic resonance imaging
Brain MRI examination with DTI was done for all patients and controls. The MRI was carried out using a 1.5 Tesla scanner (Ingenia, Philips) using a Head Neck 20-channel coil. First, routine sequences were done as follows: T1WI (TR/TE = 620/20 ms), T2WI (TR/TE = 5430/95 ms), and FLAIR (TR/TE/TI = 10500/120/2800 ms) with matrix = 80 × 80, field of view (FOV) = 240 × 220 mm, and slice thickness = 5 mm. Then DTI was done using a single-shot echo-planar imaging sequence (TR/TE = 3118/93 ms) with sensitivity Encoding (SENSE). Then diffusion gradients were applied along 32 axes, using a b-value of 0 and 1000 s/mm2. FOV = 240 × 240 mm2 and data matrix = 92 × 88 were used, leading to voxel dimensions 2.43 × 2.54 × 2.5 mm. Forty-eight slices were obtained, with a thickness of 2.5 mm and no gap, and the total scan time was 7-8 minutes.
Image analysis
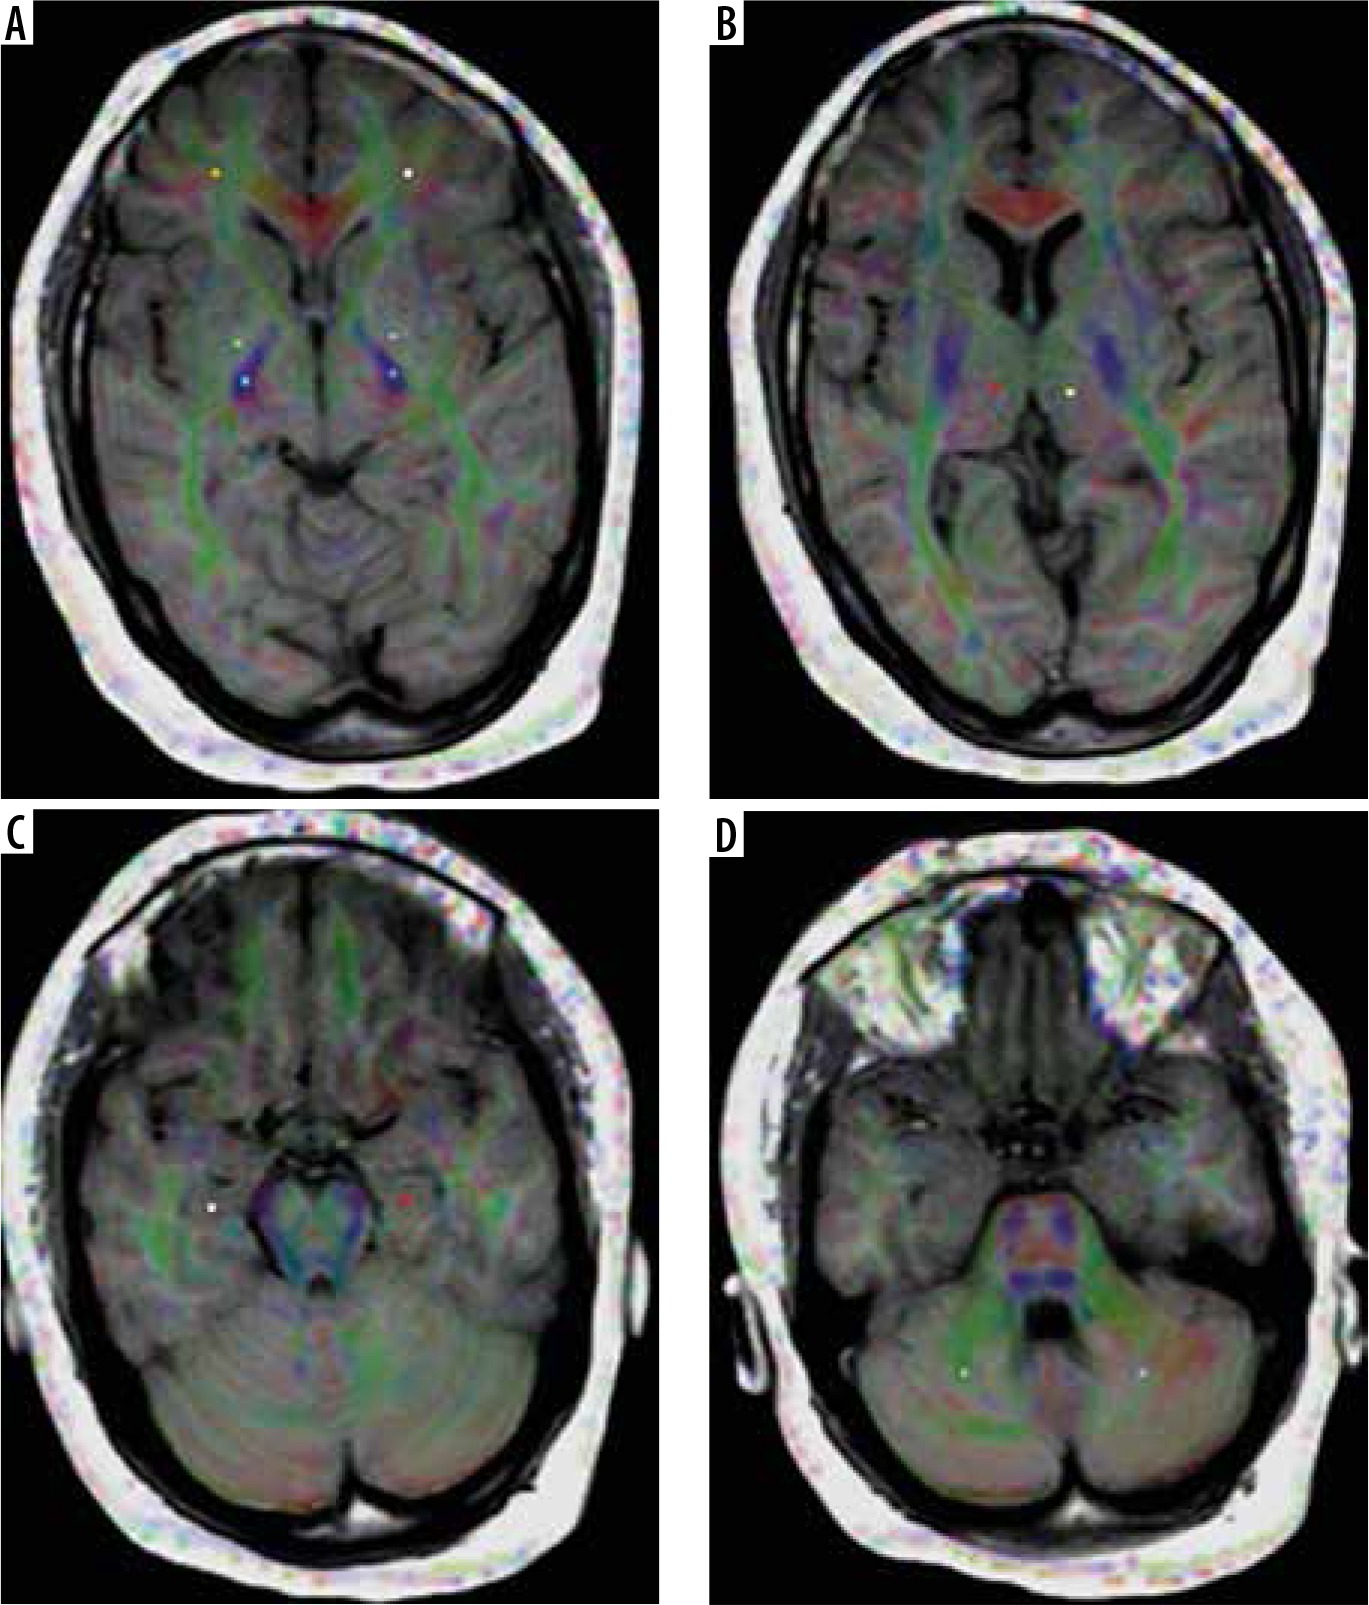
The image analysis was done by a neuroradiologist with 18 years of experience (TS), who was blinded to the clinical data. First, the routine MR images were reviewed by the neuroradiologist, and they were excluded from the study if any abnormality was detected. The images were transferred to a workstation (extended MR Workspace 2.6.3.5, Philips medical systems Nederland B.V) supplied by the vendor. Measurements of MD and FA were obtained in 3 grey matter regions on each side (thalamus, globus pallidus, and hippocampus head) and 3 white matter regions on each side (frontal lobes, posterior limb of the internal capsule, and cerebellum). The total comprised 6 grey matter and 6 white matter regions. The readings were calculated and registered separately for each side (Figure 1).
Statistical analysis
Statistical analyses of this study were done using Statistical Package for Social Sciences (SPSS, Chicago, IL) version 20. Quantitative data were presented as mean and standard deviation (SD). Normally distributed data were compared between the 2 groups using the independent samples t-test. Data that violated the normality assumptions were compared using the Mann-Whitney test. Probability (p) values < 0.05 were considered statistically significant. The receiver operating characteristic (ROC) curve was done to evaluate the diagnostic capability of the FA and MD in differentiating patients from controls. The area under the curve (AUC), accuracy, sensitivity, and specificity together with positive and negative predictive values were calculated.
Results
Demographic
The demographic criteria of the patients and controls are presented in Table 1. For the patient group n = 33, males n = 5, and females n = 28. The mean age was 35.03 ± 7.76 years. Disease duration ranged from 1 to 24 years, mean approx. 10 years, the frequency of attacks was 2 to 6 times per month, mean approx. 4.5 times, side affected was right n = 11, left n = 19, and bilateral n = 3. Last attack before MRI examination ranged from 0.6 to 4 weeks. The control group comprised n = 15, males n = 2, and females n = 13. The mean age was 35.00 ± 5.57 years. All patients were right-handed.
Routine magnetic resonance imaging
On routine brain MRI examinations, no abnormality could be detected in any of the patient group and controls.
Grey matter
There were significantly increased MD values in the thalamus, globus pallidus, and hippocampus head on the right side of patients versus controls (p = 0.001, 0.001, and 0.001, respectively). The measured MD values for the patients were 0.87 ± 0.09, 0.8 ± 0.06, and 0.98 ± 0.14 × 10⁻³ mm2/s, respectively, while those of the controls were 0.52 ± 0.14, 0.7 ± 0.17, and 0.83 ± 0.06 × 10⁻³ mm2/s, respectively. Regarding the MD values of the same regions on the left side, the values were not statistically significant (p = 0.18, 0.92, and 0.29, respectively) in patients compared to controls (Table 2). In ROC curve analysis, the AUC of the MD values of the thalamus, globus pallidus, and hippocampus head on the right side used to differentiate patients from controls were 0.978, 0.952, and 0.814, respectively, with the cut-off point to differentiate both groups at 0.73, 0.72, and 0.89 × 10⁻³mm2/s, respectively. For the thalamus the sensitivity, specificity, and positive and negative predictive values were 97%, 86.7%, 94.1%, and 92.9%, respectively, with an accuracy of 93.8%. For the globus pallidus the sensitivity, specificity, and positive and negative predictive values were 93.9%, 93.3%, 96.9%, and 87.5%, respectively, with an accuracy of 93.8%. For the hippocampus head the sensitivity, specificity, and positive and negative predictive values were 72.7%, 86.7%, 92.3%, and 59.1%, respectively, with an accuracy of 77.1% (Table 3).
Table 2
Mean and standard deviation (minimum, maximum) of mean diffusivity (MD) and fractional anisotropy (FA) of the selected grey matter regions in patients and control groups
Table 3
Results of receiver operating characteristic (ROC) curve of mean diffusivity (MD) of the selected grey matter regions with calculation of cut-off values, area under the curve (AUC), accuracy, sensitivity, and specificity in differentiating patients and controls
There were significantly decreased FA values in the thalamus, globus pallidus, and hippocampus head on the right side of patients versus controls (p = 0.001, 0.001, and 0.001, respectively). The measured FA values for the patients were 0.24 ± 0.03, 0.14 ± 0.03, and 0.14 ± 0.03, respectively, while those of the controls were 0.33 ± 0.02, 0.28 ± 0.06, and 0.24 ± 0.03, respectively. Regarding the FA values of the same regions on the left side, a significant decrease in the FA value was detected only in the hippocampus head (p = 0.001). The measured FA value for the patients was 0.13 ± 0.03 while that of the controls was 0.19 ± 0.04. The FA values of the thalamus and globus pallidus on the left side were not statistically significant (p = 0.07 and 0.51, respectively) in patients compared to controls (Table 2).
In ROC curve analysis the AUC of the FA values of the thalamus, globus pallidus, and hippocampus head on the right side used to differentiate patients from controls were 0.983, 0.984, and 0.986, respectively, and the cut-off points to differentiate both groups were 0.3, 0.2, and 0.22, respectively. For the thalamus the sensitivity, specificity, and positive and negative predictive values were 97%, 93.3%, 97%, and 93.3%, respectively, with an accuracy of 95.8%. For the globus pallidus the sensitivity, specificity, and positive and negative predictive values were 93.9%, 73.3%, 88.6%, and 84.6%, respectively, with an accuracy of 87.5%. For the hippocampus head the sensitivity, specificity, and positive and negative predictive values were 97%, 73.3%, 88%, and 91.7%, respectively, with an accuracy of 89.6%. On the left side of the hippocampus head the AUC of the FA value used to differentiate patients from controls was 0.895 and the cut-off point to differentiate both groups was 0.17. Sensitivity, specificity, and positive and negative predictive values were 84.8%, 80%, 90.3, and 70.6%, respectively, with an accuracy of 83.3% (Table 4).
Table 4
Results of receiver operating characteristic (ROC) curve of fractional anisotropy (FA) of the selected grey matter regions with calculation of cut-off values, area under the curve (AUC), accuracy, sensitivity, and specificity in differentiating patients and controls
White matter
There was statistically significant lower FA on both sides of the white matter of the frontal lobes, posterior limbs of the internal capsules, and cerebellar hemispheres in patients compared to controls. On the right, p = 0.001, 0.001, and 0.001, respectively, while on the left p = 0.001, 0.005, and 0.001, respectively. The measured FA values of the patients on the right were 0.35 ± 0.13, 0.66 ± 0.06, and 0.29 ± 0.08, respectively, and on the left 0.34 ± 0.09, 0.57 ± 0.15, and 0.32 ± 0.15, respectively, and for the controls, the measured FA values on the right were 0.62 ± 0.1, 0.73 ± 0.04, and 0.47 ± 0.09, respectively, and on the left 0.46 ± 0.07, 0.71 ± 0.07, and 0.52 ± 0.12, respectively (Table 5).
Table 5
Mean and standard deviation (minimum, maximum) of fractional anisotropy (FA) and mean diffusivity (MD) of the selected white matter regions
In ROC curve analysis, the AUC of the FA values on the right side were asfollows: frontal lobe = 0.931, posterior limb of internal capsule = 0.82, and cerebellum = 0.93. On the left side: frontal lobe = 0.84, posterior limb of internal capsule = 0.715 and cerebellum = 0.843. The cut-off points to differentiate both groups on the right were 0.56, 0.71, and 0.44, respectively, while on the left they were 0.42, 0.71, and 0.47, respectively. On the right side, for frontal lobe white matter, the sensitivity, specificity, and positive and negative predictive values were 93.9%, 80%, 91.2%, and 85.7%, respectively, with an accuracy of 89.5%. For the posterior limb of the internal capsule, the sensitivity, specificity, and positive and negative predictive values were 75.8%, 86.7%, 92.6%, and 61.9%, respectively, with an accuracy of 79.2%. For the cerebellum, the sensitivity, specificity, and positive and negative predictive values were 93.9%, 86.7%, 93.9%, and 86.7%, respectively, with an accuracy of 91.7%. On the left side, for frontal lobe white matter, the sensitivity, specificity, and positive and negative predictive values were 78.8%, 66.7%, 83.9%, and 58.8%, respectively, with an accuracy of 75%. For the posterior limb of the internal capsule, the sensitivity, specificity, and positive and negative predictive values were 69.7%, 60%, 79.3%, and 47.4%, respectively, with an accuracy of 66.7%. For the cerebellum, the sensitivity, specificity, and positive and negative predictive values were 84.8%, 66.7%, 84.8%, and 66.7%, respectively, with an accuracy of 79.2% (Table 6).
Table 6
Results of receiver operating characteristic (ROC) curve of fractional anisotropy (FA) of the selected white matter regions with calculation of cut-off values, area under the curve (AUC), accuracy, sensitivity, and specificity in differentiating patients and controls
There were statistically significant increased MD values in the white matter of both frontal lobes, posterior limb of the right internal capsule, and both cerebellar hemispheres in patients compared to controls. On the right-side frontal lobe, posterior limb of the internal capsule, and cerebellar hemisphere p = 0.008, 0.001, and 0.001, respectively. The measured MD values for the patients were 0.81 ± 0.08, 0.75 ± 0.04, and 0.81 ± 0.08 x 10⁻³ mm2/s, respectively while those of the controls were 0.75 ± 0.03, 0.68 ± 0.05, and 0.68 ± 0.04 x 10⁻³ mm2/s, respectively. On the left side frontal lobe and cerebellar hemisphere p = 0.001 and 0.001, respectively. The measured MD values for the patients were 0.83 ± 0.06 and 0.82 ± 0.09 ´ 10-3 mm2/s, respectively, while those of the controls were 0.75 ± 0.02 and 0.68 ± 0.05 x 10⁻³ mm2/s, respectively. Regarding the MD values of the posterior limb of the left internal capsule, the values were not statistically significant (p = 0.68) in patients compared to controls (Table 5).
in ROC curve analysis, the AUC of the MD values of the frontal lobe, posterior limb of the internal capsule, and cerebellar hemisphere on the right side used to differentiate patients from controls were 0.8, 0.904, and 0.927, respectively, and the cut-off points to differentiate both groups were 0.79, 0.74, and 0.73 x 10⁻³mm2/s, while those of the left frontal lobe and left cerebellar hemisphere were 0.839 and 0.893, respectively, with cut-off points of 0.76 and 0.75 x 10⁻³mm2/s, respectively. On the right side, for the frontal lobe, the sensitivity, specificity, andpositive and negative predictive values were 60.6%, 93.3%, 95.2%, and 51.9%, respectively, with an accuracy of 70.8%. For the posterior limb internal capsule, the sensitivity, specificity, and positive and negative predictive values were 84.8%, 93.3%, 96.6%, and 73.7%, respectively, with an accuracy of 87.5%. For the cerebellum the sensitivity, specificity, and positive and negative predictive values were 87.9%, 86.7%, 93.5%, and 76.5%, respectively, with an accuracy of 87.5%. On the left side, for the frontal lobe, the sensitivity, specificity, and positive and negative predictive values were 78.8%, 66.7%, 77.1%, and 53.8%, respectively, with an accuracy of 70.7%. For the cerebellum the sensitivity, specificity, and positive and negative predictive values were 84.8%, 80%, 90.3%, and 70.6%, respectively, with an accuracy of 83.3% (Table 7).
Table 7
Results of receiver operating characteristic (ROC) curve of mean diffusivity (MD) of the selected white matter regions with calculation of cut-off values, area under the curve (AUC), accuracy, sensitivity, and specificity in differentiating patients and controls
Discussion
Migraine is a neurological disorder characterized by headache that occurs either unilaterally or bilaterally with duration ranging from hours to days [18]. Although it is common, its pathogenesis is not yet fully understood [19]. However, many investigations of neurotransmitters, neuromodulators, and functional neuroimaging studies have helped us to know the morphological and physiological changes occurring during migraine attacks [20]. PET studies have shown important brain changes in migraine, but with limited anatomical details [21]. There are any theories to explain the pathogenesis of migraine, like cortical spreading depression and hyperexcitability of cerebral cortex resulting in different brain microstructure changes [22].
Many of the studies done to detect grey and white matter microstructural changes in migraineurs enrolled mixed groups of patients – those having migraine with aura together with those having migraine without aura. This resulted in inconsistent and contradictory results due to sample heterogeneity [2], so in our study we enrolled a homogenous group containing 33 patients all having migraine without aura.
In our study, the highest migraine headache prevalence was detected between the ages of 20 and 40 years, with a high female predominance (female-to-male ratio 5.6 : 1). Similar results were reported in a study by Kandil et al. in 2016 [11] in the Assiut district of Egypt, which indicated that the highest prevalence of migraine was at the ages 20-40 years. Also, we found a wide range of disease duration in the patient group (1-24 years). The patient group consisted of only 33 subjects, which could be related to the small number of cases that met the inclusion criteria during the limited study duration. This study was just the first step in this issue, and we are preparing to apply the study on a large number of cases with multi-centre cooperation in the future. This large sample volume will give a greater chance for the appearance of other disease factors affecting the brain structures to become prominent.
In our study we also fund that the female-to-male ratio was 2.4 : 1. The difference in the male-to-female ratio may be due to either the small sample size of our study compared to their study or due to the inhomogeneity of the sample enrolled in the study of Kandil et al., because they enrolled all types of migraine while in our study only migraine patients without aura were studied.
Functional and structural differences of the cerebral white and grey matter were detected between migraineurs and healthy controls by several MRI studies [3,4]. Many studies were performed to identify the different affected grey and white matter regions in migraineurs; these regions included the frontal and parietal lobes, basal ganglia, brainstem, limbic system, and cerebellum [15,23]. In the current study we used 3 white matter regions (frontal lobe, posterior limb internal capsule, and cerebellum) and 3 grey matter regions (thalamus, globus pallidus, and hippocampus head) on each side, so the total number involved in our study was 6 grey matter and 6 white matter regions.
DTI has become an established tool in the investigation of central nervous system tissue microstructure and anatomy. DTI gives quantitative data on the motion of the molecular water. MD and FA are the most clinically used parameters. MD determines the magnitude of diffusion, while FA reveals the degree of diffusion and anisotropy [15,24]. Recent studies revealed the presence of microstructural changes in migraineurs, which are not seen in normal appearing brain tissues on conventional MRI [2,25,26]. In light of the above-mentioned neuroimaging studies, we thought that we could provide additional evidence of microstructural changes in patients having migraine without aura by obtaining the MD and FA measurements in the mentioned grey and white matter regions and comparing the results with those of healthy subjects, as well as to correlate the acquired data with the disease duration, attack frequency, and disease laterality.
In our study all the included patients (n = 33) had normal appearing brain tissue on conventional MRI in spite of the DTI changes, which can be due to the repeated mild ischaemic insults during migraine attacks, which may cause a loss in the structural barriers of molecular motion of water that can be detected by DTI and not detected by conventional MRI pulse sequences like T2WI and FLAIR [25]. This could be because the damage was below the minimum level that can be detected by conventional MRI; also, brain resistance mechanisms can be strong enough to prevent the appearance of these changes on routine MRI [27].
On DTI done for all patient and control groups involved in our study, we found a statistically significant difference in the MD values of the selected grey matter regions on the right side and the selected white matter regions on both sides except the posterior limb of the left internal capsule, and in FA values of both frontal lobes together with the selected grey matter regions on the right side and left hippocampal head of the patient group compared to controls. These changes could be detected instead of the normal conventional MRI examinations done for all patients, and this is attributed to the fact that DTI can detect tissue microstructural changes occurring in different pathologies that could not be detected by conventional MRI; this is because DTI parameters (MD and FA) become abnormal before the appearance of the morphological changes on conventional MRI. DTI also improved the sensitivity and objectivity in early detection of minor developmental and long-term changes along specific anatomical pathways that could be missed by the relatively subjective conventional MRI [28-30].
The mentioned changes in DTI parameters resulting from cell death could be explained by the migraine theories. First, the cortical spreading depression induces neurotransmitters leading to neuroinflammation and stimulation of glial cells [31]; moreover, it alters the brain circulation making it more liable to ischaemia and hence cell death resulting in different grey and white matter microstructural changes [32]. The other theory of hyperexcitability of the cerebral cortex may also play a role in the microstructural alterations seen in migraine [22,33]. Welch et al. reported that there is non-haeme iron deposition in the ganglionic region and brain stem in cases of recurrent migraine by repeated activation of the pain system, which represent cellular injury [20].
MD is sensitive to changes in the grey matter; this could be attributed to the mainly isotropic nature of diffusion in the grey matter. On the other hand, FA is sensitive to white matter changes; this is related to the anisotropic nature of diffusion in the white matter together with the high sensitivity of FA to the low values of diffusion anisotropy. In the current study, regarding the significant high MD values seen in the majority of the selected white matter regions, this could be explained by the cell death with subsequent increased extracellular spaces making diffusion freer [34]. While the significantly low FA values in some of the selected grey matter regions, mainly on the right side, could be related to the presence of white matter within some of the grey matter structures like the thalamus, which is formed of grey matter nuclei separated by white matter, so any changes in its white matter component could be detected through abnormal FA [35,36].
In our study we found a discrepancy in the FA and MD values in the same selected areas. This could be explained by that FA and MD may vary independently because the damaged brain has glial and neuronal cells; therefore, they have sufficient cell density to prevent the effect on MD, while, because of the disorganization, the FA is reduced. Added to that, microglial and astrocyte activation leads to reactive gliosis preventing the effect of cell death on DTI parameters [34].
In our study, statically significant differences were detected in MD and FA values of the selected right-sided grey and white matter regions compared to those on the left side. This could be explained by the dominance of the right basal ganglionic and limbic system structures in controlling the autonomic activity, which is usually involved during migraine attacks, so further studies are needed to correlate imaging findings with autonomic dysfunction [4].
Significant positive correlation could be found between the MD values of the right hippocampal head and disease duration (r = 0.37, p = 0.036). This can be related to the fact that the longer the disease duration, the greater the frequency of attacks, leading to more susceptibility of brain tissue to ischaemia and as a result more cell death, resulting in increased MD values.
Limitation
The limitations of this study are the small number of patients enrolled in the study and the absence of follow-up DTI for the patients, so studies on larger numbers should be done together with serial follow-up DTI studies. Also, it is better to do further studies using higher tesla scanners like 3 Tesla, with the application of advanced postprocessing DTI and diffusion Kurtosis, which could give better results than our study done using a 1.5 Tesla scanner. Also, the side of the brain region affected should be considered and whether they have different rules in migraine disorders.