


Introduction
Chronic allograft injury (CAI) described by progressive interstitial fibrosis (IF) and tubular atrophy (TA), is the major cause of allograft failure in kidney transplants [1,2]. Understanding the mechanistic pathway of IF/TA accompanied by transplant vascular occlusive changes, subclinical rejection, or transplant glomerulosclerosis is key for early diagnosis in renal dysfunction. Multiple factors, such as immunosuppressive agents, epithelial–mesenchymal transition (EMT), and antibody-mediated injury, are common causes of IF/TA [3]. Renal allograft biopsy remains the gold standard for the diagnosis of allograft dysfunction [4]. In spite of being an invasive procedure with local complications like bleeding, arteriovenous fistula, and pseudoaneurysm formation [5], currently it is the only definitive method for diagnosing CAI. Moreover, the present diagnostic methods are ineffective and inaccurate, eventually resulting in poor predicting outcomes [3]. Thus, an alternative to address these issues would be a noninvasive diagnostic tool to assess the development of progressive renal fibrosis in a transplant allograft.
Recent studies have suggested that quantitative elastography is a good non-invasive tool to assess the liver [6-8] and renal fibrosis [9] in earlier stages. Elasticity imaging or elastography is an imaging modality based on tissue stiffness or hardness, rather than anatomy. Palpation had been used to evaluate malignancy for very long time [10]. Ultrasound elastography can be considered as the imaging equivalent of palpation, being able to quantify the stiffness of a lesion, which was previously judged only subjectively by physical exam. Moreover, a non-invasive elastography technique should be accurate, easy to perform for the grading of abnormalities, reliable, and inexpensive, thus allowing critical monitoring of the progression of fibrosis after transplantation. Therefore, the aim of our study is to evaluate the potential role and reliability of 2D real-time shear-wave elastography in renal allograft recipients and its potential correlation with Banff classification.
Material and methods
Subjects
The study was conducted in a period between January 2017 and March 2019, 192 consecutive kidney transplant recipients scheduled for renal biopsy in our institution were included in this study. The patient underwent both biopsy and transplant stiffness measurement using shear-wave elastography on the same day. 172 patients were taken for this study, 20 patients were excluded due to inconclusive biopsy results, gross obesity and associated AV fistula. Among the 172 patients, 127were males (73.8%) and 45 were females (26.1%). Mean age of the sample group was 43.8 years with range between 9 to 64 years. Majority of our patients were between the age group of 31 to 60 years. Patients with less than 3 months post-transplant procedure, age more than 75 years and patients with gross ascites were excluded. The study design and protocol were approved by Institutional Ethical Committee and all patients provided written informed consent.
Elastography technique
The study was done on a Logiq E9 (GE Healthcare, USA) ultrasonography scanner with dedicated shear-wave elastography (SWE) software. All the measurements were conducted by radiologists, blinded to patient data. Measurements were performed with the patient lying in a supine position. A B-mode study of the transplant kidney was done initially for evaluation of cortical echoes and pelvicalyceal system. A colour Doppler study was performed carefully to look for any arteriovenous fistula, in which case biopsy might have to have been avoided. Simultaneous recording of resistive indices (RI) values was done from upper, mid, and lower poles. Before starting the elastography, the peripheral cortex was preferred with careful exclusion of the medulla from the region of interest (ROI). The region of interest is ideally of about 0.5-2 cm2, with the aim to get at least 1 cm2. Intrarenal Doppler spectra of the segmental arteries were obtained at 3 representative locations from the upper, middle, and lower third of each kidney. The skin allograft distance was also calculated for all 3 locations. Three measurements were taken from upper, middle, and lower locations, so a total of 9 measurements were taken. The scanner worksheet computed the mean score at the end, which was regarded as the mean SWE score.
Renal allograft biopsy
A Tru-Cut biopsy was done using an 18 gauge needle from the lower pole under ultrasound guidance. Histological grading was performed by a pathologist who was blinded to the elastography results. All biopsies were graded according to the updated semi-quantitative Banff classification [11]. Immunofluorescence study was requested in specific cases to look for immunoglobulins and complement components, mainly C4d positivity status.
Statistical analysis
Statistical analyses were performed with SPSS software (version 20). Pearson correlation analysis and Student’s t-test for independent samples were used for evaluations. Descriptive statistics were used to summarize the characteristics of the study group, including means and SD of all continuous variables. Two-sided statistical significance was defined as p < 0.05.
Results
About 172 patients were successfully assessed for the renal allograft parenchymal stiffness. Among the 172 patients, about 55 patients had no fibrosis (grade 0), 79 patients had mild (grade 1), 26 patients had moderate (grade 2), and about 12 patients had severe degree of fibrosis (grade 3). The average mean SWE scores for grade 0-3 were 3.3, 3.5, 4.5, and 5.6, respectively (Figure 1). The maximal mean SWE scores for grade 0-3 were 4.2, 5.0, 5.4, and 6.3, respectively (Table 1). There was a significant correlation between the Banff grade and mean SWE score, with a correlation coefficient of 0.665 (p < 0.001) (Figure 2). The individual correlation coefficients of interstitial fibrosis (IF) and tubular atrophy (TA) with mean SWE score stood at 0.667 and 0.649, respectively (p < 0.001). On comparing the Banff grade and mean polar SWE score (average of 3 readings in 1 pole) in 3 poles of kidney, the lower pole was found to have better correlation. The correlation coefficients were 0.471 in the upper pole, 0.530 in the middle pole, and 0.558 in thje lower pole, with all having p < 0.001. Insignificant correlation was noted between advancing age and degree of fibrosis (p = 0.808). Additionally, no significant correlation was observed with RI when compared to mean polar SWE score in respective poles and the Banff grading of fibrosis. About 33 patients (19.1%) had high creatinine (> 1.5 mg/dl) at the time of biopsy. Patients who had higher creatinine values at time of biopsy correlated with a high Banff grade (r = 0.609) and higher SWE score (r = 0.430) (Table 2). The average skin allograft distance for the upper pole was found to be 2.5 cm, for the middle pole 1.5 cm, and for the lower pole 1.3 cm. A significant difference was noted for the upper pole compared to the middle and lower poles. No significant difference was observed in skin allograft difference between middle and lower poles. Using the Bonferroni test with multiple comparisons and mean SWE score as a variable, it was found that there was no statistically significant difference between the mean SWE scores of Banff grade 0 and grade 1. However, there was a statistically significant difference between the mean SWE scores of other grades (grade 0 vs. grade 2 and 3, grade 1 vs. grade 2 and 3, and between grade 2 and grade 3 fibrosis) (Table 3).
Figure 1
Elastography images of transplant kidney: A) no fibrosis (grade 0), B) mild fibrosis (grade 1), C) moderate fibrosis (grade 2), D) severe fibrosis (grade 3)

Figure 2
Scatter chart with line of best fit showing positive correlation between mean shear-wave elastography (SWE) (kPa) and Banff grading of renal fibrosis. The black triangle markers indicate individual observation and the black line indicates the line of best fit
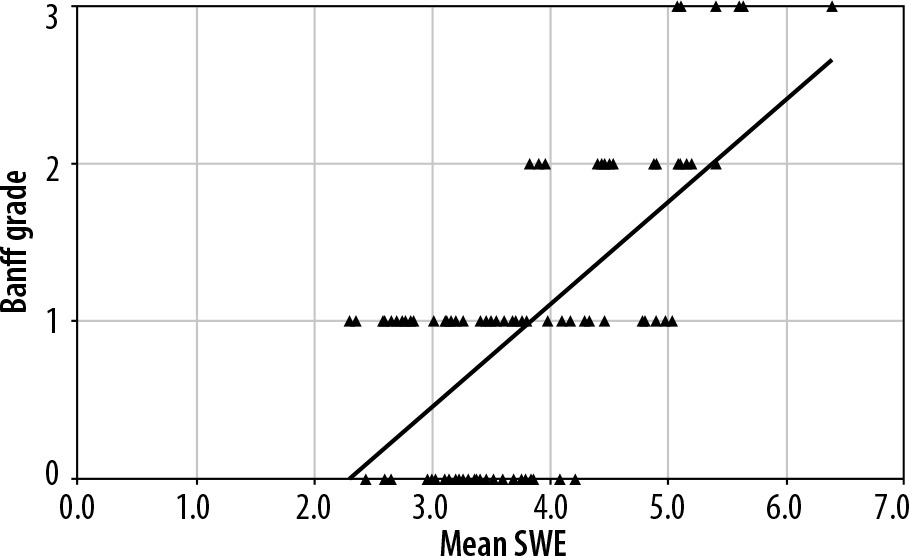
Table 1
Comparison of Banff grades, mean SWE score, standard deviation, and 95% confidence interval
Table 2
Comparing correlation coefficient and statistical significance (p-value) of various parameters with histological grade
Table 3
Mean differences and statistical significance between all grades of fibrosis
On cross tabulation it was found that using a cut off of 4.4 kPa to differentiate low grade (grade 0-1) from high grade (grade 2-3) fibrosis, we achieved a sensitivity of 78.9% and specificity of about 91%. The positive and negative predictive values stood at 71% and 93.8% respectively. Furthermore, using 5.2 kPa as a cut-off to differentiate grade 2 from grade 3 fibrosis, we achieved a sensitivity of 83% and specificity of about 92%. The positive and negative predictive values also stood at 83% and 92%, respectively. Among the 172 patients, the mean time since transplant was approximately 2 years (23.9 months) ranging from 3 months to 15 years. As the time since transplant increased, there was a statistically significant but modest increase in the mean SWE score and the Banff grade. There were 81 patients (47.1%) with time since transplant less than 1 year, and 91 patients (52.9%) with time since transplant equal to or more than 1 year. There was slightly a better correlation of mean SWE score with Banff grade for the latter group (r = 0.680) than for the former group (r = 0.539).
Discussion
Allograft dysfunction and malfunction remain major threats to the long-term survival of the graft and the recipient. Earlier diagnosis of allograft injury enables proper treatment to prevent further damage to the transplanted kidney [12]. Considering the potential risks inherent in allograft biopsies, non-invasive methods are desirable for clinical decision-making, particularly during outpatient follow-up. Ultrasound (US), an economical and non-invasive technique, plays an important role in the assessment of renal allograft function. Recently, in addition to routine B-mode ultrasound, attempts to evaluate kidney allograft function through novel ultrasonic technologies have shown promise. The most useful among them for practical purposes appears to be elastography. Contrast enhanced ultrasound [13], diffusion weighted MRI [14,15], BOLD-MRI (blood oxygen dependent level), and several other MR-based non-invasive technologies, including arterial spin labelling MRI [16], diffusion-tensor MRI [17], and ferumoxytol-enhanced MRA [18], have also been reported to have potential in kidney allograft function evaluation.
The results of our single-centre study in a tertiary care hospital suggest that allograft stiffness significantly correlates with histological grading of transplant fibrosis. The greater the percentage of interstitial fibrosis and tubular atrophy, the faster the shear wave propagates and the higher the renal stiffness score. Regarding this positive correlation, our results were similar to previous studies in the literature by various authors [9,20-22], although the degree of correlation varies. This stiffness measurement reflects a global histological deterioration characterized by the sum of each individual pathological lesion described in the Banff classification [9]. Interestingly two studies in the literature have contradicted these results. Syversveen et al. [23] found no significant difference in median SWV between patients without and with renal allograft fibrosis, as well as low intra- and interobserver agreement rates. The limited number of enrolled subjects (30 patients) and first group consisting of patients at 6 weeks post-transplant, which appears to be too early to detect fibrosis, may be the reason for their results. Another study was by Lee et al. [24], which was a prospective, longitudinal study evaluating acoustic radiation force impulse measurement in 73 renal transplantation patients. They concluded that no significant correlation was observed between shear-wave velocity and renal fibrosis or dysfunction. But in this study, protocol allograft biopsies were performed at 12 months in 73 patients, so kidneys with transplant age more than 1 year were not evaluated, thereby excluding potential patients with advancing fibrosis. Only the lower pole of the transplant kidney was assessed, and 5 SWV value (m/s) measurements per patient were averaged.
Polar significance
We found that the middle/interpolar region was the most challenging from which to obtain homogenous colour-coded images. This could be related to the complex architecture and intrinsic arrangement of vessels within the kidney and various other unknown reasons. There was some fine movement close to the upper pole cortex from the adjacent bowel, which could have resulted in mild inhomogeneity at times in upper polar readings. In our study, lower pole reading appeared to be the most consistent in obtaining a homogenous image compared to other poles. Skin allograft distance was also relatively high in upper pole compared to other poles. It was speculated by Tatar et al. [25] in their study that inflammatory and fibrotic processes may start from the middle part of the renal cortex; however, these findings were not supported by our study. Because the Tatar et al. [25] study had no histological correlation, this hypothesis could not be justified at this point of time. We found a slightly better correlation for the lower pole readings than for the upper and middle pole readings; however, this might be because biopsy is obtained from the lower pole cortex. Larger scale studies comparing all poles with histological correlation are recommended in future to confirm any such hypothesis.
High vs. low creatinine
Diverse opinions and conclusions regarding this parameter exist in the literature. In our study, about 19.1% had high creatinine (>1.5 mg/dl) at the time of biopsy. Patients who had higher creatinine values at the time of biopsy modestly correlated with a high Banff grade (r = 0.609) and higher SWE score (r = 0.430). Arndt et al. [20] and Tatar et al. [25] also found similar correlation, whereas Grenier et al. [9], Syversveen et al. [23], Lee et al. [24], and Gao et al. [26] did not. In transplants with highly impaired creatinine, higher degrees of fibrosis would be expected with worse function. At that stage, the transplant is often at a point of no return, i.e. it is too late to modify immunosuppression to improve graft outcome [23]. Therefore, serum creatinine is limited in terms of estimating graft fibrosis severity. Hence, noninvasive, sensitive diagnostic tools are critically needed for early detection.
Cut-off
By applying the current ARFI technology, our study showed that by using a cut-off of 4.4 kPa to differentiate low grade (grade 0-1) from high grade (grade 2-3), we achieved a sensitivity of 78.9% and specificity of about 91%. The positive and negative predictive values stood at 71% and 93.8%, respectively. Furthermore, using 5.2 kPa as a cut-off to differentiate grade 2 and grade 3 fibrosis, we achieved a sensitivity of 83% and specificity of about 92%. The positive and negative predictive values stood at 83% and 92%, respectively. The overlap between SWE score in different grades of fibrosis was greater between grade 0 and grade 1 and less among other grades.
Similarly to most of the studies in the literature, our study was performed only with a convex probe of 1-6 Mhz frequency. Tatar et al. [25] compared the linear and convex probes for detection of allograft stiffness. According to the results of their study the convex probe can detect the change in mean stiffness better than the linear probe in the evaluation of renal transplant fibrosis.
Age of the patient
As seen in most of the studies in the literature, there was no significant correlation noted between patient age and degree of fibrosis in our study. This suggests that intrinsic and other immunological factors are more important in the pathogenesis of chronic allograft injury as compared to patient’s age. However, as the time since transplant increased, an increase in the mean elasticity score and the Banff grade was noted in our study.
Doppler parameters
In our study, no significant correlation was observed with resistive indices when compared to both SWE score and the Banff grading of fibrosis. Most of the studies in the literature found no correlation between Doppler parameters (RI) and stiffness score, except Ozkan et al. [19], who found a modestly significant correlation (however, this was not confirmed by biopsy in their study).
Conclusions
Our study demonstrated that there was a significant correlation between the Banff grade and quantitative mean SWE score, meaning that ultrasound elastography was a reliable and surrogate marker for early detection of fibrosis in renal transplant. The average of the SWE scores in all 3 poles in the kidney is more predictive than individual and polar averages. Among the 3 poles, the lower pole was found to have slightly better correlation than the others. Patients who had higher creatinine values at the time of biopsy correlated with a high Banff grade and higher SWE score. No significant correlation was observed with resistive indices when compared to SWE scores and the Banff grading of fibrosis. Future studies with large groups of patients are needed to show whether SWE could be a robust screening marker for allograft quantification.
Our study had some limitations. Shear waves are best generated when the architecture of the organ is homogenous. In a transplant kidney this is limited by complex architecture and radial arrangement of the vessels. Elastography generates better and consistent results when major vessels are carefully excluded from the ROI. Because the kidney being a highly vascular organ, it appears to be more challenging than the liver and breast for obtaining homogenous and consistent values. Our sample size was relatively small but sufficient to produce significant results. Inter-observer variation was not assessed in our study. Subclinical rejection, infection, or recurrence of the underlying disease cannot be detected. With a technical failure rate of 3.3%, renal allograft examinations were comparable to those in a study done by Grenier et al. [9] in which they obtained a feasibility of 88% for sampling data.