


Introduction
Eosinophilic lung diseases are a group of pulmonary disorders associated with peripheral or tissue eosinophilia [1].
This group of disorders can be classified into primary (idiopathic) and secondary groups based on their aetiology. Secondary causes include infection, malignancy, allergies, and medications [2]. Primary eosinophilic lung disease (idiopathic) can be classified as independent pulmonary involvement versus systemic involvement. Two eosinophilic lung diseases with independent lung involvement are acute eosinophilic pneumonia (AEP) and chronic eosinophilic pneumonia (CEP) [3].
Idiopathic chronic eosinophilic pneumonia (ICEP) is a rare form of diffuse lung parenchymal disease with an unknown cause, first described by Carington et al. in 1969 [4]. It is, however, the most common of the idiopathic eosinophilic pulmonary disorders [5].
The diagnosis of ICEP is usually based on a combination of clinical manifestations, laboratory test results, bronchoalveolar lavage (BAL) results, radiological findings, and sometimes biopsy findings. Clinical diagnosis is usually based on a triad of pulmonary symptoms lasting more than 2 weeks, abnormal findings on chest imaging, and excessive eosinophils in the serum or lung tissue [6]. Absence of infectious and parasitic diseases and relevant drug history as well as absence of systemic causes are important factors in the diagnosis of this disease [4, 6, 7].
The disease is characterized by progressive shortness of breath, cough, fever, weakness, and weight loss over a period of several weeks [4, 6, 7]. Less common manifestations include rhinitis or sinusitis [8].
Increased serum IgE is seen in two-thirds of patients. ESR is usually elevated [9], and peripheral blood thrombocytosis has also been reported [10].
Eosinophilia in alveoli, especially at values above 40% (with an average of 58% in our series) in BAL, is a prominent feature of ICEP. When CEP is suspected and serum eosinophilia is not significant, BAL may be helpful [11].
Histological findings also typically show the accumulation of eosinophils and lymphocytes in alveoli and interstitial tissue and interstitial fibrosis [4, 12]. A biopsy for pathological confirmation is not usually required, but if performed, tissue findings may include interstitial and alveolar tissue inflammation with eosinophilic dominance as well as foci of organizing pneumonia [6].
Imaging findings, especially CT scans, can sometimes help to diagnose an eosinophilic lung disease. A common finding on chest radiography in CEP is nonsegmental peripheral airspace consolidation oedema, which mainly affects the upper lobes [4,13-15]. However, this finding is seen in less than 50% of cases [16]. In HRCT, opacities are almost bilateral and predominant in the upper lobes, and the most common findings are peripheral ground glass opacity and consolidation [17-19]. Nodular opacities, pleural effusion, pulmonary oedema, atelectasis, and pneumothorax may be seen [20].
Nevertheless, many lung infiltrations in patients with peripheral eosinophilia are non-eosinophilic, for example incidental blood eosinophilia of any aetiology concomitant with primary infiltrating lung adenocarcinoma. In some cases, ICEP can be complicated by another pulmonary disease, for instance superimposed pulmonary infections related to immunosuppression caused by corticosteroid therapy. In a number of these patients the classic HRCT features of CEP can be a differentiating clue, but in most cases the correct diagnosis is still difficult. Considering these challenges, in this article we aim to assess the relationship between HRCT findings and their extent with the blood eosinophilia level.
Material and methods
Patients and study design
This retrospective descriptive-correlational study was performed at the Masih Daneshvari Hospital in Tehran, Iran from 2012 to 2019. During this period all patients with proven CEP, who were admitted to our hospital and had undergone lung HRCT prior to treatment, were included.
The CEP diagnosis was based on lung infiltrations on imaging plus increased number of eosinophils in bronchoalveolar lavage fluid (BALF), blood, or lung biopsy samples, and rapid response to corticosteroids. Patients with history of known aetiologies for eosinophilic lung disease, such as drugs, parasitic infections, allergic bronchopulmonary aspergillosis, or acute presentation as well as clinical or pathological evidence of vasculitis or systemic diseases were excluded from the study [21]. We also excluded cases with a history of prior corticosteroid treatment or corticosteroid treatment in the interval between blood test and CT scan and patients with normal blood eosinophil levels.
The mean interval between blood eosinophil level test and lung HRCT was 3.23 ± 4 days.
Imaging technique
All patients underwent inspiratory HRCT from the lung apex to the lung base, with collimation of 1.5-2.0 mm at intervals of 10-20 mm. Images were reviewed at lung (level, –700 to –550 H; width, 1200-1600 H) and mediastinal (level, 20-50 H; width, 300-450 H) windows. None of the patients received an intravenous injection of contrast medium.
Analyses of high-resolution computed tomography findings
Each lung was divided into 3 separate lobes (RUL, RML, RLL for right lung and LUL, LLL, lingula for left lung). A check list of various findings of CEP on HRCT was designed.
For each HRCT feature, the presence, distribution, and extent were recorded. The extent of each abnormality was defined as the number of involved pulmonary lobes [22,23]. The number of abnormal lobes was defined as the number of pulmonary lobes affected by any of the HRCT findings.
Two thoracic radiologists blinded to the CEP diagnosis and laboratory results reviewed the HRCT images independently, according to the check list. The conclusions were reached through consensus.
Statistical analyses
All data were analysed using SPSS version 22 software (IBM Corp. Released 2013. IBM SPSS Statistics for Windows, Version 22.0, Armonk, NY: IBM Corp). P-values < 0.05 were considered statistically significant. Descriptive data were presented as frequency, percentage, median, mean, and standard deviation.
To assess the relationship between blood eosinophil levels and frequency as well as the extent of various abnormal HRCT findings, the Mann-Whitney U test and Spearman test were used, at a significance level of 0.05, respectively.
Results
In the current study, 52 cases with predetermined criteria were evaluated, of whom 33 were female and 19 were male. The participants’ mean age was 46.60 years with a standard deviation of 16.6.
The lowest density of eosinophils was 545/mm3 and the highest was 18760/mm3 (median of 1284/mm3 with a standard deviation of 5039.18). Sixteen patients had peripheral blood eosinophils below 1000/mm3 (30.77%), and 36 patients had over 1000/mm3 (69.23 %).
The distribution of abnormal HRCT findings is demonstrated in Table 1. The most prevalent abnormal lobes were LUL and RUL. In our results, ground glass opacity (Figure 1), reticulation, atelectasis, and consolidation (Figure 2) were the most frequent and extensive HRCT findings (Table 2).
Figure 1
High-resolution computed tomography of lung in a 78-year-old female with blood eosinophil level of 1020/mm3. Note small and scattered patches of ground glass opacity in right and left upper lobes (A, B)
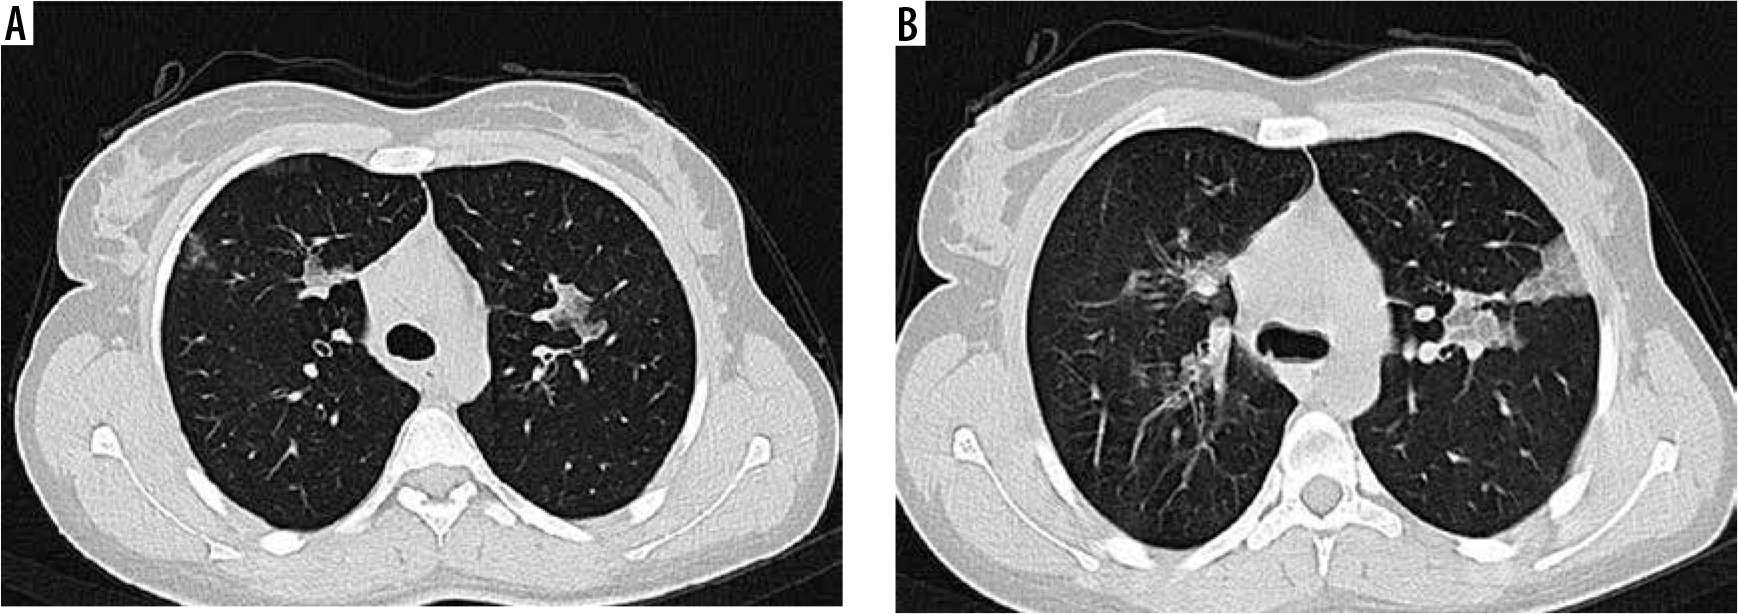
Figure 2
High-resolution computed tomography of lung in a 30-year-old female with blood eosinophil level of 14 270/mm3. Note extensive and confluent patches of consolidation in right and left lungs (A, B)
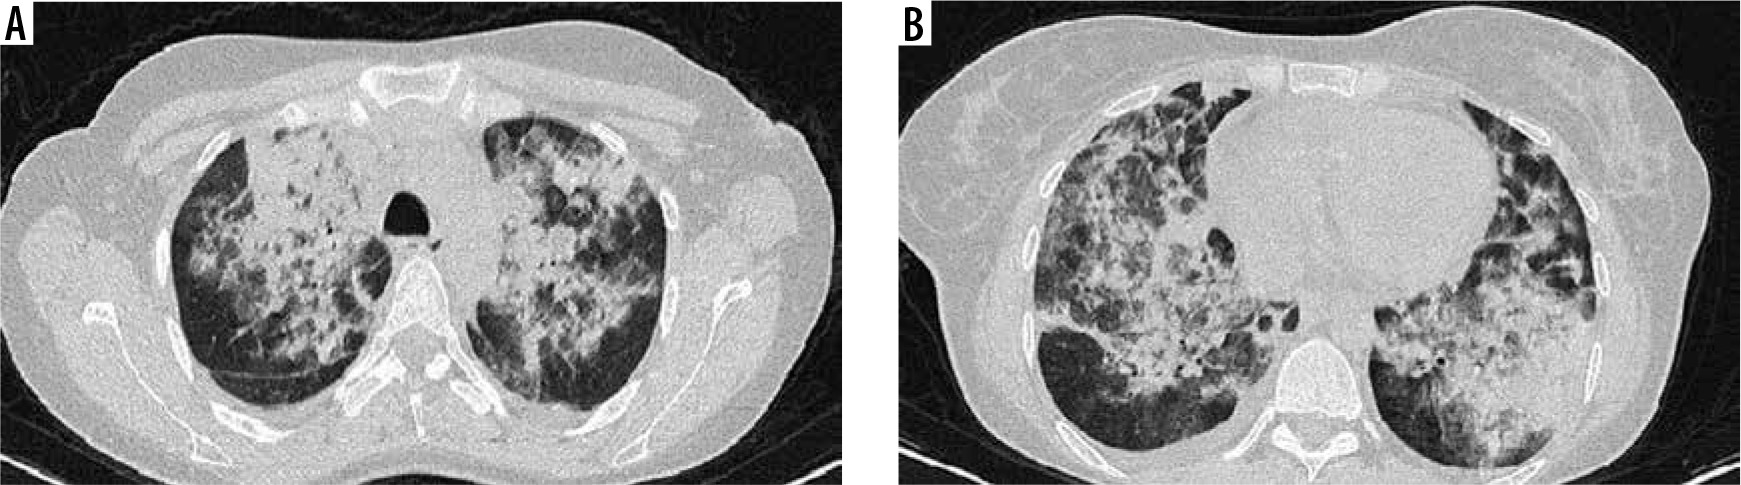
Table 1
Distribution of abnormal high-resolution computed tomography findings in chronic eosinophilic pneumonia patients
| Involved pulmonary lobes | Frequency | Percent |
|---|---|---|
| LUL | 41 | 78.8 |
| RUL | 39 | 75.0 |
| RLL | 33 | 63.5 |
| RML | 32 | 61.5 |
| LLL | 29 | 55.8 |
| Lingula | 29 | 55.8 |
Table 2
Frequency and extent of abnormal high-resolution computed tomography findings in chronic eosinophilic pneumonia patients
The mean and median numbers of abnormal lobes in our patients were 3.9 and 4, respectively, with a standard deviation of 1.54.
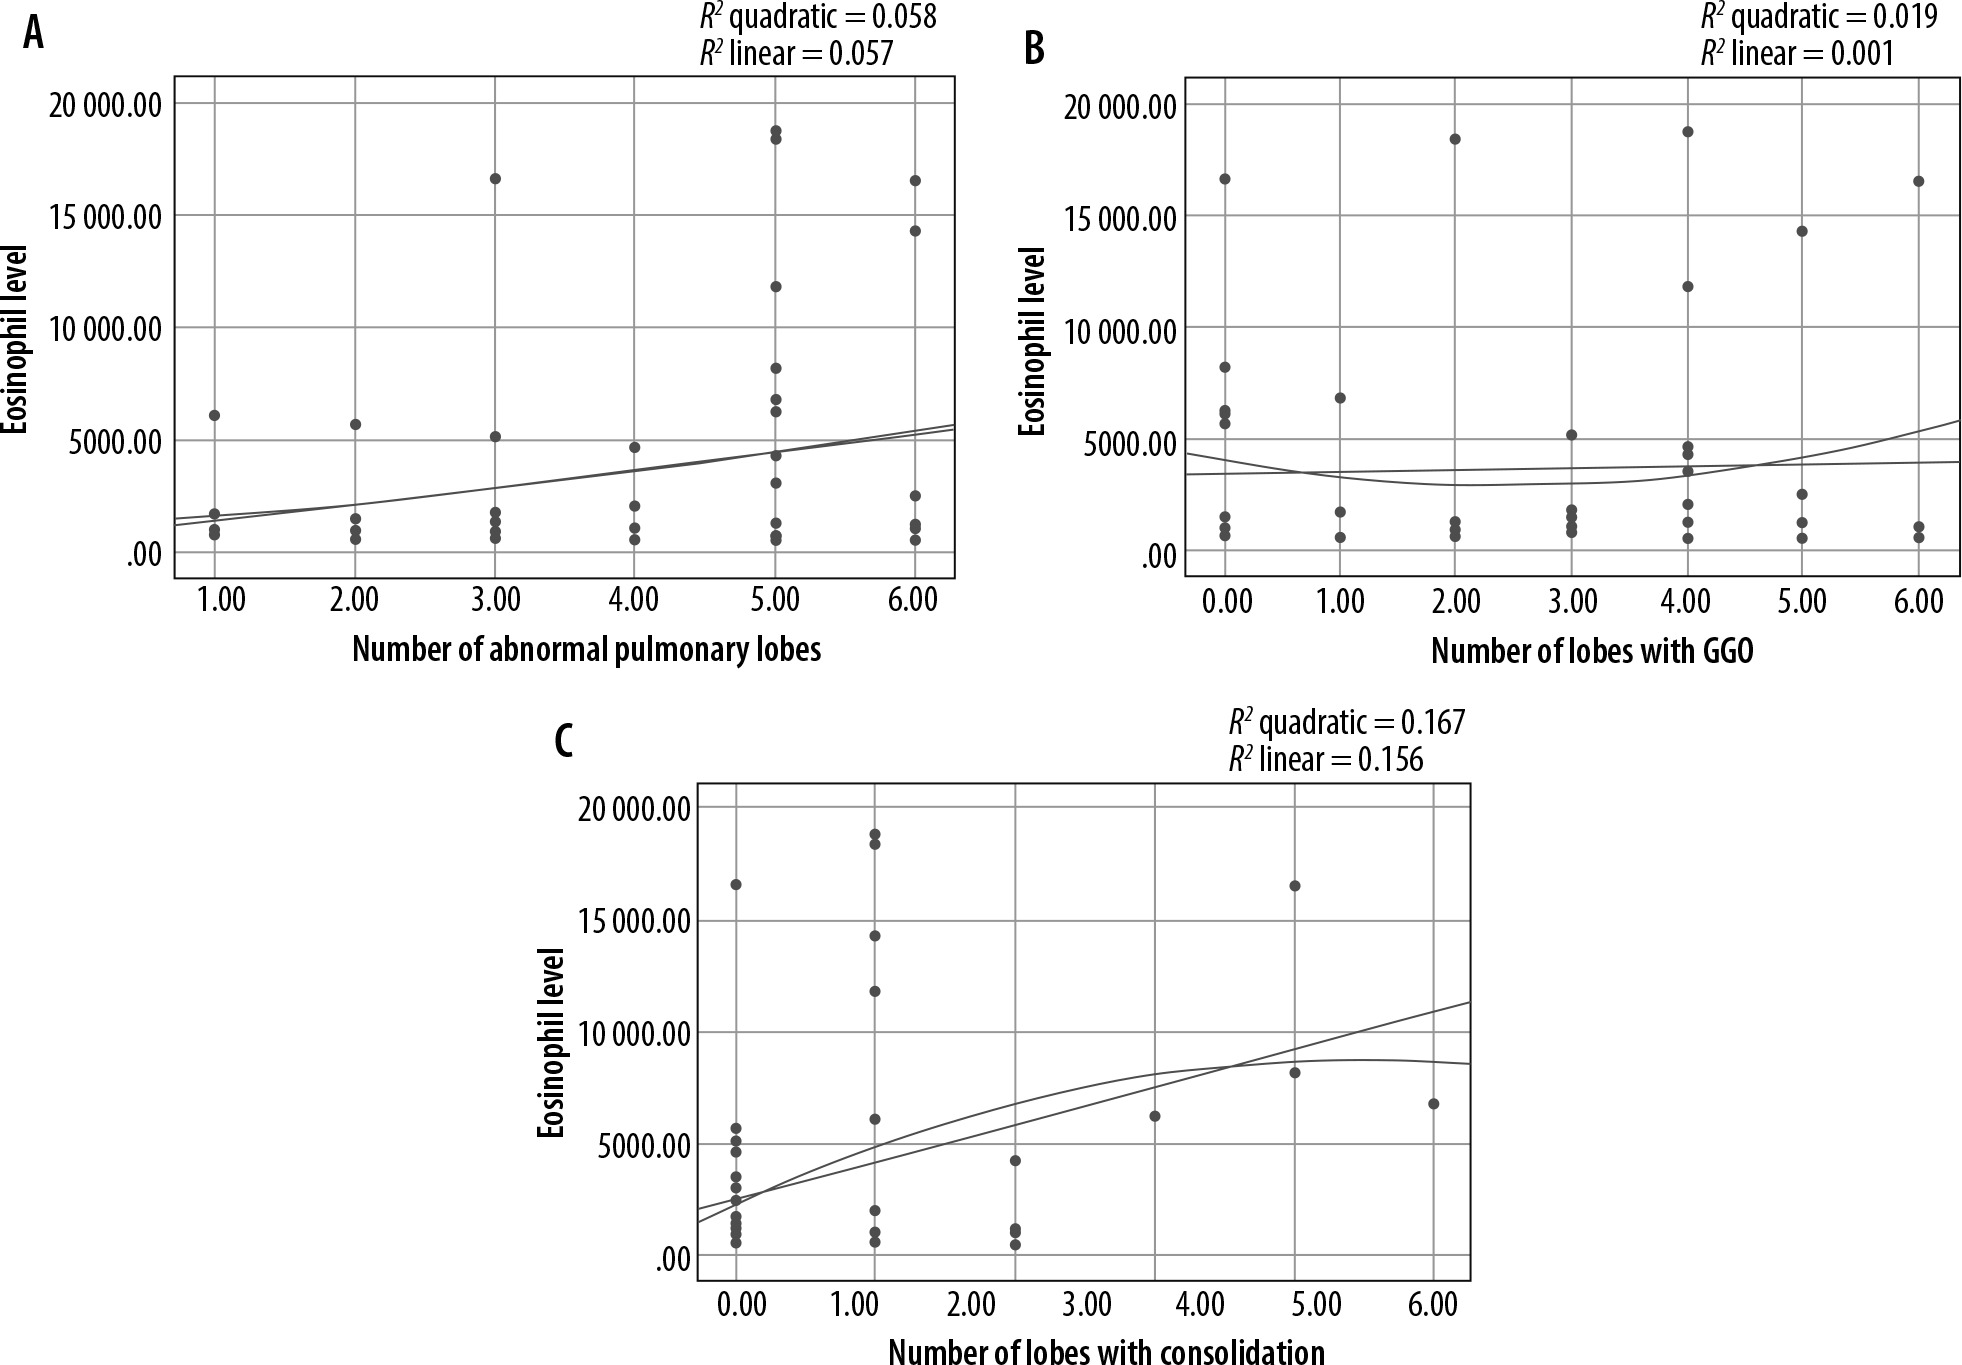
A statistically significant relationship was found between the blood eosinophil level and frequency and extent of consolidation as well as the frequency of LAP (p-value: 0.018, 0.021, and 0.023, respectively). Our results demonstrated no statistically significant correlation between eosinophil level and other abnormalities. The correlation of eosinophil level and extent of consolidation, GGO, and abnormal pulmonary lobes is shown in Figure 3.
Discussion
In this study, we assessed the frequency, extent, and distribution of abnormal HRCT findings in ICEP and the relationship between these findings and peripheral blood eosinophil count.
According to our study, the disease has a 1.73 : 1 female predominance. The mean age of patients was 46.6 years, and HRCT findings have upper lobe predilection. All our findings were similar to previous studies [1,3,24,25].
In a review article by Matthew et al. it is stated that consolidation and GGO are the most common HRCT findings and are predominantly present in upper lobes [3]. In the current study, the most common abnormalities in HRCT were GGO, reticulation, atelectasis, and consolidation. Less common findings include bronchiectasis, LAP, pleural effusion, and nodule. These results are also similar to previous research [1,21,24-26]. In our study, GGO was the most frequent and extensive abnormality. However, in some similar studies consolidation was the most frequent finding [1]. This at least in part can be related to different slice thickness of HRCT and spiral CT images.
We could not find any study that evaluated the relationship between peripheral eosinophil level and HRCT findings in the available literature. In a study by Poznanovic et al. a significant positive correlation between peripheral eosinophil level and paranasal mucosal disease based on CT was found [27].
In our research, among various abnormal HRCT findings that were evaluated, only the frequency and extent of consolidation had a significant positive correlation with the level of peripheral eosinophilia. This means that in patients with ICEP, as the number of lobes with consolidation increases, the level of blood eosinophilia also increases, and vice versa. We could not determine definite significant cut-off values that could have practical clinical implication for differentiating between eosinophilic and non-eosinophilic lung infiltration (possibly because of the small number of patients).
Finally, our study had some limitations. It was retrospective, the sample volume was rather small, and the bronchoalveolar lavage fluid (BAL) eosinophil level was not included in the study. This might have some relationship with HRCT findings. Also, it was limited to ICEP patients with peripheral eosinophilia.
Future prospective studies with larger numbers of patients and including various types of idiopathic and secondary eosinophilic lung infiltrations with blood eosinophilia are required to verify our results and characterize any relationship between blood eosinophilia and HRCT findings in more detail.