


Introduction
1H-magnetic resonance spectroscopy (1H-MRS) is a non-invasive technique that provides information on tissue metabolism and biochemistry [1], which is important from a clinical point of view because it allows for better lesion differentiation and appropriate treatment application, with no need to perform invasive diagnostic procedures. It can be particularly useful in cases of intramedullary lesions because of the high risk of serious biopsy and surgery complications [2]. The main goal of this study was to develop a routine protocol for MRS of intramedullary lesions.
Although the 1H-MRS technique itself has been known and successfully used for years in brain examinations (e.g. for lesion differentiation), to obtain diagnostic spectra of the spinal cord is not an easy task. Differential diagnosis of the intramedullary lesions based on medical imaging is more troublesome. Implementing 1HMRS in spinal cord might provide an additional parameter to differentiate these lesions with more confidence. There are however many technical difficulties associated with spinal cord 1H-MRS to overcome the following: low signal-to-noise ratio associated with small voxel size (voxel size is limited by spinal cord dimensions), and field inhomogeneity caused by cerebrospinal fluid (CSF) flow influenced by cardiac and respiratory movements, as well as the patient body motions.
The first approach to this topic task was made in 1997 by Gómez-Ansón et al. [3], who described examinations performed in cervical spinal cord in healthy volunteers. The authors achieved good quality data and made an attempt at metabolite quantification, and proved that the concept of 1H-MRS in spinal cord is possible and technically achievable. Next, several studies in healthy volunteers were made, most of them aimed to overcome the above-mentioned difficulties. The first major paper was published in 2004 by Cooke et al. [4]. The authors’ meticulous approach was a real breakthrough in 1H-MRS of the spinal cord. With a 2T spectrometer and purpose-built quadrature surface coil, Cooke et al. tackled the most important problems of field homogeneity, voxel size, spinal cord movement, and metabolite quantification. Several conference proceedings [5-7] and scientific papers [8-11] further explored the topic. Their main goal was to improve the methodological aspect, but studies with multiple sclerosis (MS) patients were also performed. Another milestone work was published by Henning et al. [12]. It not only explored in detail other spinal cord regions, but was also the first work on spinal cord tumours (apart from a short paper by Dydak et al. [6]). The tumour group was small (2 patients only); however, the metabolite ratio changes observed in brain tumours were present also in cases of spinal cord tumour. Hock et al. [13] reviewed all the above-mentioned papers to date and described what state-of-the-art 1H-MRS acquisition should include. Another study by Hock et al. concerned improvement of the acquisition scheme to acquire higher quality spectra [14-17]. However, the state-of-the-art protocol reported previously was still viable.
Material and methods
Study population
To establish proper acquisition parameters, 1H-MRS was tested on a group of healthy volunteers (n = 12, 9 males and 3 females); 48 spectra were acquired in total. Thirty of them were acquired in cervical spinal cord, and the remaining (18 spectra) were acquired in the thoracic spinal cord. In the end almost the entire extent of the spinal cord was tested for viability of spectroscopic acquisition. The volunteers had no history of spinal cord injury or disease, written informed consent was obtained from all of them prior to magnetic resonance imaging (MRI) examination, and they had no contradictions to perform such a study. Examinations were performed on a 3T Siemens Prisma scanner with various acquisition parameters until the desired spectra quality was achieved. Each study lasted approximately 1 hour. The whole procedure was in accordance with the Helsinki Declaration and the ethical standards of the responsible Local Ethics Committee.
Experimental
For all volunteer exams multiple 1H-MRS acquisitions with varying parameters were performed, to check their impact on spectra quality. Base parameters were chosen according to guidelines presented in major methodological papers [4,12,13], but several adjustments were made to acquire the highest quality on the 3T system. Single-voxel point-resolved spectroscopy (SVS-PRESS) sequences with water suppression were used to acquire short- and long-echo time spectra (30 and 135 ms, respectively). RF coils were chosen depending on the examined region; for the cervical spinal cord – neck elements of the multichannel head coil array were used (20-channel head coil); for the thoracic region elements from the multichannel spinal coil array were used (32-channel spinal coil). For every acquired spectrum coil element the voxels closest to MRS were used for signal reception, so only a part of the coil array was used as described by Henning et al. [12]. Before final placement of the spectroscopy voxel, high-resolution isotropic T2 images were acquired (TR/TE 1500/131 ms, 0.8 mm3 voxel, 1.4 Nex, flip angle [FA] 140°, field of view [FoV] 250 x 250, iPAT 2 GRAPPA). Hock et al. [13]outlined that maximum effort must be applied to ensure adequate voxel placement, which is possible only if high-resolution images showing boundaries between spinal cord and CSF are obtained. Due to the small size of the spinal cord, the maximal voxel size was confined to its dimensions (voxel volume varied between 1.1 and 2.78 cm3 [mean 1.84 ± 0.48 cm3]). The average dimensions in each direction were 7 x 9 x 29 mm. To keep the SNR at the sufficient level, spectra were heavily averaged: 256 for TE 30 ms and 320 for TE 135 ms. ECG gating was used to avoid the influence of the spinal cord movement due to CSF flow. Acquisition was delayed by 300 ms to the R wave of the ECG signal to acquire spectra only in diastole, when CSF flow is slowest. A repetition time (TR) of 2000 ms was used, but the real time between excitation pulses was determined by the subject’s heart rate (HR). To prevent CSF flow problems and to eliminate spectra contamination by the lipid signal from the bones, 6 saturation bands were used in the top, bottom, right, left (R-L), anterior, and posterior (A-P) directions. Top and bottom ones were fine-tuned to saturate the water signal (to negate the CSF flow), the and R-L and A-P ones were fine-tuned to saturate the fat (to negate lipid contamination from the bones). Because of the high number of averages and additional ECG gating, the total acquisition times were 10:52 min for TE 135 ms and 8:34 min for TE 30 ms. Soft pads were placed under the subject’s legs and shoulders to provide the highest level of comfort in the supine position. Additionally, when requested, a flat soft pad was placed under the subject’s lumbar spine. A blanket was provided for thermal comfort when needed. Each volunteer was also informed about the crucial effect of any movement on 1H-MRS acquisition quality. Before each measurement a manual shimming routine was performed to minimize full width at half maximum (FWHM) of the reference water peak and to ensure that the spinal cord was on resonance, as described by Cooke et al. [4]. During acquisition single spectral averages were observed, and when a high, broad peak was seen at the lipid and macromolecule part of the spectrum, the acquisition was stopped (in most cases that happened because of volunteer movement, so the signal was received from the bones). Next, high-resolution T2 acquisition was repeated, with precise readjustment of voxel position.
Spectrum post processing
To improve the spectra quality, they were analyzed by an experienced user with Syngo software (Siemens AG, version VE61A) to look for severe lipid contamination, peak overlap, or other signs of bad spectra quality. After initial quality control, the chosen spectra were analyzed with LC-Model software (version 6.1-4F) [18] (Figure 1).

A standard set of central nervous system magnetic resonance spectroscopy metabolites were fitted to the spectra [20]; ones with Crame’r-Rao lower bounds smaller than 25% were considered as present in the acquired spectrum. An internal calibration water peak method was used for quantification of metabolite concentration; however, no coil sensitivity adjustments were made [19], so the calculated concentrations are in units specific to the site and scanner used.
Discussion
MRI is the method of choice in spinal cord imaging. Its unique and robust tissue contrast capabilities are unmatched in intramedullary lesion differential diagnosis. Standard sequences are well suited to estimate lesion size and its contrast enhancement, as well as any syrinx that is commonly associated with spinal cord tumours. However, newer methods are capable of imaging much more. Diffusion weighted imaging (DWI) and diffusion tensor imaging (DTI) are other means of looking into tissue microstructure. DWI displays how well water molecules diffuse in the given tissue; it is restricted in area of cytotoxic oedema, high cellularity tumours, and abscess. DTI with fibre tracking is highly effective at preoperative planning, when knowledge of certain fibre bundles is crucial for positive surgery outcome. Another diagnostic method is 1H-MRS. It is a gateway into tissue biochemistry. Knowledge of metabolites that are present only in certain types of tumours or of some level of one metabolite that is related to a certain type of tumour can be very helpful in differential diagnosis.
1H-MRS has an established position in brain lesion differential diagnosis. However, patient movements, low signal-to-noise ratio associated with small voxel size, and field inhomogeneity caused by CSF flow and internal organ movement are factors to be dealt with in 1H-MRS in the spinal cord. Volunteer examinations are the first step in establishing a successful acquisition scheme. 1H-MRS in the spinal cord had been summarized in a work by Hock et al. [13]. However, hardware can differ, as can software. Sometimes minor, but in most cases major, adjustments are needed.
Proper voxel positioning is essential for successful 1H-MRS in spinal cord. Most papers focus on cervical spinal cord spectroscopy, where positioning is less troublesome, and attention is drawn to voxel spanning across as few interspinous spaces as possible [4] because the shim quality depends on it. In the cervical spinal cord it is relatively easy, but on the cervicothoracic border, where curvature is present, that task becomes much more difficult.
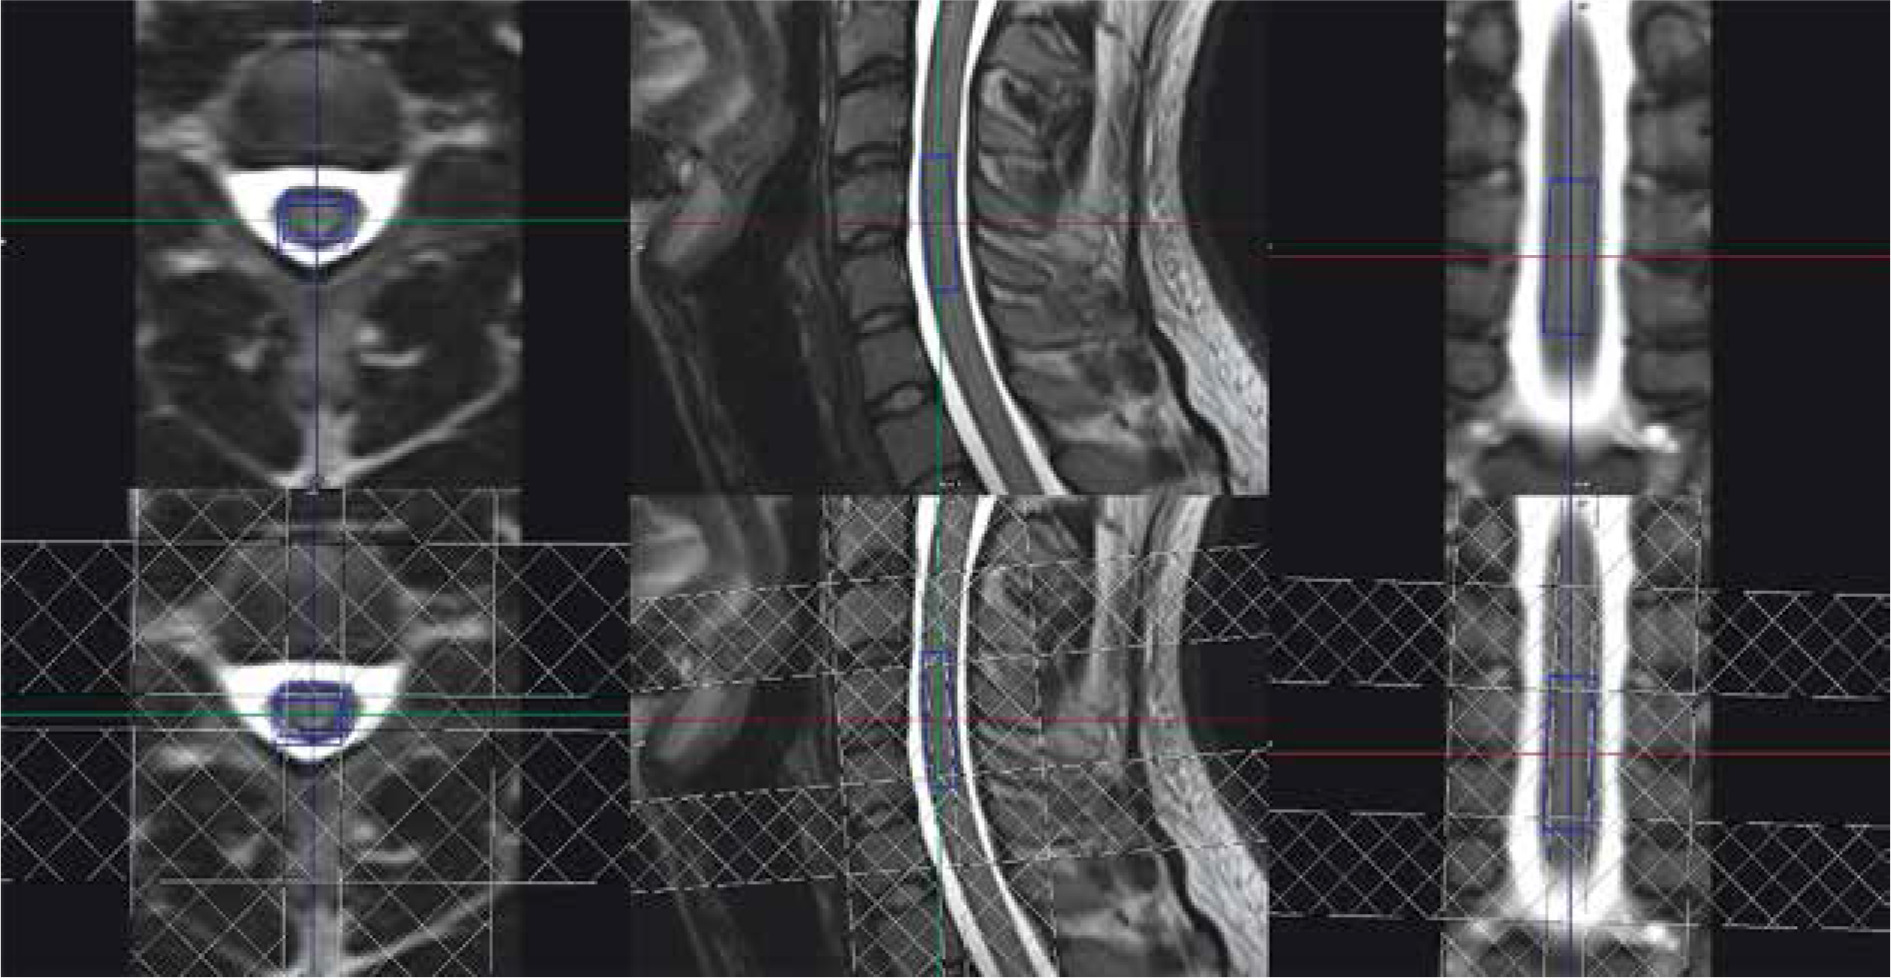
In our study, the 1H-MRS voxel was positioned on T2 isotropic sequence images. Reconstructions were made with planes chosen according to the desired spine level, so the transversal plane was perpendicular to the spinal cord on a given level and the sagittal/coronal planes were in parallel orientation. Saturation bands were used to reduce CSF flow artifacts, to supress signals from outside the voxel, and to avoid artifacts caused by the chemical shift. In the final iteration they were placed as in the review of Hock et al. [13], overlapping with voxel volume. Four saturation bands were distributed to establish proper saturation of the lipid signal from the spine. It covered the anterior, posterior, left, and right plane of the positioned voxel. These saturation bands were fine tuned to saturate the bone signal, which means they saturated the part of the spectra at 1.3 ppm. Additionally, 2 saturation bands, fine-tuned to saturate water (4.7 ppm), with the intention of further negating CSF flow effects, were placed at the cranio-caudal sides of the voxel. Spectra acquired without saturation pulses were more often contaminated with fat in comparison to voxels with saturation bands.
In 1H-MRS of the spinal cord the most important problem is the small voxel size. As mentioned in this paper, the voxels dimensions in this study are much smaller than those in brain examinations. The size of the voxel is crucial in achieving good SNR, because these 2 parameters have strong correlation; in other words, the voxel needs to have adequate volume or the acquisition will last too long. Right-left and anterior-posterior voxel dimensions are fixed for a given subject and the level of the spinal cord; they are limited by the spinal cord dimensions. The cranio-caudal length in volunteers is adjustable; however, in patients, the size of the voxel is determined by the lesion size. Cooke et al. [4] found the volume of 9 ×7 ×35 mm to be optimal in cervical spinal cord, which is achievable in the cervical region, but beyond that it is not. Henning et al. [12] suggested a range of 4 × 6 × 15 mm to 6.5 × 8.5 × 27 mm, which is closer to the average voxel dimensions used in this paper (7 × 9 × 29 mm) (Figure 2). Every voxel encompasses both white and grey matter. |The obtained spectra contain the averaged signal of the whole spinal cord at a given level, or at a few levels if the voxel is long enough. 1H-MRS has inadequate resolution to differentiate between white and grey matter.
If the voxel size is very small, good SNR is achievable only with a sufficient number of averages and good acquisition scheme. According to the literature, we used the PRESS voxel location method for spinal cord 1H-MRS, because of its high SNR. When seeking robust acquisition that can be used on patients, the number of averages cannot be too high because of the time factor. All patients are able to be perfectly still only for a limited amount of time. Henning et al. [4] proposed 512 averages, which leads to acquisition time between 17 and 21 min (depending on HR). For the majority of patients this is too long. In this study, 256 averages were used with short echo time (TE) and 320 averages were used with long echo time (TE) acquisitions, which is a reasonable compromise between SNR and acquisition time. The acquisition time of 1 spectrum is 10 min, which was tolerable for all the volunteers. Also, in clinical 1H-MRS of the brain, reference spectra are always acquired. In the spinal cord, because of the long acquisition time, they are not. A long scanning time in 1H-MRS increases the probability of patient movement, so we used all available methods that could improve the patient’s comfort during the exam.
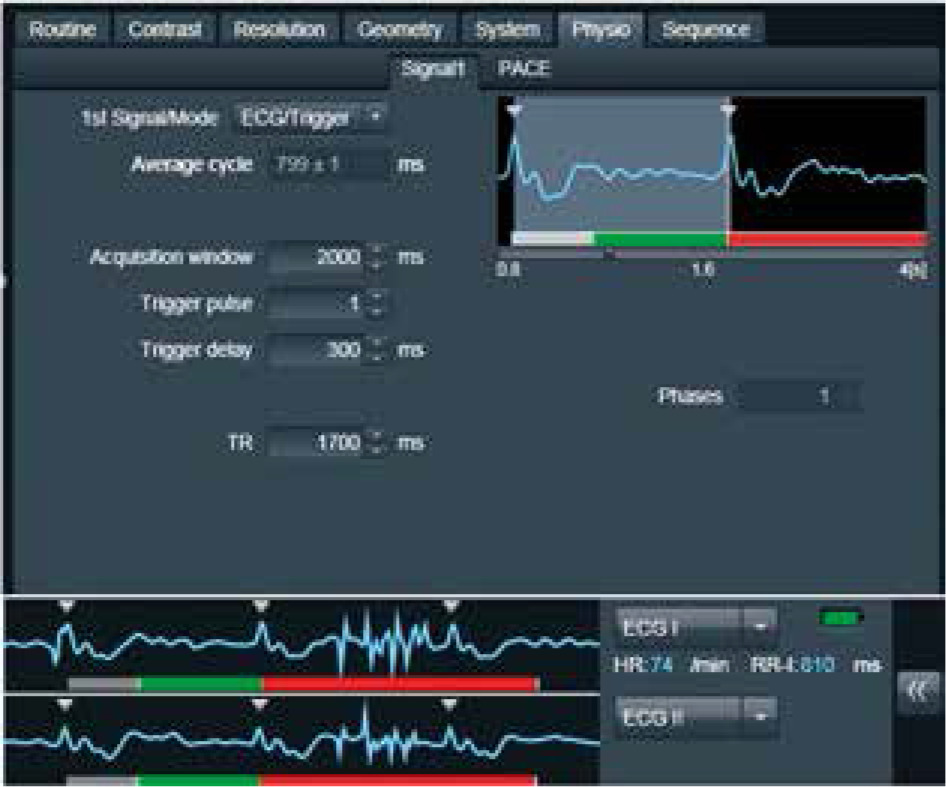
All major papers agreed upon the necessity of cardiac gating. Cooke et al. [4] was the first to find that ECG gating led to significant spectral line narrowing. The spectral line width is essential for metabolite quantification. The idea of ECG gating is to measure the signal from spinal cord only when it is still, i.e. when CSF pulsation is slowest, which corresponds to the heart diastole. We used an ECG device with 300-ms delay in relation to an R wave, so the pulse sequence was shifted to a diastole (Figure 3).
Monitoring single spectra averages in the inline display on the scanner was found to be very helpful. The scanner software allows us to observe a single average of the ongoing acquisition. If the subject moved during the acquisition, a clear fat signal could be seen as the lipid and macromole-cule part of the spectra (0-1.9 ppm). In that case the acquisition should be stopped and rerun with a new localizing sequence. This prevented wasting time acquiring spectra that were doomed or were of poor quality because of patient movement that caused a fat contamination (Figure 4).
Figure 4
Peak rising in the marked area (1.3 ppm) during acquisition indicates lipid contamination of the spectra, which suggests subject movement

Overall, less than 60% of spectra were of acceptable quality in the volunteer examinations; however, for such a difficult task the learning curve is steep. Concentrations that were obtained are useful only internally, because no coil sensitivity adjustments were made. In the case of preliminary studies, such as this one, this is acceptable, but in future absolute concentrations are necessary for precise information about lesion biochemistry. Quantification was the secondary goal of this study; the primary one was fine tuning the protocol setting. The acquired data might prove its utility, but the limited sample size is definitely a major drawback.
For data summarized in Table 1 the metabolite levels from long TE (135 ms) spectra were chosen. Because at longer echo time the spectra are less complicated, with only 3 important metabolites present (choline, creatine, and N-acetylaspartate), assessing their quantity is more reliable. This statement holds true in clinical practice. However, long TE data suffer from lower SNR compared to shorter echo times. A short TE (30 ms) spectrum is presented in Figure 1. The main benefits of this echo time are as follows: the presence of additional metabolites (some of which overlap with the ones acquired at 135 ms) and higher SNR. More metabolites might provide additional information of tissue biochemistry, with some being directly linked to certain pathologies (succinates in abscesses). Additionally, lipids and macromolecules are present in short TE spectra. They are prominent in necrosis. In spine MRS, as mentioned before, they can be used as a marker of spectra quality. Metabolite levels from short TE are not reported here.
Table 1
Mean values of metabolite concentrations with standard deviation in site and scanner-specific units
| Cho | Cr | NAA | SNR | |
|---|---|---|---|---|
| Mean | 2.2 | 5.0 | 7.1 | 2.2 |
| SD | 1.0 | 2.9 | 4.0 | 1.1 |
In this study 63% of spectra were measured in the cervical spinal cord and 37% in the thoracic spinal cord. Only 2 spectra in the thoracic spinal cord were considered to be of good quality. Breathing and heart motions are a major problem in the thoracic region.
Conclusions
MRS of the spinal cord is a promising tool for research and diagnosis because it can provide additional information complementary to other non-invasive imaging methods. Spectroscopic acquisition in the spinal cord should meet some of the challenging requirements of achieving sufficient SNR and avoiding fat contamination, which is essential to accurately evaluate the metabolites. The proper positioning of the voxel is the most important aspect. For accurate placement, a good-quality isotropic T2 sequence is needed. Fat contamination could be avoided if saturation bands are fine-tuned to saturate that component in the following examinations. Voxel size should be maximized and suited to spine dimensions in the right-left and anterior-posterior directions. The cranio-caudal size should be maximized according to the spinal cord curvature or suspicious lesion shape. Spectra should be heavily averaged, but because time is a factor, a single acquisition should not be longer than 10 min. Pulsation of cerebrospinal fluid leads to wider metabolite peaks and lower SNR, so its contribution should be eliminated by ECG gating. Lastly, the single spectrum average should be monitored periodically on an inline display for fat contamination. In the case of fat contamination, spectra acquisition should be repeated with another isotropic T2 localization sequence.