


Introduction
Intracranial fluid spaces are an important element of the system associated with the circulation of cerebrospinal fluid. The studies of these spaces are important because of disturbances in the circulation of the fluid causing internal or external hydrocephalus. In particular, external hydrocephalus is interesting because of its varied aetiology and the course in children, for whom it is possible to distinguish benign external hydrocephalus or benign enlargement of subarachnoid spaces (BESS) characterised by the widening of the subarachnoid space without clinical symptoms that may indicate developing disease. BESS usually resolves before the age of two years [1,2]. However, external hydrocephalus is associated with symptoms such as convex fontanelle and markedly enlarged head circumference, as well as developmental disorders of varying severity [2]. In premature infants with even small intracranial haemorrhages, the subarachnoid space is also widened [3]. The subarachnoid space can become widened or narrowed depending on the disease it accompanies. In particular, congenital-based central nervous system (CNS) changes as well as posttraumatic or postinflammatory changes can influence the size of intracranial fluid spaces [4]. In the case of cerebral oedema or secondary normal pressure hydrocephalus (sNPH), the subarachnoid space usually becomes narrower [5]. Uneven enlargement of the subarachnoid space was also observed in older children undergoing antibiotic therapy [6] and in adults with idiopathic normal pressure hydrocephalus (iNPH), where the subarachnoid space in the vicinity of the frontal squama became narrowed, but the Sylvian fissure and subarachnoid cisterns at the base of the skull became widened. By comparison, in the sNPH the entire subarachnoid space is evenly narrowed [7,8]. To assess the degree of expansion of the intracranial fluid spaces, mainly linear indices have been developed, reference values of which are used to determine both the degree of enlargement of fluid spaces as a result of progression of the disease, as well as the effectiveness of treatment. These indices relate mainly to the ventricular system, and their values are expressed as mean values obtained for individual age groups without specifying their ranges [9,10]. At present, attempts are being made to assess the volume of the ventricular system to more accurately determine the degree of its enlargement and the amount of cerebrospinal fluid accumulating. However, linear indices are simpler to apply in clinical practice and are basically no less accurate than volumetric measurements [11]. In the case of measurements of the subarachnoid space and arachnoid cisterns, such measurements in the available literature are limited and describe the dimensions directly measured. In addition, available results come from various imaging methods used for diagnostics in infants and children, such as ultrasonography (USG), computed tomography (CT), and magnetic resonance imaging (MRI). In all these cases it is possible to determine linear measurements of particular parts of the subarachnoid space, but their comparison to each other, the same as determining of the reference values allowing their use as an aid in external hydrocephalus diagnostics, is difficult due to the different measurement methodology. In children of all ages, it is necessary to take into account changes in the size of the skull associated with its growth, posing an additional challenge when trying to set reference values for the space that we assess in relation to the age of the child.
The authors of presented work have attempted to develop reference values for linear indices describing the size of the subarachnoid space and subarachnoid cisterns in children, taking into account changes in the size of the skull depending on their age.
Aim of work:
Assessment of size changes of the subarachnoid space and subarachnoid cisterns in children according to the age based on selected linear dimensions.
Assessment of size changes in the subarachnoid space and subarachnoid cisterns in relation to the size of the skull based on selected linear indices in children obtained in different age groups.
An attempt to establish reference values of linear indices describing subarachnoid space and subarachnoid cisterns for different age groups.
Assessment of the values of linear indices obtained in the group of children with unchanged (normal size) and enlarged or narrowed (abnormal) fluid spaces to confirm the homogeneity of the tested group.
Material and methods
A retrospective study was conducted on 507 selected CT scans of the head from patients diagnosed at the John Paul Upper Silesian Child Health Centre (Independent Public Clinical Hospital no. 6 of the Medical University in Katowice). The research material in the form of CT images included Polish Caucasian children from the day of birth to the age of 18 years (297 boys, 210 girls), who were referred for imaging examinations for various medical reasons.
From the studies, the following were excluded: children with genetic diseases, underdevelopment, intraventricular or subarachnoid haemorrhage, or after head injury. Additional exclusion criteria were applied to children diagnosed with central nervous system inflammation and prematurely born children. In total 507 studies met the initial inclusion criteria.
In order to determine the study group, which was used to develop the reference values of linear indices describing fluid spaces, the patients were divided into two groups depending on the description made by the experienced radiodiagnostics specialist. In the first group (Group I) the studies were classified as normal in the description. In the second group (Group II) the studies were classified as abnormal: with enlarged (in the case of internal or external hydrocephalus) or narrowed fluid spaces. Finally, Group I included 381 children (217 boys, 164 girls), Group II – 125 children (80 boys, 45 girls).
In both groups, linear measurements of selected dimensions of the subarachnoid space and subarachnoid cisterns were made. The results obtained in Group I were used to develop the reference values of selected linear parameters. The results from Group II, initially excluded from the material used to establish the reference values, were helpful to illustrate how the ranges and descriptive statistics of measured dimensions change in the group with pathology within the fluid spaces as compared to the group of children without pathology. This allowed us to demonstrate the homogeneity of the group, which was the basis for the development of reference values.
Approval for this retrospective study was obtained from the Bioethics Commission of the Medical University of Silesia.
Measurements
CT examinations were carried out in the transverse plane with a layer thickness of 3 or 8 mm with Siemens Somatom PLUS 4 apparatus. CT scans of the head were performed as standard in axial planes parallel to the plane connecting the lower orbital line with the external auditory opening. Linear measurements were made on CT scans on a dedicated graphics station using SIENET Magic View 300 software – DICOM CD Browser. The measurements were made on unified cross-sections of the head. All measurements were performed directly on CT scans. Each measurement was taken with an accuracy of 1/100 mm. The measurements were performed twice by one operator on the workstation. After performing direct linear measurements, the linear indices taking into account the differences in the size of the skull in children depending on the age were made by dividing the measured sagittal dimensions by the maximum sagittal internal dimension of the skull, and the measured transverse dimensions by the maximum transverse internal dimension of the skull. Indices were developed based on data obtained from the literature [9,12] with the authors’ modification. The gender of the respondents was not taken into account because, according to data from the literature, there are no differences in the values of indices describing fluid spaces between boys and girls [9].
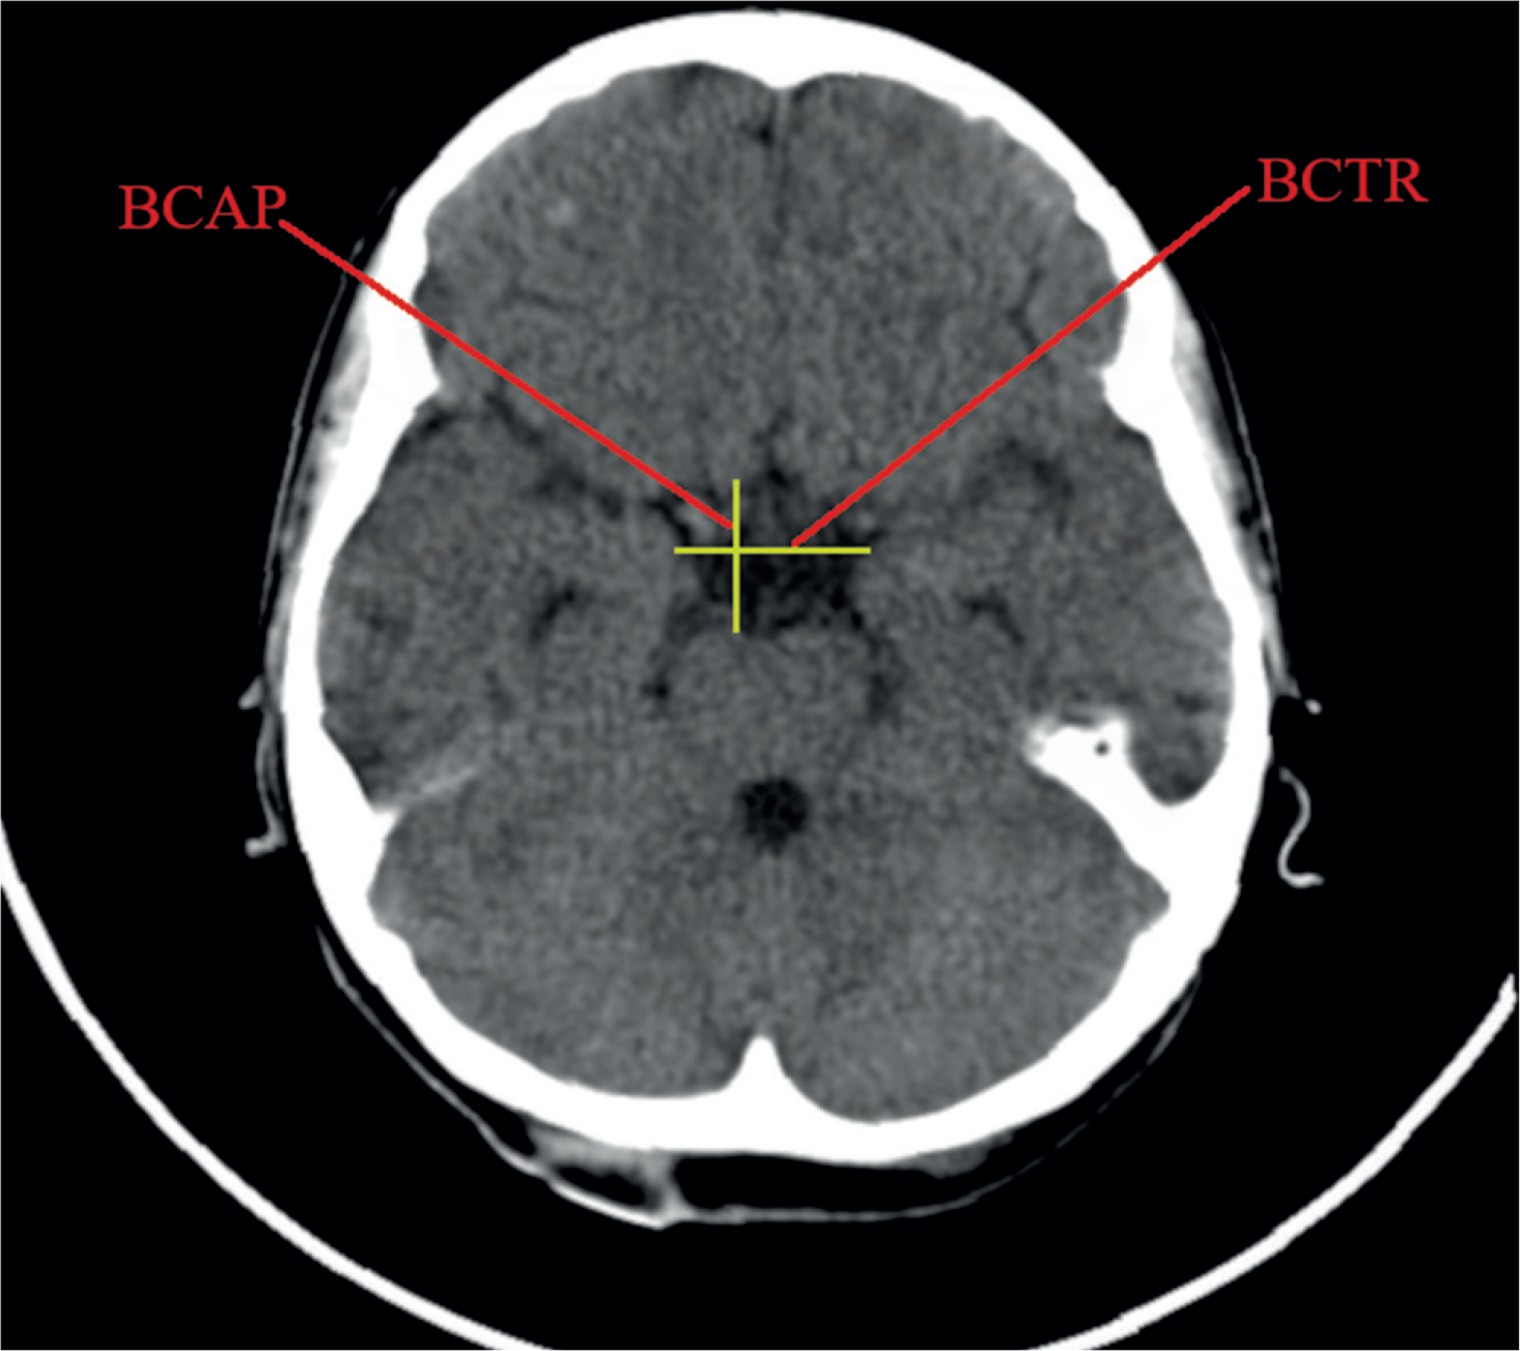
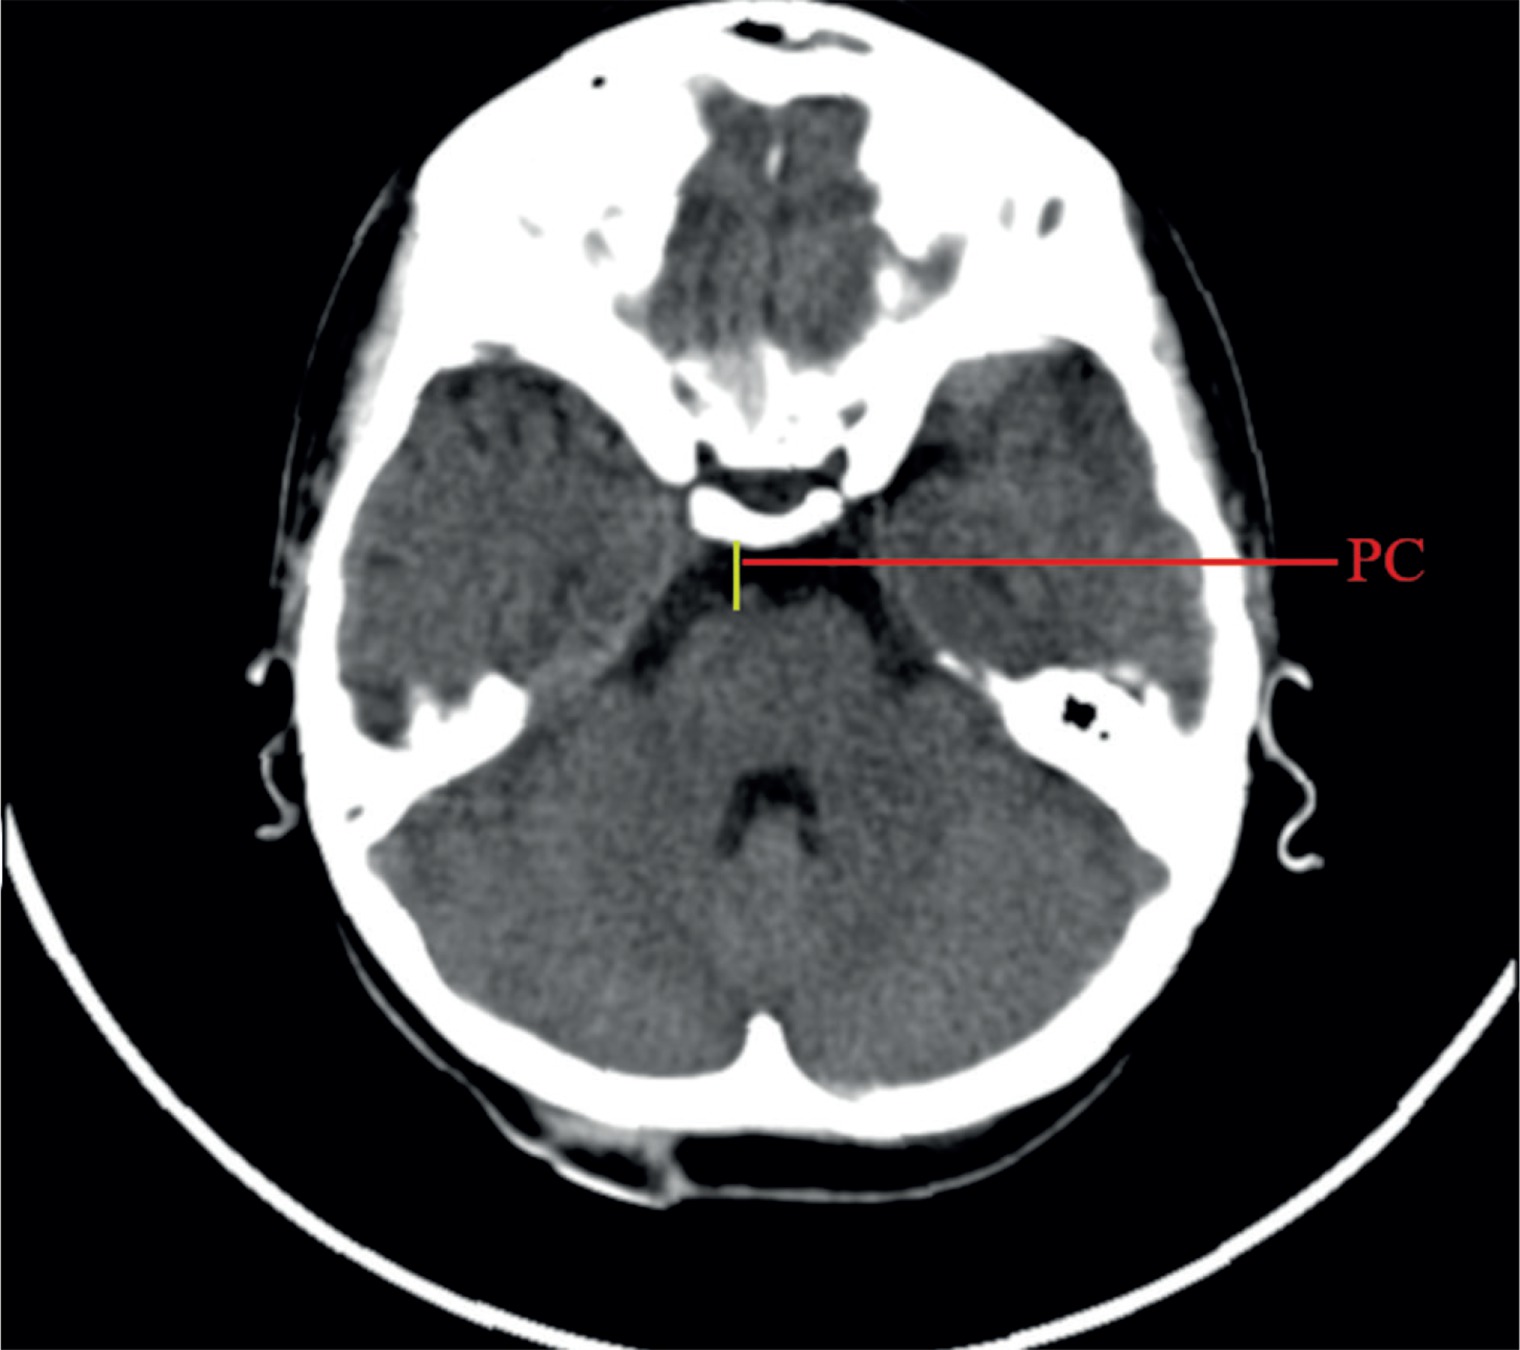
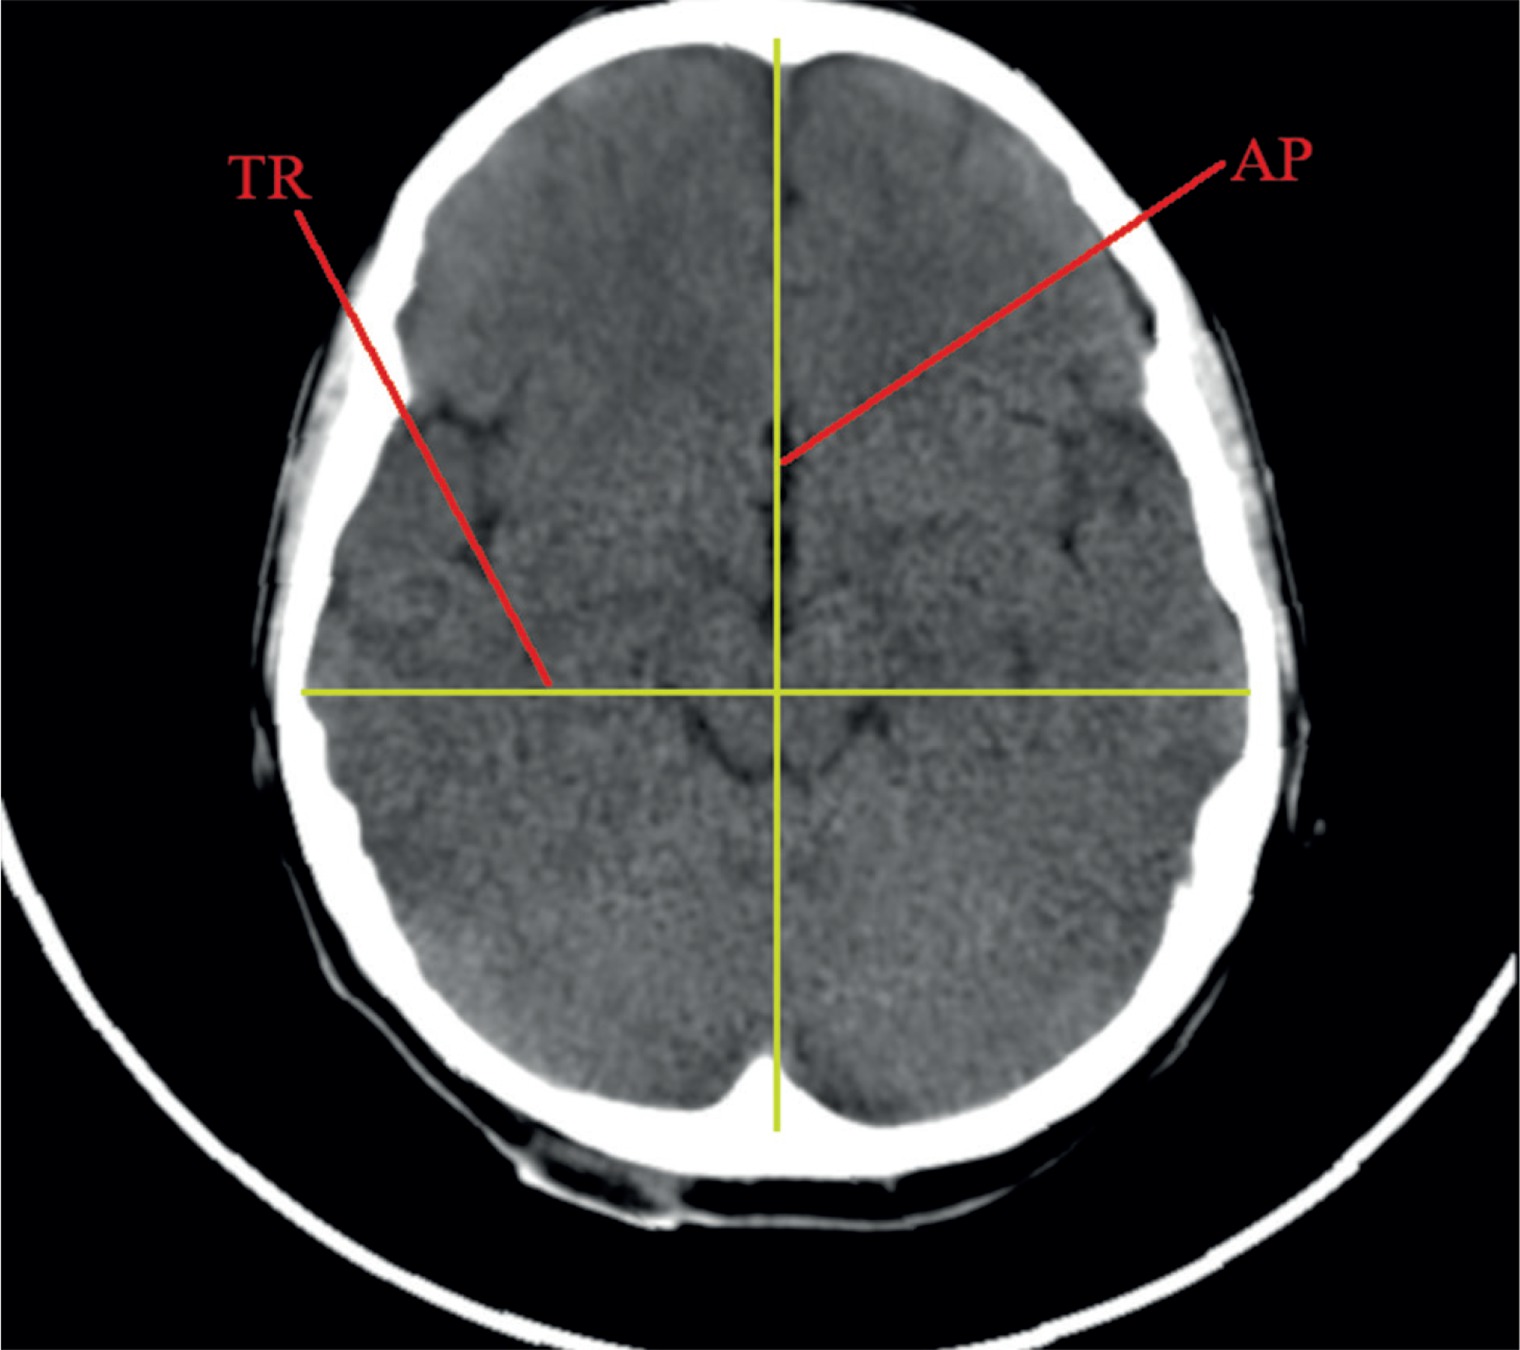
Linear dimensions measured included the following: maximum width of the interhemispheric fissure (IHF) (Figure 1), maximum sagittal dimension of the subarachnoid space at the level of the frontal squama measured on the right (RSS) and on the left (LSS) side, maximum width of the insular cistern measured on the right (RIC) and on the left (LIC) side, maximum sagittal dimension of the Sylvian fissure measured on the right (RSF) and on the left (LSF) side (Figure 1), maximum transverse dimension of the basal cistern (BCTR), maximum sagittal dimension of the basal cistern (BCAP) (Figure 2), maximum sagittal dimension of the prepontine cistern (PC) (Figure 3), maximum transverse internal diameter of the skull (TR), and maximum sagittal internal diameter of the skull (AP) (Figure 4).
Figure 1
Measurements of the subarachnoid spaces: left and right subarachnoid space (LSS, RSS), interhemispheric fissure (IHF), left and right insular cistern (RIC, LIC), left and right Sylvian fissure (RSF, LSF)

Figure 2
Measurements of the basal cistern: transverse and sagittal dimensions of the basal cistern (BCTR, BCAP)
On the basis of the measurements, linear indices were calculated describing the size of the subarachnoid space and subarachnoid cisterns in relation to the size of the skull. The obtained linear indices are presented in Table 1.
Table 1
Linear indices describing the size of fluid spaces, calculated on the basis of measurements
After calculating linear indices, children were divided into age groups, taking into account significant developmental changes that can affect the skull and the central nervous system at different ages. Taking into account the above information, the following seven age groups were created: 0-12 months (Group I, n = 51/Group II, n = 33), > 12-36 months (Group I, n = 33/Group II, n = 17), > 3-6 years (Group I, n = 45/Group II, n = 12), > 6-9 years (Group I, n = 64/Group II, n = 18), > 9-12 years (Group I, n = 68/Group II, n = 20), > 12-15 years (Group I, n = 63/Group II, n = 15), > 15-18 years (Group I, n = 57/Group II, n = 10).
Statistical analysis
To illustrate the changes to which linear indices are subject with age, the Pearson correlation indices r(x, y) were calculated. The following values were calculated for each linear index: mean, standard deviation (SD), median value (2 quartile), and 10th and 90th percentile. Values between the 10th and 90th percentile obtained in Group I were defined as reference values. The obtained mean values together with confidence levels in Group I and II are presented in diagrams. Changes in parameter values were compared between the age groups of healthy children.
Prior to the application of tests to assess the significance of differences between the studied groups, the assumptions required for parametric tests were checked. The compliance of the empirical distribution of the studied variables with the normal distribution was assessed using the Kolmogorov-Smirnov test. Uniformity of variance was assessed using the Levene test. When the data did not correspond to the normal distribution, the data was normalised. The Box-Cox transformation was used for this purpose. Intra-group comparisons were made using the ANOVA test, followed by the Spjotvoll-Stoline test. In the absence of normal distribution, the Mann-Whitney U test and Kruskal-Wallis test were used for further analysis.
Results
Direct linear dimensions
For the direct linear dimensions the correlation indices with age were calculated.
All analysed correlations of linear measurements were statistically significant with the child’s age. The increase in the linear dimensions of the fluid spaces with the child’s age was noted for transverse (BCTR) and sagittal (BCAP) dimensions of the basal cistern and the sagittal dimension of the pontine cistern (PC). The above mentioned dimensions showed a positive, weak, but statistically significant correlation with the child’s age (respectively: r(x, y) = 0.23; r(x, y) = 0.29; r(x, y) = 0.30). For the purposes of this study, longitudinal (AP) and transverse (TR) dimensions of the skull were measured, which describe the size of the skull itself. These dimensions were measured based on anatomical points of the skull, hence they showed a direct strong correlation with the age of the child, due to the increase in the skull size (respectively: r(x, y) = 0.62; r(x, y) = 0.57).
A decrease in size with the age of the child was noted for all measured dimensions of the subarachnoid space: the interhemispheric fissure width (IHF), the right (RSF) and left (LSF) dimension of Sylvian fissure, the right (RIC) and left (LIC) width of the insular cistern, and the right (RSS) and left (LSS) sagittal dimension of the subarachnoid space adjacent to the frontal squama. However, the negative correlation indices were weak, r(x, y) < 0.3. The highest negative correlation index with age was noted for the RSS and LSS dimensions.
Indices calculated for the subarachnoid space and subarachnoid cisterns
Index of basal cistern size to the size of the skull, (BCTR+BCAP)/(TR + AP)
The calculated index’s reference values are presented in Table 2. The distribution of mean values obtained in Group I and II are presented in Figure 5.
Table 2
The reference values of index of basal cistern size to the size of the skull. Group I. 10th-90th percentile – reference values, median, mean ± standard deviation (SD)
Figure 5
Mean values distribution of the basal cistern size index to the size of the skull in particular age groups – Group I (from 0-12 m (n) to 15-18 y (n)) and Group II (from 0-12 m (ab) to 15-18 y (ab)), with confidence levels for each group

Analysing changes in the index value in individual age groups, it was noted that the highest reference values were noted for the group of the youngest children up to one year of age. Statistically significant negative correlations of the described index with age were found (r[x, y] = –0.27). Negative statistically significant correlations of the described coefficient were found with the age of the child (r[x, y] = –0.27). Differences in the size of the index between age groups in relation to the youngest group were statistically significant: > 12-36 months (p = 0.04), > 3-6 years (p = 0.001), > 6-9 years (p = 0.002), > 9-12 years (p = 0.002), > 12-15 years (p = 0.001), and > 15-18 years (p = 0.02), respectively. The value of the index decreased statistically significantly with the age of the child during the first six years of life. Statistically significant differences in size of the parameter between the age groups of children > 12-36 months and > 3-6 years (p = 0.0005) were found. In the age group > 6-12 years, the index was maintained at a relatively constant level, was reduced in children up to the age of 15 years (p = 0.0182), and returned to the same level as in the group > 9-12 years in the group of the oldest children (p = 0.0224). The lowest value of the index was noted in the age group > 12-15 years.
Index of basal cistern transverse dimension to the size of the skull, BCTR/TR
The calculated index’s reference values are presented in Table 3. The distribution of mean values obtained in Group I and II is presented in Figure 6.
Table 3
The reference values of basal cistern transverse dimension index to the size of the skull. Group I – 10th-90th percentile – reference values, median, mean ± standard deviation (SD)
Figure 6
Mean values distribution of the basal cistern transverse dimension index to the size of the skull, in particular age groups – Group I (from 0-12 m (n) to 15-18 y (n)) and Group II (from 0-12 m (ab) to 15-18 y (ab)) with confidence levels for each group
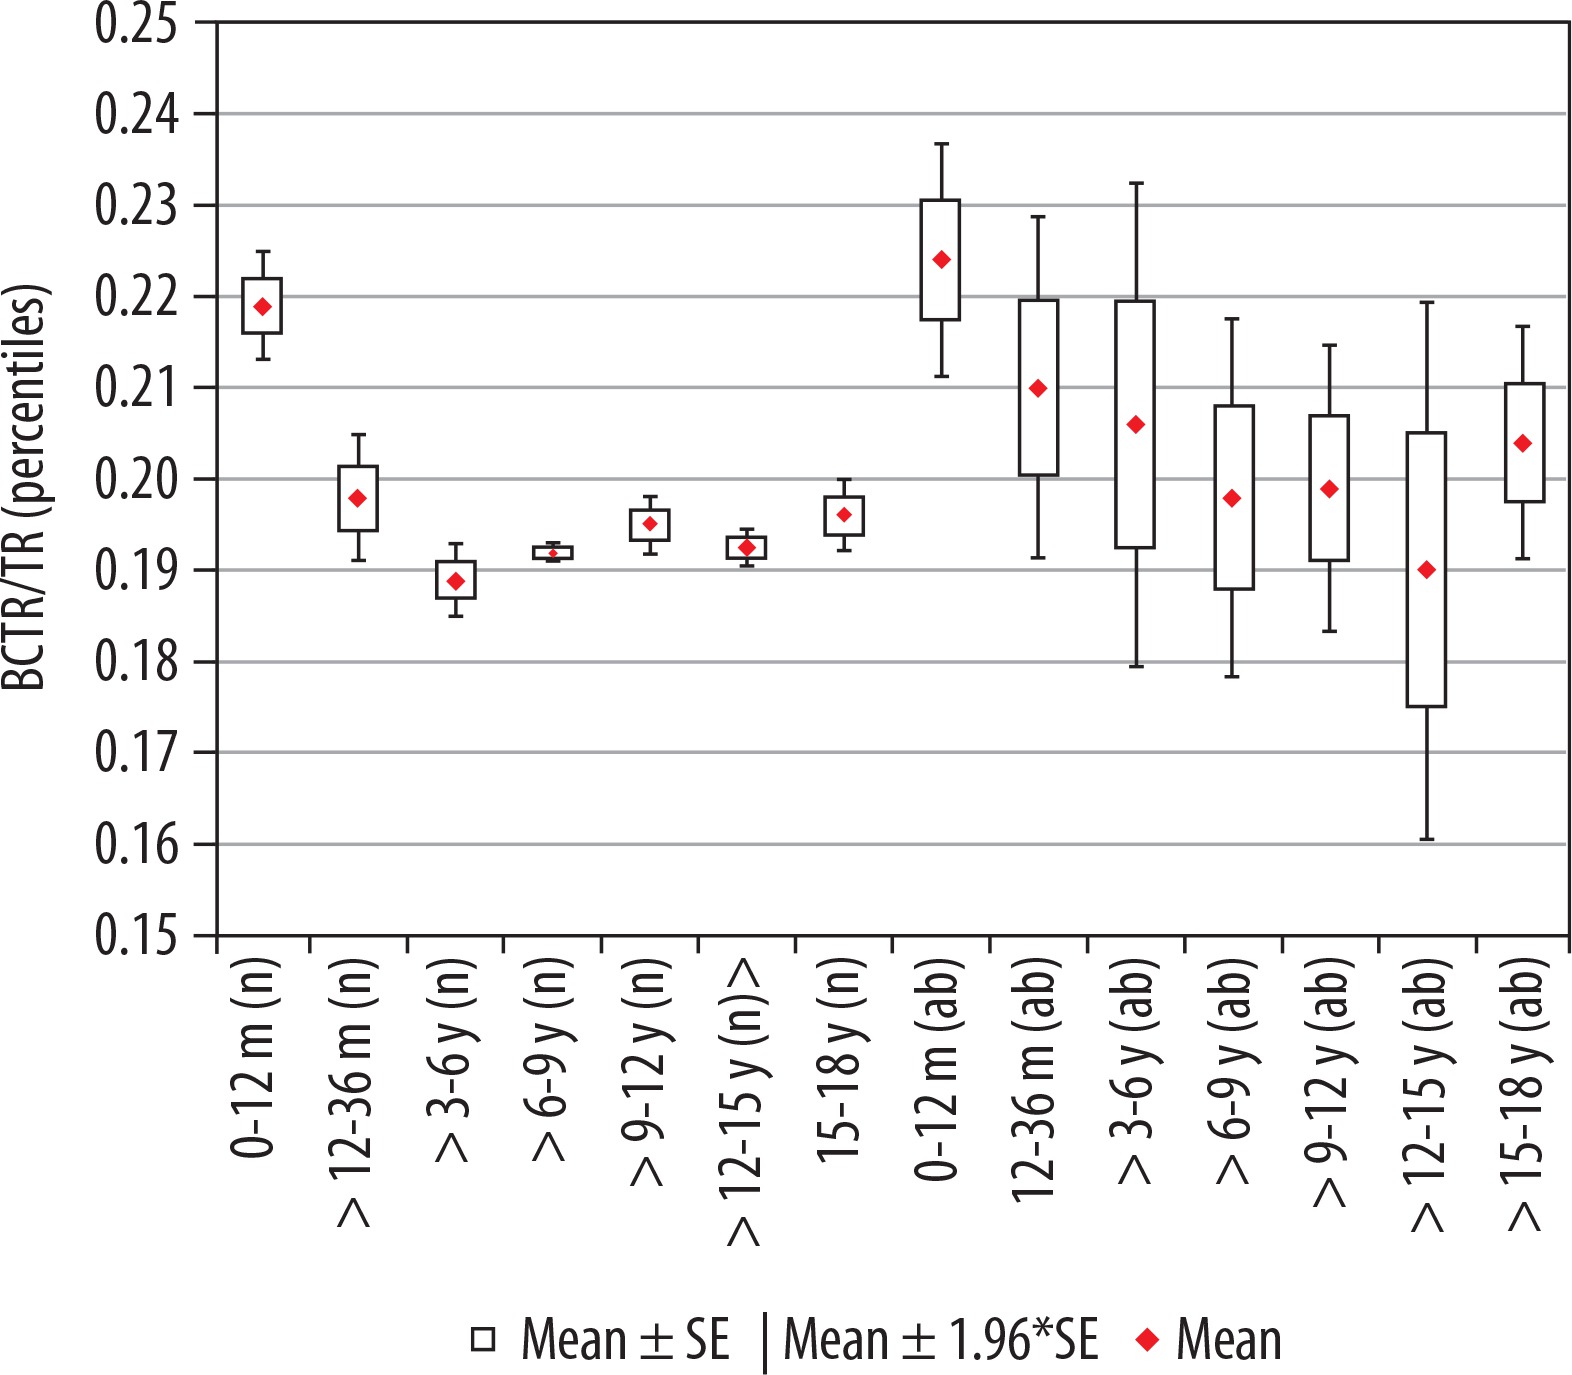
The highest mean value of the index was noted for children in the youngest group, up to 12 months of age. The size of the index showed a negative statistically significant correlation with age (r[x, y] = –0.32). Statistical analysis showed that index value decreased statistically significantly up to six years of age. Comparing the value of index between the analysed age groups in relation to the group of the youngest children, statistically significant differences were recorded for all groups of children: > 12-36 months (p < 0.001 ), > 3-6 years (p < 0.001), > 6-9 years (p < 0.001), > 9-12 years (p < 0.001), > 12-15 years (p < 0.001), and > 15-18 years (p < 0.02). However, statistical analysis of the mean values of the coefficient between groups showed statistically significant differences between the groups of children > 12-36 months and > 3-6 years (p = 0.046). There were no statistically significant differences between the other age groups, which means that the value of the index remained stable up to 18 years of age (Figure 5). The lowest median value was recorded in the group > 3-6 years.
Index of basal cistern sagittal dimension to the size of the skull, BCAP/AP
The calculated index’s reference values are presented in Table 4. The comparison of mean values obtained in Group I and II is presented in Figure 7.
Table 4
The reference values of basal cistern sagittal dimension index to the size of the skull. Group I – 10th-90th percentile – reference values, median, mean ± standard deviation (SD)
Figure 7
Mean values distribution of the basal cistern sagittal dimension index to the size of the skull, in particular age groups - Group I (from 0-12 m (n) to 15-18 y (n)) and Group II (from 0-12 m (ab) to 15-18 y (ab)) with confidence levels for each group

Statistical analysis of the mean values of the parameter between age groups showed that the size of the index presented similar values, with the exception of the group of youngest children, up to 12 months of age, where the reference values were the highest. Slight negative correlation of the index with age (r[x, y] = –0.07) was noted. Initially up to the age of three years the index’s value decreased (p = 0.0172) and then remained at a similar level in children from age three to 15 years. There were statistically significant differences in the parameter size (increase in value) between the oldest children > 12-15 years and > 15-18 years (p = 0.047). The lowest median value was recorded in the group > 3-6 years.
Index of prepontine cistern, PC/AP
The calculated index’s reference values are presented in Table 5. The distribution of mean values obtained in Group I and II is presented in Figure 8.
Table 5
The reference values of prepontine cistern index to the size of the skull. Group I – 10th-90th percentile – reference values, median, mean ± standard deviation (SD)
Figure 8
Mean values distribution of the prepontine cistern index to the size of the skull, in particular age groups – Group I (from 0-12 m (n) to 15-18 y (n)) and Group II (from 0-12 m (ab) to 15-18 y (ab)) with confidence levels for each group
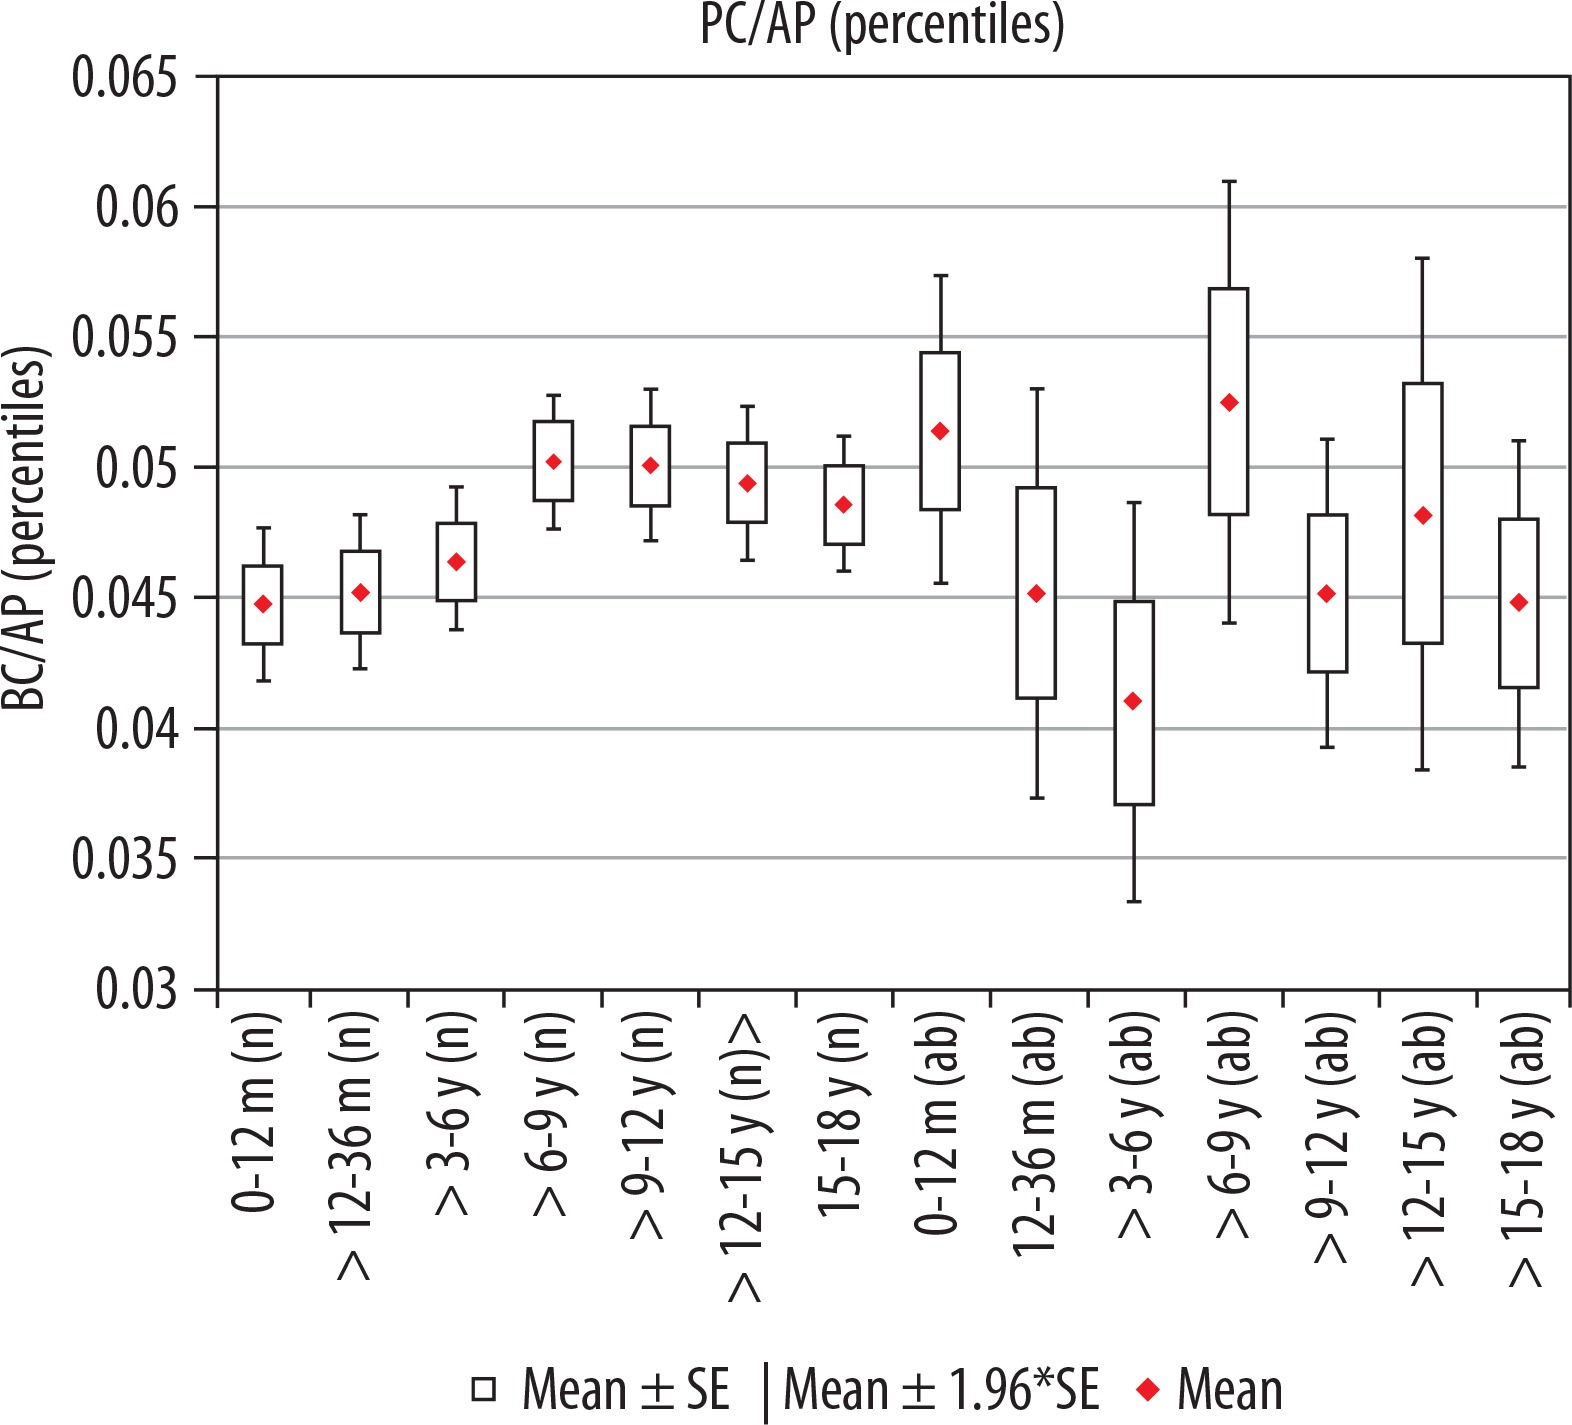
The average size of the transverse dimension of the pontine cistern showed similar values in individual age ranges, i.e. in children from the day of birth to the age of six years and then from 6-18 years of age. There was a statistically significant difference in the mean value of parameter between age groups > 3-6 years and > 6-9 years (p = 0.0429). An increase in the parameter value in children over six years of age was noted (Figure 4). The size of the index showed a weak positive correlation with age (r[x, y] = 0.17).
Index of interhemispheric fissure width, IHF/TR
The calculated index’s reference values are presented in Table 6. The distribution of mean values obtained in Group I and II is presented in Figure 9.
Table 6
The reference values of interhemispheric fissure width index to the size of the skull. Group I – 10th-90th percentile – reference values, median, mean ± standard deviation (SD)
Figure 9
Mean values distribution of the interhemispheric fissure width index to the size of the skull, in particular age groups – Group I (from 0-12 m (n) to 15-18 y (n)) and Group II (from 0-12 m (ab) to 15-18 y (ab)) with confidence levels for each group
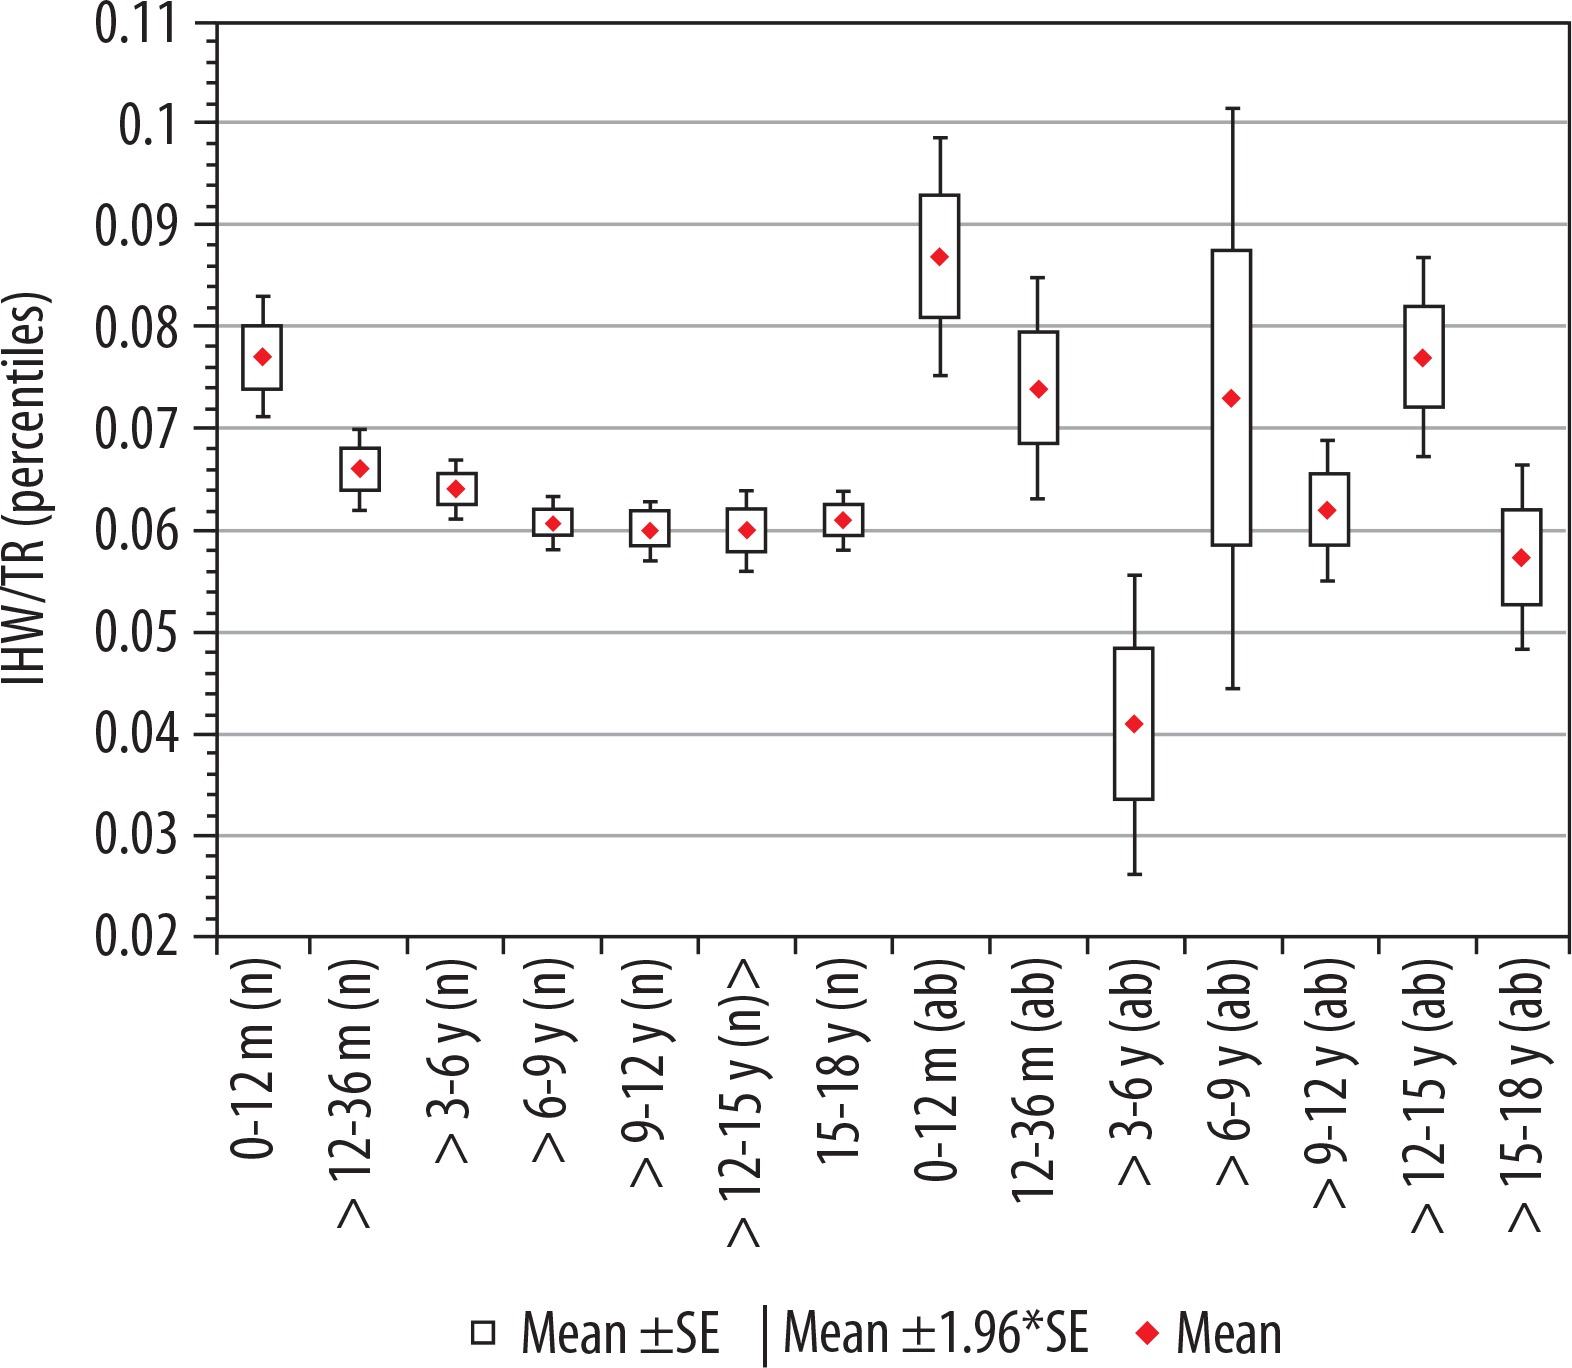
Statistical analysis of the interstitial gap index showed that the average value of the index remained at the same level, except for the group of youngest children, where the reference values were the highest.
There was a negative statistically significant correlation with age (r[x, y] = –0.38). Initially, up to 36 months of life, the value of the index decreased with age (p = 0.0162). Statistically significant changes were recorded between the group of age > 6-9 years (p = 0.003), > 9-12 years (p = 0.002), > 12-15 years (p = 0.003), and > 15-18 years (p = 0.005) in relation to the group of the youngest children up to 12 months of age. For the remaining age groups of children, after the first year of life, there were no statistically significant differences between the means from particular age groups. The lowest median value was noticed in the age group > 6-9 years.
Index of Sylvian fissure, ((RSF + LSF)/2)/AP
The calculated index’s reference values are presented in Table 7. The distribution of mean values obtained in Group I and II is presented in Figure 10.
Table 7
The reference values of sylvian fissure index to the size of the skull. Group I – 10th-90th percentile – reference values, median, mean ± standard deviation (SD)
Figure 10
Mean values distribution of the Sylvian fissure index to the size of the skull, in particular age groups – Group I (from 0-12 m (n) to 15-18 y (n)) and Group II (from 0-12 m (ab) to 15-18 y (ab)) with confidence levels for each group
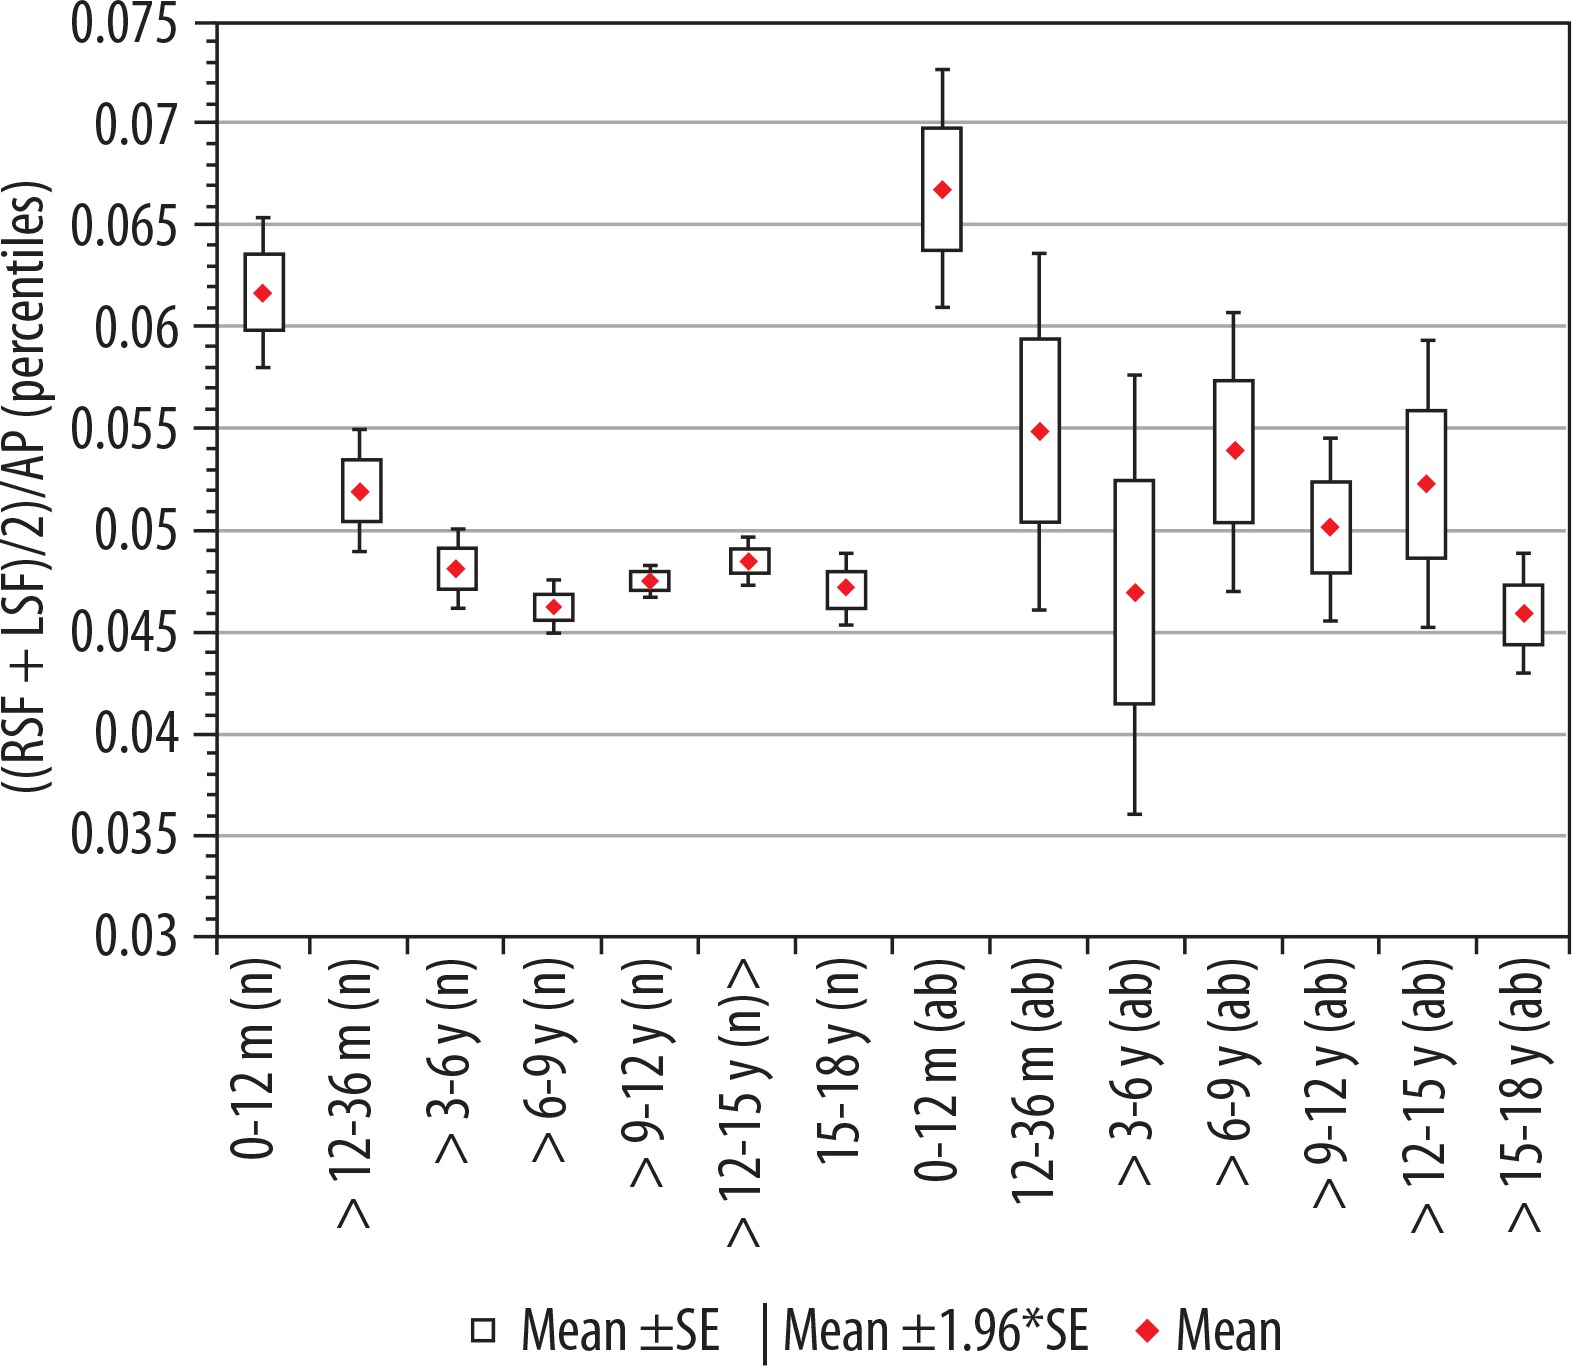
When analysing the values of the index of Sylvian fissure, it was shown that size of the index is characterised by similar values, except for the group of youngest children, where the reference values were the highest. A decrease in the value of the index in children up to 36 months of age was demonstrated (p = 0.0003). The analysis showed the existence of a negative statistically significant correlation with age (r[x, y] = –0.38). Above the age of three years, there were no statistically significant differences between the analysed age groups of children. In addition, there were statistically significant differences in the size of the parameter between the older age groups compared to the youngest group, respectively: > 12-36 months (p = 0.04), > 3-6 years (p = 0.001), > 6-9 years (p = 0.001), > 9-12 years (p = 0.001), > 12-15 years (p = 0.001), and > 15-18 years (p = 0.001). The lowest median value was recorded in the group > 6-9 years.
Index of insular cistern width, ((RIC + LIC)/2)/TR
The calculated index’s reference values are presented in Table 8. The distribution of mean values obtained in Group I and II is presented in Figure 11.
Table 8
The reference values of insular cistern width index to the size of the skull. Group I – 10th-90th percentile – reference values, median, mean ± standard deviation (SD)
Figure 11
Mean values distribution of the insular cistern width index to the size of the skull, in particular age groups – Group I (from 0-12 m [n] to 15-18 y [n]) and Group II (from 0-12 m [ab] to 15-18 y [ab]) with confidence levels for each group

The highest mean value of the index of insular cistern width was recorded for the youngest children up to 12 months of age. The size of the index indicated a statistically significant correlation with age (r[x, y] = –0.28). Statistical analysis showed that the value of the index decreased statistically significantly up to nine years of age. Comparing other age groups with the youngest group of age, there were statistically significant differences between groups of children > 12-36 months and > 3-6 years (p = 0.0038); > 3-6 years and > 6-9 years (p < 0.001). However, between group 0-12 months and > 12-36 months the difference between the mean values of the parameter did not reach statistical significance (p = 0.0054). In the range > 6-15 years, the value of the index maintained at a constant level and then increase in the oldest group (p < 0.001) (Figure 7). The lowest median value was recorded in the group of children > 3-6 years.
Index of subarachnoid space, ((RSS + LSS)/2)/AP
The calculated index’s reference values are presented in Table 9. The distribution of mean values obtained in Group I and II is presented in Figure 12.
Table 9
The reference values of insular cistern width index to the size of the skull. Group I – 10th-90th percentile – reference values, median, mean ± standard deviation (SD)
Figure 12
Mean values distribution of the insular cistern width index to the size of the skull, in particular age groups – Group I (from 0-12 m (n) to 15-18 y (n)) and Group II (from 0-12 m (ab) to 15-18 y (ab)) with confidence levels for each group
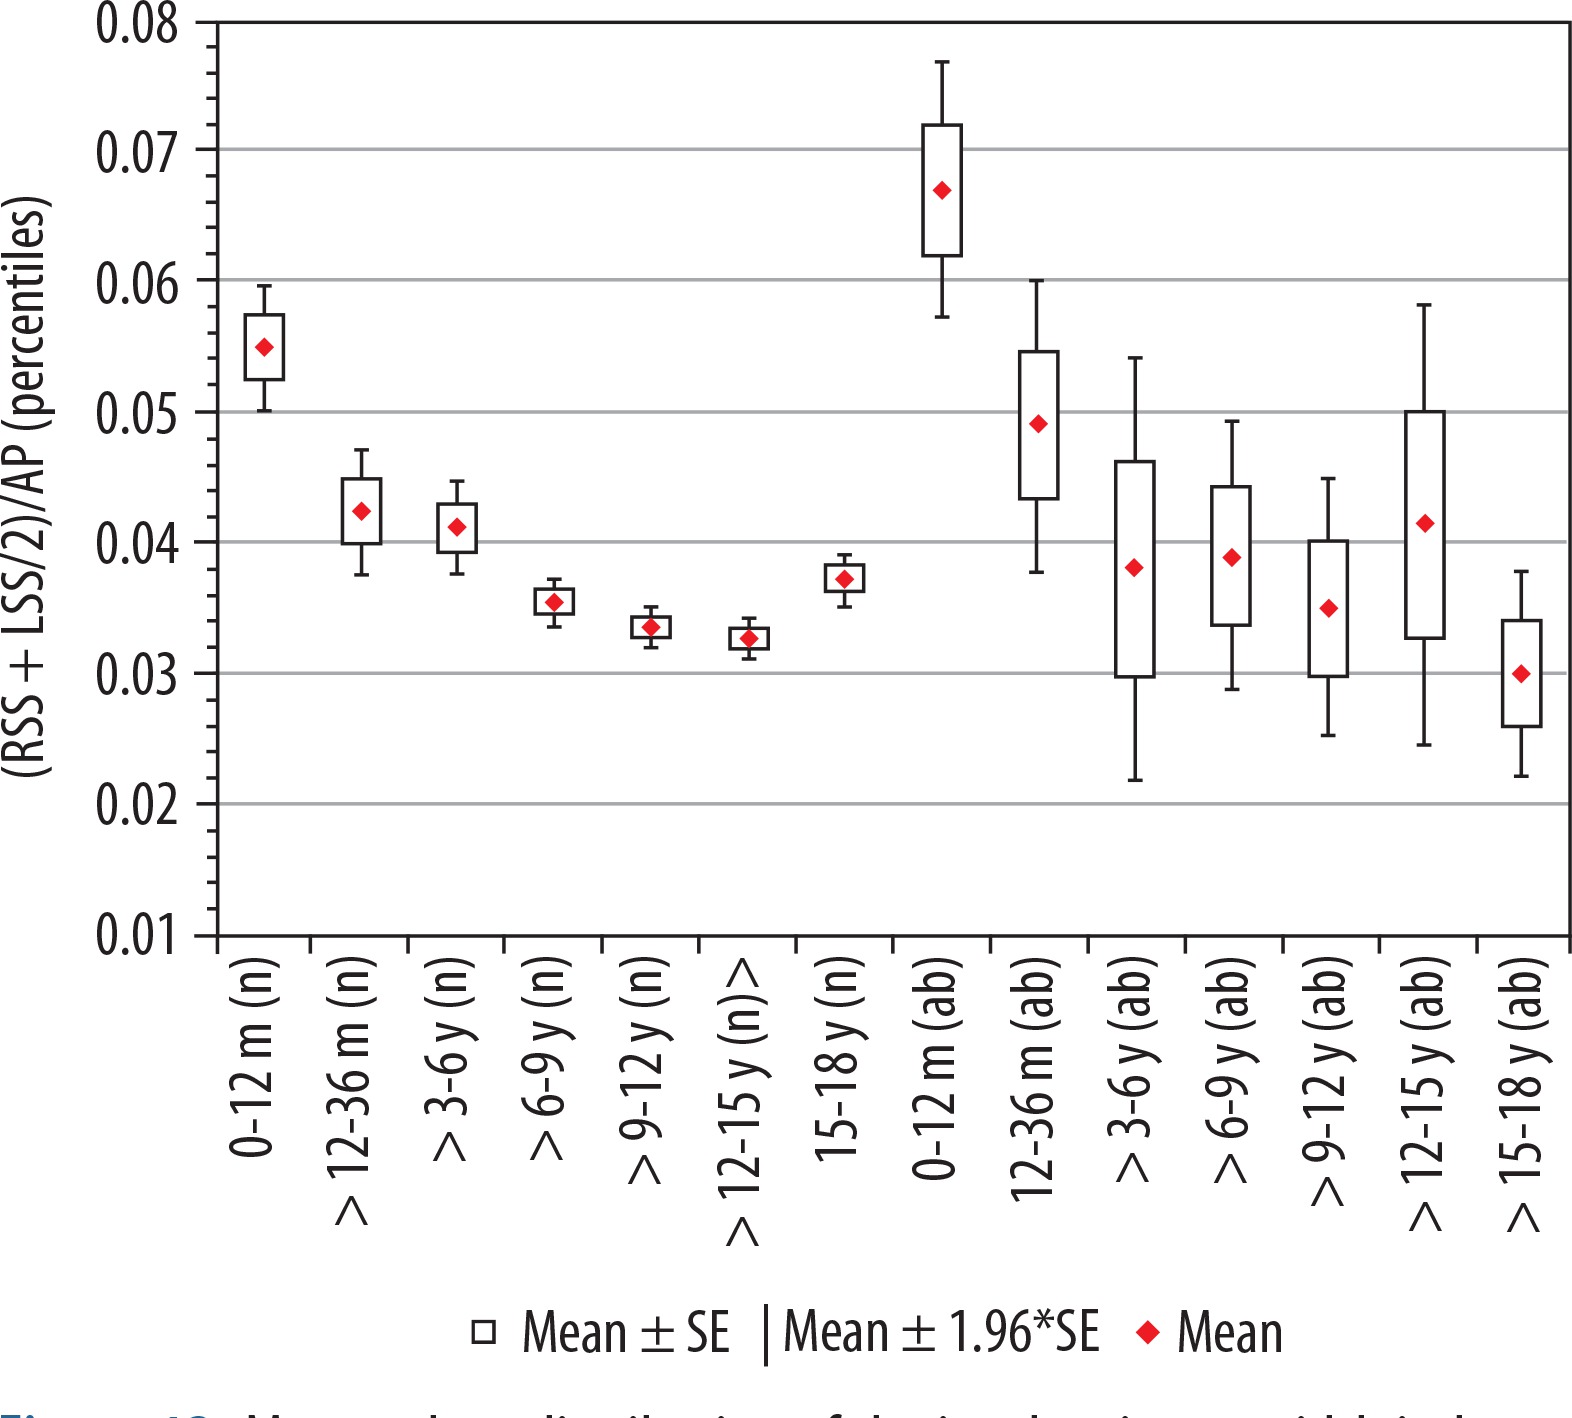
The mean value of the index of subarachnoid space showed a decrease of its mean values initially until six years old then over six to 15 years old. There were two statistically significant changes in the space size between age groups: 0-12 months and > 12-36 months (p = 0.0042) and groups > 3-6 and > 6-9 years (p = 0.034) (Figure 11). For the remaining age groups over nine years old, there were no statistically significant differences between the groups. In the group of youngest children, the reference values were the highest. The size of index showed a negative average correlation with age (r[x, y] = –0.42). Changes in the parameter value between individual age groups in relation to the youngest group 0-12 months showed statistical significance > 12-36 months (p < 0.01), > 3-6 years (p < 0.01), > 6-9 years (p < 0.001), > 9-12 years (p < 0.001), > 12-15 years (p < 0.001), and > 15-18 years (p < 0.001).
Discussion
Information about changes in the volume of the subarachnoid space is very important and can be a sign of the developing disease process that causes cerebrospinal fluid flow disorders. Many changes may result from developmental problems and disappear with the growth of the child. To facilitate the assessment of intracranial fluid spaces, it has become necessary to create reference values defining the norms of their correct dimensions. The creation of centile charts would require a much larger research group. The method of mean and standard deviations requires the use of numerous standardisation methods so that the resulting distribution of results is as close as possible to the normal distribution. For the purposes of this work, the most reasonable method was to obtain reference values based on percentiles. Within a given norm determined by appropriate percentile values (10th-90th percentile), we obtain additional ranges (25th, 50th, 25th percentile) that allow us to determine which reference line the obtained result is closer to. It is specified that the value of the 50th percentile, or median, means the average value of the growth of the population studied. The range between 10th and 90th percentiles is clinically accepted as a certain norm. Krawczyński proposed additionally taking into account the values between third and 10th percentile and 90th and 97th percentile, which are considered to be a borderline of the norm, i.e. observation zone, indicating the need for further diagnostics or repeating the test after a specified time. These values coincide with the range of six standard deviations from the mean (mean ± 3 SD) [13,14]. However, in most cases, researchers only take into account the values of the 10th-90th percentile as a norm, hence the authors have also designated only those ranges for the purpose of this work. For the development of reference values for the fluid space indices in healthy children, the values from Group I were used. The research was based on linear indices used to assess intracranial volumes of fluid spaces found in the literature, but with some modifications. In addition, in some cases new indices not used so far were created.
In the case of indices used to describe the size of the basal cisterns the index of the basal cistern size to the size of the skull (BCTR + BCAP)/(TR + AP), which is the only one that can be directly compared with the literature data, the normative values were similar to those presented in our work; the values presented by Prassopoulos and Cavouras [9] are mean values and do not represent possible ranges that should be taken into account in the diagnosis of hydrocephalus. Available reference values derived from the literature [10] obtained in younger age groups, from 0 to 36 months, are in our case lower than those presented. In the case of the last four indices, data available in the literature indicate that the basal cistern and the prepontine cistern show greater dimensions during the first year compared to the second year of life, and all fluid spaces show a steady increase in children between four and 14 years of age [9]. In our studies, the significantly higher values for all indices used to describe the basal cistern in the first year of life, compared to the second year, were observed. Their diameters decreased until about six years of age and then slightly increased and remained at a similar level. For the index of basal cistern transverse dimension (BCTR/TR) a statistically significant decrease in values was found in the groups from 0 to 36 months. For the basal cistern index to the size of the skull (BCTR + BCAP)/(TR + AP) and the index of basal cistern sagittal dimension (BCAP/AP) statistical differences were also found in the oldest groups > 12-15 and > 15-18 years, which may indicate developmental changes in the skull characteristic for puberty. Similar changes are described in the literature showing a decrease in the index size in the age groups of nine to 11 years, then an increase in groups of 12 to 14 years, and a further decrease in groups of 14 to 15 years; above this age, the changes have not been studied [9].
In all cases, the highest values were found in the youngest age group, 0-12 m, and in other groups the dimensions of the space decreased. Only in the oldest group of > 15-18 years the size of the space increased slightly. The largest dynamics of changes in mean values of the parameter were described for the basal cistern index in relation to the size of the skull. With the exception of the pontine cistern, values of which were different, showing lower values in the group of youngest children and then an increase in groups from 0 to 12 years, showing the highest values in the group > 9-12 years then slightly decreased between 12 and 15 years and a slight increase in the oldest age group > 15-18 years. Statistically significant changes in this parameter were observed between groups > 3-6 years and > 6-9 years; for the remaining intervals there were no statistically significant changes. Differences in the obtained results between literature data may in this last case result from the use of another method of creating the index. The direct value of the measurement was divided only by the largest sagittal dimension of the skull and not the sum of internal dimensions.
Referring to the factors describing the size of the subarachnoid space, Lam et al. [15] in ultrasound examinations carried out on 278 infants found that the normative values of this space range from 0.3 to 0.6 cm measured around the frontal lobes. In addition, they found that the width of the subarachnoid space in children increased with age and reached a maximum at about 28 weeks of age (seven months). After this time, the dimensions of the subarachnoid space decreased. However, these data came from the direct measurements, so it was difficult to refer them to the indices currently described. In our work most indices describing the subarachnoid space were the largest in the youngest group from 0-12 months and then decreased in size.
In the study of the subarachnoid space based on CT studies, Kleinman et al. [16] described the enlargement of the subarachnoid space during infancy, indicating that in the case of basal cisterns and cortical grooves, this enlargement was more frequent in children between six and 12 months of age. Spaces were increasing until about two years of age, and above this age they reached values characteristic for older children and young adults; above this age the values did not change. In the presented studies, the values of the majority of indices decreased with the age of the child in the group > 12-36 months but also in older groups: > 3-6 years and > 6-9 years.
However, for the index of the interhemispheric width and the Sylvian fissure dimension, differences in the size of indices were noted only between the groups of the youngest children 0-12 months and > 12-36 months. For the remaining age groups, there were no statistically significant differences and the values of indices were maintained at a relatively stable level up to 18 years of age.
Alvarez et al. [17] suggested that external hydrocephalus in infants was usually a causeless disease appearing in children with open cranial sutures and disappearing gradually from 18 to 24 months of age. Maytal et al. [18] diagnosed 74 infants and described the widening of both frontal subarachnoid spaces and the interhemispheric fissure in the anterior portion, with a slight dilatation of other fluid spaces. In these studies, it was suggested that external hydrocephalus was an individual variable, age-dependent disease, and subarachnoid dilatation was the variability of the developing brain where cerebrospinal fluid accumulates in the frontal region. Thus, occurring in younger children under two years of age, widening of the subarachnoid space, especially within the interhemispheric brain fissure and the space adjacent to the frontal bone, may be the result of such changes. The indices presented in our work, concerning these spaces showed a decrease in their values in children of age groups from 0-6 years, and in the case of space adjacent to the frontal squama also in older children up to 15 years of age. In the oldest group, a slight increase was observed.
In the study of subarachnoid space using the linear indices method, carried out by Prassopoulos et al. [10], a large dependence of their size on the head size was found, especially in children under the age of three years compared to older children. The measurements showed that the indices concerning the majority of extra-axial fluid spaces, except for the space around the insular cortex and the prepontine cistern, indicated statistically significant differences between the youngest groups of children 0-12 months and > 12-36 months.
Research regarding the extension of fluid spaces is currently being conducted mainly to facilitate the diagnosis of benign enlargement of subarachnoid space (BESS), also referred to as benign external hydrocephalus, and to differentiate it from classical external hydrocephalus and chronic subdural haematoma occurring in children with an enlarged head circumference. BESS does not show any clinical symptoms except for the enlargement of the head circumference; however, even if this symptom is not present, it cannot be ruled out. The characteristic symptoms in this case is the widening of the subarachnoid space without widening the ventricular system, but there may be widened subarachnoid cisterns with disturbances of cerebrospinal fluid absorption. In children under the age of two years with macrocephaly, this type of disorder may account for about 50-60% of cases [19, 20]. Above this age, it should gradually recede, but this is not always the rule [20]. It is also worth mentioning that this deformation promotes the accumulation of cerebrospinal fluid also in the subdural space and the formation of subdural haematomas. In children with BESS, spontaneous or caused by a slight injury, the formation of subdural haematomas is more likely due to the stretching of veins located in the subdural space during the widening of the subarachnoid space.
In a study by Hussain et al. [21], involving assessment of the subarachnoid space around the frontal squama and the interhemispheric fissure of the brain with normative values creation, it was shown that the disease is not easy to diagnose. The space sizes measured directly in the MR images as well as presented as linear indices taking into account the dimensions of the skull, obtained in the group of healthy children and those diagnosed with BESS, may overlap to some extent. Widening of the subarachnoid space also appears in children with type I glutaric aciduria, but with accompanying clinical symptoms in the form of developmental delay [22].
In some cases, the presence of fluid in the subdural space and, above all, subdural haematomas are associated with possible symptoms of abuse, but due to the predisposition described earlier, this should not be the only criterion for its confirmation [2].
The external hydrocephalus can be another disease, in the diagnostics of which the presented results can be used. It is usually caused by the block or atrophy of arachnoid villi, which makes the outflow of the cerebrospinal fluid into the venous system impossible. In this situation the widening of subarachnoid space appears, and sometimes the widening of ventricles too. As an additional symptom the accumulation of cerebrospinal fluid in the subdural space is present. In diagnostics of external hydrocephalus, it is important to distinguish the subarachnoid space enlargement from accumulation of the fluid in the subdural space, which is also characteristic for brain atrophy, but in the latter case the space enlargement is visible adjacent to both the frontal and occipital squama.
The accumulation of fluid in the subdural space is also characteristic of bacterial brain infections and injuries [20]. According to a different theory, arachnoid granulations are not the main route of cerebrospinal fluid outflow, because most of the fluid drains through the venous capillary vessels and through the extracranial lymphatic system of the head [23].
In infants diagnosed with external hydrocephalus, MRI scans also showed constrictions present in the dural sinuses, and their number was proportional to the volume of accumulating fluid in the subarachnoid space [24].
In studies of CSF composition taken from different parts of intracranial fluid spaces, there were differences in protein content between CSF in ventricles and subarachnoid space, where protein concentration was two-times higher. This was confirmed by a stronger proton density signal (PD) obtained from CSF in subarachnoid space in children, compared to CSF in the ventricles. The protein came from the endothelium capillaries, which was the result of the immaturity of the blood CSF barrier, enabling the passage of large molecules such as proteins in the neonatal period, but it is not certain for how long. Therefore, it is likely that the subarachnoid space enlargement in children may last longer than the first two years of life, which is why presented reference values can better illustrate the changes in this system occurring in children of different ages [25].
Studies conducted in children and adults with autism spectrum disorder (ASD) indicated an enlargement of the head circumference observed in all subjects. A more accurate analysis using MRI study showed a smaller brain volume and extending extracerebral fluid spaces in these patients compared to a control group of similar age. In infants widening of the subarachnoid space may be a factor allowing for earlier diagnosis of ASD than in the ordinary procedure, usually above 18 months of age [26,27]. It was found that in children diagnosed at the age of six months in terms of autism, in whom both an enlarged subarachnoid space and cerebrospinal fluid accumulation were noted, the probability of its symptoms was much higher. In addition, the longer this enlargement persisted as the child developed, the more serious was the form of ASD diagnosed later [28]. Knowledge of reference values that are characteristic of particular age groups would facilitate the entire diagnostic process. In adults, the changes in size of the subarachnoid space are closely related to various disease syndromes; however, their assessment is also especially important in the elderly.
In the case of idiopathic normal pressure hydrocephalus (iNPH), the narrowing of the subarachnoid space around the cerebral convexities, and at the same time the widening of the space near Sylvian fissure, may be its first symptom, even before the enlargement of the ventricular system [29]. This was confirmed by the work of Yamada et al. [7] in which the characteristic narrowing of the subarachnoid space near the frontal squama and widening of the Sylvian fissure and subarachnoid cisterns at the base of the brain allowed the symptoms characteristic of idiopathic hydrocephalus described above to be distinguished from the symptoms of sNPH in which the narrowing of subarachnoid space was present in all those points. As shown, the development of reference values for the size of the subarachnoid space, even in the case of adults, would be a significant facilitation in hydrocephalus assessment. In our work, results from the group > 15-18 years could meet this criterion because above this age the head does not change its size. Currently, methods are being sought for automatic assessment of the size of the subarachnoid space to facilitate and accelerate the diagnosis process of iNPH and to eliminate errors resulting from the human factor [8].
Conclusions
The indices we present can be calculated based on images achieved during routine CT examination in children of all ages.
The reference values we developed allow us to determine if the size of the subarachnoid space is within the normal range for a given age group, both in the case of narrowing and widening of the subarachnoid space.
Indices can also be used to determine whether a child should be in the so-called observation group, whose development needs to be monitored.
Values from the oldest age group can also be referred to the results obtained in adults.