


Introduction
The plantar fascia (PF) is a thick band of connective tissue which supports the arch of the foot. It also plays an important role in the biomechanics of the foot [1]. Diabetes mellitus is a chronic disorder characterized by metabolic abnormalities, and diabetes-related hyperglycaemia is said to promote non-enzymatic glycation of proteins. It has been postulated that these glycosylated end-products accumulate in various human tissues including tendons and ligaments [2]. The alterations induced by hyperglycaemia are said to result in modification of gait, and the consequent changes in foot mechanics may contribute to the onset of diabetic foot [3]. Several studies have reported an increase in PF thickness in patients with type 2 DM [3-7].
The elastographic properties of various solid organs have been extensively studied. However, application of elastography in the study of the musculoskeletal system has gained momentum recently [8]. Strain elastography, which involves application of manual compression on the tissue in the direction of an ultrasound beam, has previously been used for the evaluation of PF for disorders such as plantar fasciitis, but DM-related changes have not been studied so far [9,10]. Because diabetic foot is a dreaded complication of DM, elastography could potentially play a role in early detection of changes in mechanical properties of the PF. These alterations have been postulated to lead to the development of foot ulcers, the early detection of which could aid in their prevention [11,12]. The present study evaluates the greyscale abnormalities of the PF such as thickening and alterations in echo-pattern in diabetics along with changes in elastic properties using strain elastography.
Material and methods
A cross sectional study was conducted in our institution over a period of one year, after approval by the institutional Ethics Committee. The study included 81 adult patients (41 males and 40 females) with type 2 diabetes mellitus and 32 adult healthy volunteers (20 males and 12 females) without diabetes mellitus. Informed consent was obtained from all study subjects. Clinical details of the patients such as age, sex, duration of diabetes, presence of numbness, tingling, and loss of sensation in the foot suggestive of peripheral neuropathy (PN), and presence of foot ulcers were noted. Random blood sugar (RBS) and HbA1c levels were recorded in all patients. Healthy volunteers with no family history of diabetes and with normal RBS values within the past year were included in the study. Exclusion criteria for both healthy volunteers and patients included positive history for foot trauma, foot surgery, local or systemic treatments with steroids, arthritis, and acromegaly.
The greyscale ultrasound examination of patients/healthy volunteers was performed on a Philips IU22 Ultrasound Machine (Philips Healthcare, WA, USA) using a high-frequency linear array transducer (5-17 MHz). PF was assessed with the patient lying prone and feet hanging free in a neutral position over the end of the examination table. An adequate amount of ultrasound coupling gel was used. Care was taken to ensure that the ultrasound beam was perpendicular to the PF to avoid anisotropy. Alterations in the echogenicity of the PF in the form of hypoechogenicity were noted. PF thickness (PFT) was registered 1 cm distal to the attachment at the calcaneus and the measurements were expressed in millimetres (Figure 1).
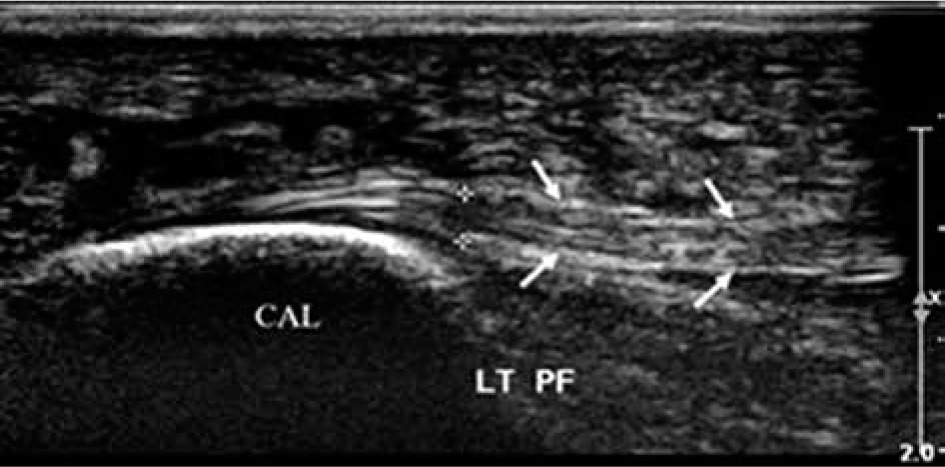
Figure 1
Longitudinal ultrasonographic images of the normal plantar fascia (arrows) of a 33-year-old female showing a hyperechoic striated appearance with proximal attachment to the calcaneus (CAL)
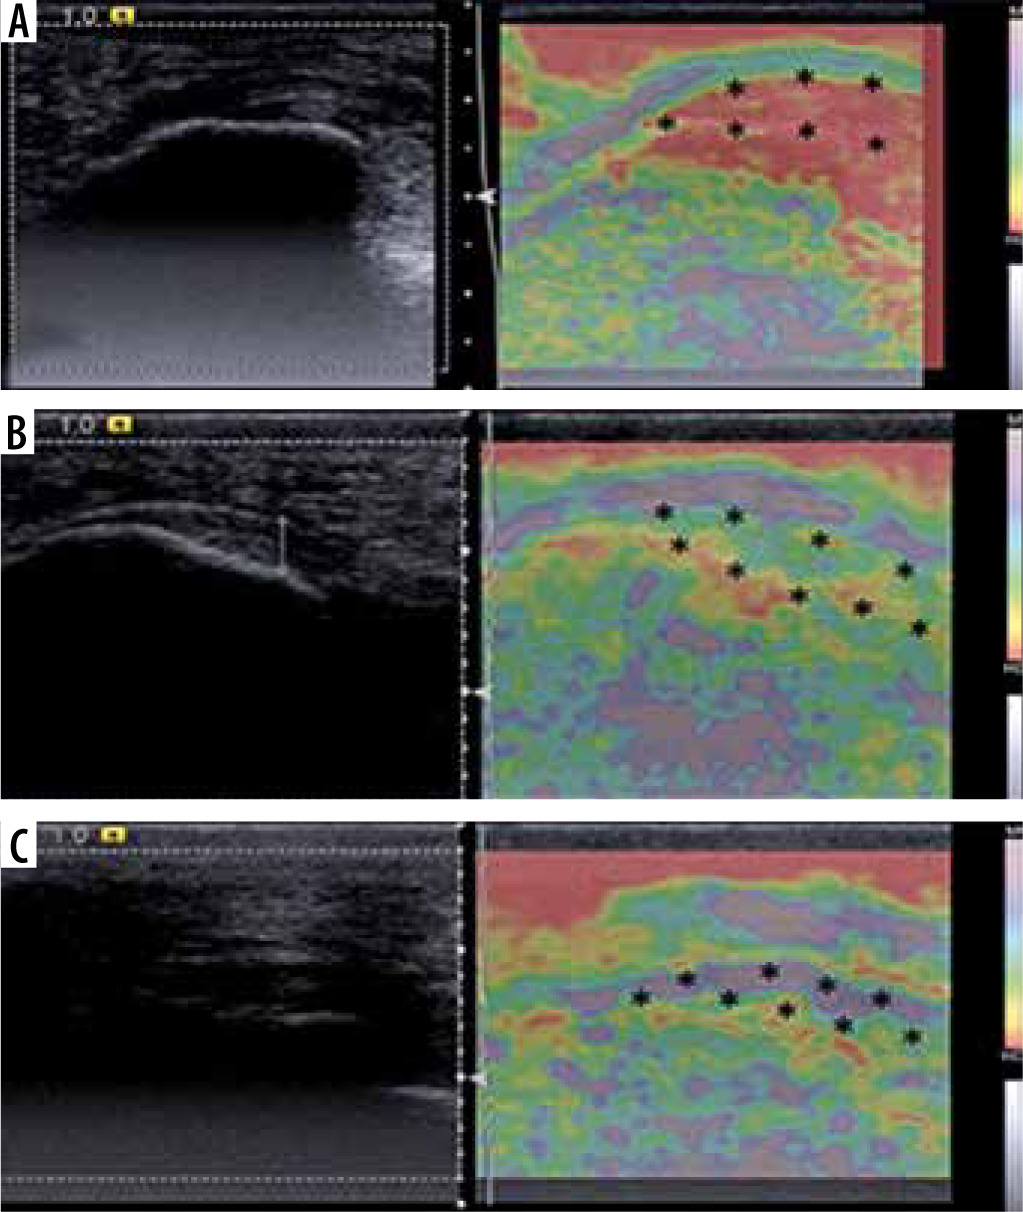
Strain elastography of the PF was performed in all 32 healthy volunteers and in 69 patients with diabetes on a Siemens ACUSON S2000 ultrasound system (Siemens Medical Solutions, Mountain View, California, USA) using a 4-9 MHz linear array transducer. The examinations were performed by a single radiologist with 3 years’ experience in musculoskeletal ultrasound elastography. The PF was assessed near its calcaneal insertion. Gentle compression was applied on the heel with a hand-held transducer. A quality factor equal to or greater than 60 indicated adequate compression force, and readings with a quality factor less than 60 were rejected. The B-mode images and elastograms were displayed side by side on the screen. The elastogram appeared as a colour-coded image superimposed on the B-mode images within a rectangular region of interest (ROI). The colour represented the relative stiffness of the tissues within the ROI, with red representing hard tissue, green representing tissues with intermediate elasticity, and blue representing soft tissue (Figure 2). The PF were qualitatively categorized into 3 grades depending on the predominant colour of the PF in the ROI similarly to the study by Wu et al. [13] as follows:
grade 1 – predominantly red (hard);
grade 2 – predominantly green (intermediate elasticity);
grade 3 – predominantly blue (soft).
Figure 2
Dual-mode display of B-mode (left) and strain elastogram (right) images of the plantar fasciae are shown. The elastogram of the plantar fascia of a 50-year-old female in (A) shows homogenous red colour (asterisk) suggestive of grade 1 (hard) plantar fascia. The elastogram (B) of a 40-year-old male shows predominantly green colour (asterisk) suggestive of grade 2 (intermediate stiffness) plantar fascia, while (C) the elastogram of a 54-year-old female shows predominantly blue colour (asterisk) suggestive of grade 3 (soft) plantar fascia
Statistical analysis
All the quantitative data were expressed as mean ± SD and compared with the healthy volunteers. Difference between the 2 means was observed by use of Student’s t-test or Mann-Whitney U test. All the qualitative data were expressed in frequency and percentage and compared using the c2 test or Fischer’s exact test. A p-value of less than 0.05 was considered as a significant difference.
Results
Of the 32 healthy volunteers, 20 (62.5%) were males and 12 (37.5%) were females. All healthy volunteers had normal RBS values reported in the last year. Eighty-one patients, of whom 41 (50.62%) were males and 40 (49.38%) were females, with type 2 DM were included in the study. The mean age of subjects in both groups has been compared in Table 1.
Table 1
Comparison of age (years) between healthy volunteers and patients
| Age (years) | Healthy volunteers (n = 32) | Patients (n = 81) | Total | p-value |
|---|---|---|---|---|
| Mean ± SD | 54.22 ± 8.38 | 53.6 ± 11.07 | 53.78 ± 10.35 | 0.67 |
| Median (IQR) | 53.5 (47.5-60.0) | 52 (45-60) | 53 (45-60) | |
| Range | 42-75 | 30-88 | 30-88 |
The mean duration of diabetes mellitus was 5.76 years. The RBS values ranged from 71 to 531 mg/dl with the mean being 251.60 mg/dl. The HbA1c values ranged from 5.6 to 18.5% with a mean of 8.51%. Out of 81 patients, 30 had symptoms suggestive of PN and 51 had no complaints suggestive of PN. Foot ulcers were found in 7 (8.64%) patients.
Because both feet of all subjects were evaluated, a total of 64 plantar fasciae of 32 healthy volunteers were examined using high-resolution ultrasonography. Out of 81 patients, 8 had amputation of one leg, because of which 154 PF of 81 patients were examined.
On greyscale evaluation of echogenicity, a striated hyperechoic appearance with longitudinally oriented fibres was seen in most, i.e. 96.87 % of healthy volunteers (Figure 1). Although the majority of PF in diabetic patients also retained the hyperechoic striated appearance, in 5.19% the PF appeared hypoechoic with loss of striated appearance (Figure 3). However, this difference was not statistically significant (p > 0.05).
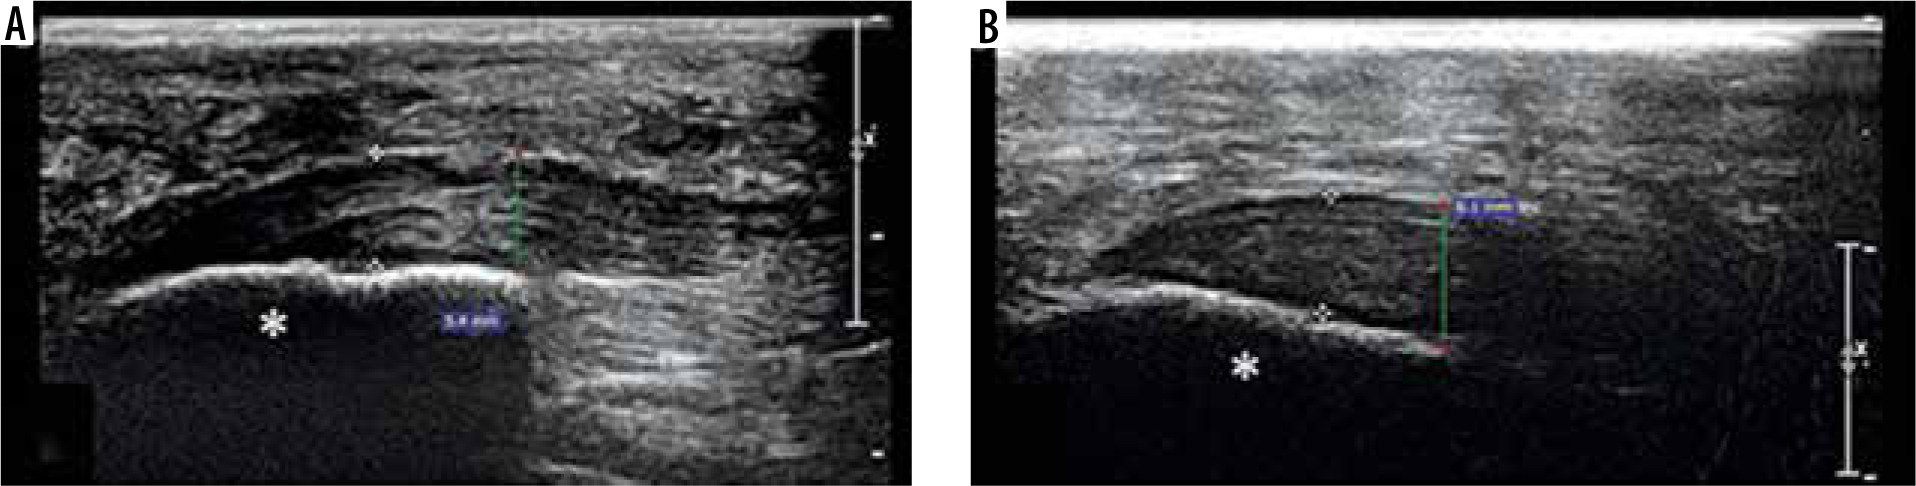
Figure 3
Longitudinal ultrasonographic images of the plantar fascia of 2 patients, a 50-year-old female (A) and a 60-year-old male (B) show thickening and hypoechogenicity near the insertion on the calcaneus with loss of striated appearance (asterisk)
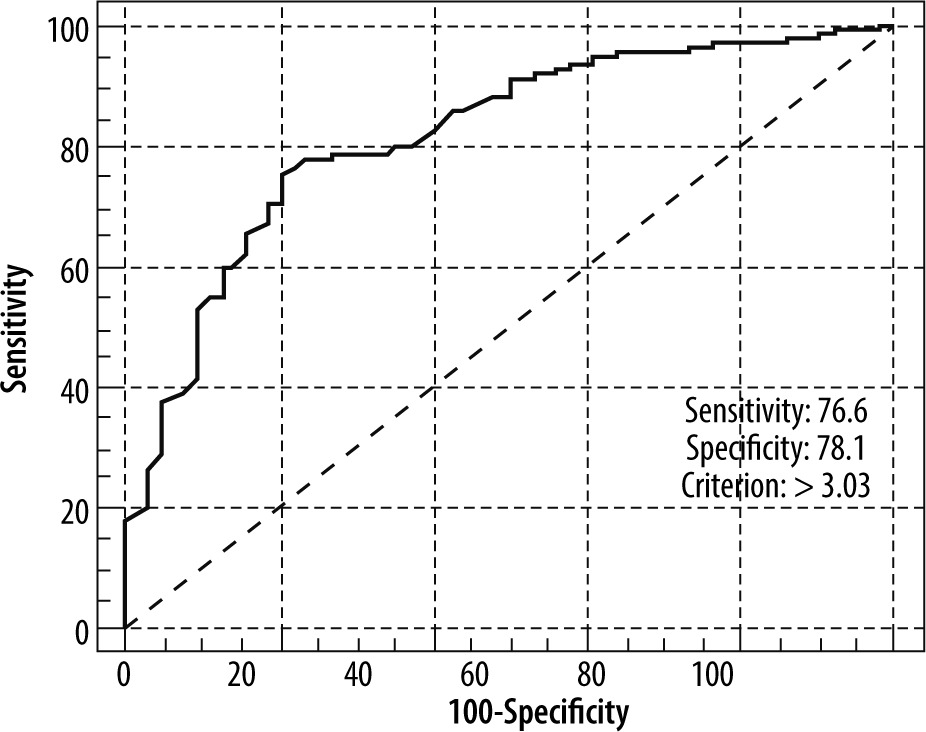
The PFT of the right and left sides showed no significant difference (p > 0.05) and hence were not considered separately for the calculations; rather the total number of PF were considered. The mean PFT in patients was found to be significantly higher than in healthy volunteers (Table 2). A cut-off of 3.03 mm for PFT for the 2 groups was found to have sensitivity of 76.62% and specificity of 78.12% (Table 3 and Figure 4).
Table 2
Comparison of plantar fascia thickness between healthy volunteers and patients
| Effect size | Mean difference | 95% CI of the difference | p-value | |||
|---|---|---|---|---|---|---|
| Lower limit | Upper limit | |||||
| Healthy volunteers (n = 122) | 2.68 ± 0.59 | 1.264 | 0.978 | 0.793 | 1.162 | < 0.0001 |
| Patients (n = 154) | 3.65 ± 0.88 | |||||
Table 3
ROC curve for plantar fascia thickness between patients and healthy volunteers
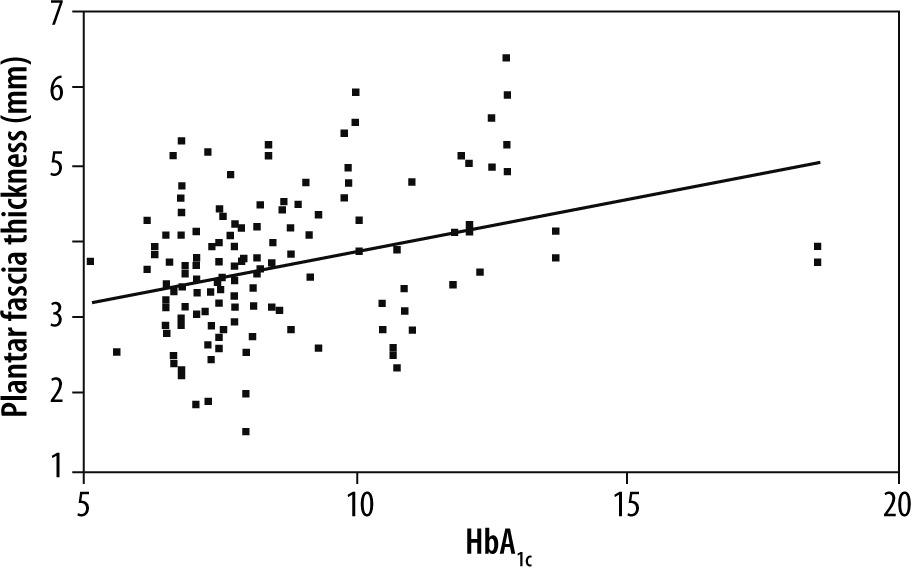
We also attempted to determine a possible correlation between PFT and age, duration of diabetes, RBS, or HbA1c. Using the Spearman rank correlation coefficient, we found a moderate correlation between PFT and HbA1c values (r = 0.321, p = 0.0001) (Figure 5) but not with age (r = 0.141, p = 0.081), duration (r = 0.058, p = 0.478), or RBS values (r = –0.007, p = 0.929).
A small number of patients, i.e. 7 (8.64%), also had foot ulcers. However, they did not hinder the examination because the ulcers were mainly limited to the plantar surface of the toes and metatarsal head region away from the ultrasound examination site. Although the patients with foot ulcers had thicker PF, the number of patients with ulcers was very low and the statistical significance of the differences in PFT between the ulcer and non-ulcer groups could not be analysed.
On analysis of the strain elastography of PF of healthy volunteers, we found that grade I (red/hard), grade II (green/intermediate), and grade III (blue/soft) were found in 42.19%, 48.44%, and 9.38%, respectively. On the other hand, 6.11%, 57.25%, and 36.64% of patients had grade I, II, and III PF, respectively. Although most subjects in both groups had grade 2 PF, grade 1 PF was more common in healthy volunteers as compared to patients, whereas grade 3 PF was more common in patients. This difference in distribution of grades of PF between the 2 groups was statistically significant (p < 0.001). Hence, in the present study, diabetics were found to have softer PF compared to healthy volunteers (Table 4).
Discussion
DM is an endocrine disorder associated with several long-term complications, including foot ulcers, which is an important cause of morbidity affecting the quality of life of these patients [11,12]. Peripheral neuropathy is a common complication in patients with DM [14]. It is considered one of the major factors responsible for the onset of foot ulcers. Limited literature is available wherein the other factors contributing to development of foot ulcers have been studied. Consequently, preventive measures for foot ulcers have been ineffective [3]. Diabetes-related alterations in the PF have been reported in several studies [3-7]. It has been hypothesized that accumulation of glyco-sylated end-products occurs in various human tissues as a result of hyperglycaemia-induced non-enzymatic glycation of proteins [2]. This may contribute to alterations in the biomechanical properties of the ankle-foot complex and development of foot ulcers [3]. Studies have shown that PFT could be a novel measure of tissue glycation and could offer a non-invasive estimate of glycaemic burden and tissue glycation [15,16]. These studies emphasize the potential role of evaluation of PF in the management of patients with DM.
An attempt has been made in this study to evaluate the diabetes-induced changes in the sonographic and elastic properties of the PF in comparison to a non-diabetic group. The PF was seen as a moderately echogenic structure with linear striations in most of the study subjects (Figure 1), which is in concordance with the normal appearance of the fascia described in previous studies [17,18]. However, alterations in echogenicity were observed in a small number of PF of patients in the form of hypoechogenicity and loss of striated appearance (Figure 3). This is similar to the ultrasonographic appearance of plantar fasciitis, although the greyscale appearance of the PF in diabetics has not been widely studied [19]. A very small proportion of healthy volunteers also showed similar changes.
The present study found that diabetics have significantly thicker PF as compared to healthy volunteers, measuring 3.66 ± 0.89 mm and 2.67 ± 0.66 mm, respectively (p < 0.0001). The thickening was more evident in patients with PN as compared to those without PN, although this difference did not attain statistical significance.
These findings are in accordance with several studies that have shown a significant increase in PFT in diabetics [3-7]. Giacomozzi et al. demonstrated an increase in the thickness of PF and Achilles tendon in diabetics, which was more evident in the presence of PN [3]. The mean values of PFT in the present study are slightly higher compared to previous studies. One of the possible explanations could be the use of a high-resolution dedicated musculoskeletal probe with a frequency of 5-17 MHz in contrast to the relatively low frequency transducers used in the previous studies. Also, it must be noted that these studies included patients with both type 1 and type 2 DM whereas only patients with type 2 DM were included in the present study [5-7]. Even though there are some discrepancies in the absolute mean values of PFT, the trend of increased PFT in diabetics is similar in all the studies.
The greyscale ultrasound examination of the PF provides information regarding changes in morphology, including thickening and hypoechogenicity, which give indirect evidence of alterations in the biomechanical properties of the PF. Elasticity is the tendency of a material to resume its original form after being subjected to a deforming force or stress. Ultrasound elastography provides additional information by direct assessment of the elastic properties of the fascia [20]. It is an imaging technique that evaluates the tissue stiffness non-invasively by measuring the amount of tissue deformation in response to application of a mechanical force. The stimulus can be static or dynamic in nature. Strain elastography is a static elastography technique in which manual compression is applied using the ultrasound transducer for superficial structures, while utilizing the displacement generated by physiological motion of organs for deeper tissues [21,22]. Shear wave elastography has been studied extensively in the context of organs like the liver, breast, thyroid gland, and kidney [21]. Recently, the musculoskeletal applications of these more objective techniques are being explored including the PF [23-25]. In this technique, the compressive force is generated by the ultrasound probe. This contrasts with strain elastography wherein the force is applied manually. Hence, the tissue stiffness can be quantified using this technique. However, it must be noted that the application of this technique is greatly limited in the evaluation of very superficial structures and tissues at a depth greater than 9 cm from the skin surface [20,26]. Hence, strain elastographic evaluation of PF was done in the present study.
Strain elastographic evaluation of the PF at the calcaneal insertion revealed that the majority of plantar fasciae in both groups were of intermediate elasticity, seen in 48.44% of healthy volunteers and 57.25% of patients. Grade 3, i.e. soft, PF was more frequent in the patient group (36.64%) as compared to the healthy volunteer group (9.38%). In contrast, grade 1, i.e. hard, PF was found in 42.19% of healthy volunteers as compared to only 6.11% of patients. Hence, a significant difference in the distribution of grades of PF between the 2 groups was observed (p < 0.0001).
Previous studies have evaluated the changes in elasticity in patients with plantar fasciitis [9,10,27]. However, there is a paucity of literature regarding the sonoelastographic characteristics of PF in diabetic patients. Rioz-Diaz et al. evaluated patients with plantar fasciitis using sonoelastography and compared the findings with the PF of healthy volunteers, and they found that most of the fasciae were of intermediate elasticity in both groups [10]. This finding is in concordance with the results of the present study. Two other studies comparing the PF of healthy subjects with patients of plantar fasciitis concluded that there is softening of the PF in patients with fasciitis [10,27]. Similarly, diabetes also appears to cause softening of this structure.
The results obtained in the present study support the hypothesis that DM induces structural alterations in the PF [2]. These changes possibly lead to altered foot mechanics with a consequent increase in forefoot pressure, which in turn contributes to the development of foot ulcers [3]. Knowledge of these changes could help in better prevention of foot ulcers in patients at risk because these changes can be seen on elastography even in patients without symptoms of peripheral neuropathy.
One of the drawbacks of our study was the categorization of patients into neuropathic and non-neuropathic groups based on clinical symptoms such as numbness, tingling, and loss of sensation and not on objective methods like nerve-conduction studies. Consequently, asymptomatic patients with peripheral neuropathy could have been included in the non-neuropathic group. Also, the number of patients with foot ulcers was small. Hence the effect of foot ulcers on the PF could not be adequately evaluated. One of the main disadvantages of strain elastography is that it is a qualitative technique and is unable to measure the absolute stiffness of the tissue. Also, in the musculoskeletal system it is difficult to obtain a reference region of interest for calculation of the strain ratio because the anatomy is most often unfavourable [20]. However, it is more readily available and has been extensively used for a wide range of applications.
Ultrasound elastography is a simple and non-invasive technique that can be easily incorporated into the routine examination protocol in the evaluation of patients with DM, which potentially plays a role in more effective prevention of diabetic foot.
Conclusions
We conclude that patients with type 2 DM show changes in the form of thickening and softening of the plantar fascia as compared to healthy volunteers, suggesting that DM causes morphological and biomechanical alterations in the fascia. However, in the present study no significant difference was observed between patients with and without complaints of PN. Hence, these alterations could occur independently of the onset of PN. However, large multicentre studies are required to confirm this association.