


Introduction
Scoliosis is a complex three-dimensional problem that affects alignment of vertebral bodies. It is generally (80%) idiopathic, but many congenital or developmental abnormalities may lead to anomalous sideways curvatures of the spine [1]. Congenital scoliosis is described as a lateral curvature of the vertebral column due to a developmental abnormality. Scoliosis that is not associated with any underlying anomaly is referred to as idiopathic scoliosis. Many studies have essayed to explain the aetiology and pathophysiology of scoliosis, which is thought to be multifactorial.
Low bone mineral density in adolescent idiopathic scoliosis was firstly revealed by Burner et al. [2] in 1982. Until today, few studies have assessed the relationship between low bone mineral status and scoliosis in either paediatric or adult patients. The prevalence of osteoporosis and osteopaenia in patients with scoliosis was found to be greater than in the general population [3,4]. In most of these studies, bone mineral density (BMD) was measured by dual-energy X-ray absorptiometry (DEXA), which can result in failure in patients with scoliosis due to the projectional method of this technique.
In congenital scoliosis patients, the curve progression over time is greater and the ultimate prognosis is worse than in idiopathic scoliosis [1]. There are a few studies that assessed the relationship between BMD and scoliosis, but to our knowledge, there are no studies comparing BMD values of congenital and idiopathic scoliosis. We propose the hypothesis that BMD values in congenital scoliosis patients may be lower than idiopathic scoliosis patients associated with the presence at birth, accompanying developmental anomalies, and genetic syndromes.
Quantitative computed tomography (QCT) is a three- dimensional non-projectional technique to quantify BMD. QCT provides detailed calculation of trabecular bone with elimination of cortex and extra-osseous calcifications. Therefore, it is suggested as an established technique for the evaluation of BMD [5]. There have been a number of studies that assessed the relationship between BMD and scoliosis by using DEXA. However, to our knowledge, evaluation of this relationship by using QCT has been reported in few studies. The aims of our study were to evaluate BMD in scoliosis patients by using QCT and to compare the BMD of idiopathic and congenital scoliosis patients. Also, the current study is the first to compare BMD values in patients with idiopathic and congenital scoliosis.
Material and methods
The study was approved by the local Ethics Committee (Ethics Committee decision date and number: 07 May 2015, 12/01). Our hospital’s imaging archive was scanned retrospectively during the period 2005-2016. Written informed consent was obtained from all patients.
Patients
Forty-three patients aged one to 40 years with idiopathic, congenital, or neuromuscular scoliosis, on whom a computed tomography (CT) scan was performed were incorporated in the study. The diagnosis of scoliosis was made after a physical and radiographic examination by two spine surgeons and a senior radiologist. Patients with degenerative and traumatic scoliosis were excluded.
A gender- and age-matched control group was included in the study. Control cases were chosen randomly from the archives of our department. CT images of the patients and controls with any artefacts were excluded.
Computed tomography imaging and assessment of BMD
Non-enhanced CT for 39 patients and 37 controls, and contrast-enhanced CT for four patients and four controls were performed using three different multi-detector CT (MDCT) scanners (Brilliance 64 Philips, Brilliance 16 Philips, and MX 8000 Philips; Philips Medical Systems©, Eindhoven, The Netherlands). CT scanning parameters were as follows: KV – 120 kVp; current – 120 mA; beam pitch – 0.688; and slice thickness – 0.75 mm. Routine multiplanar reconstructions were performed in standard sagittal and coronal planes, with a slice thickness of 1.0 mm and a reconstruction increment of 0.75 mm. Then, all images were transferred to a workstation (Philips Extended Brilliance Workspace V3.5.0.2254) to measure BMD by using the phantom-less QCT technique. The same senior radiologist performed all of the measurements.
The trabecular BMD (mg/cm³) of each vertebral body was measured from thoracic 12 to lumbar 5. Three measurements of the same vertebral body were noted, and the mean values were calculated. The thickness of the region of interest (ROI) was 1 cm. The ROI was placed at the middle of the vertebral body. The cortex, posterior venous plexus, and Schmorls’ nodes were not included in the ROI. The mean ROI was nearly 2.5 cm², and the total volume measured was about 2.5 cm³. We used our classic QCT BMD protocol by measuring CT number of fat and muscle area for calibration on the same slice, in accordance with the guidelines specified by the manufacturer (Figure 1). The present method has been reported as a useful and definitive procedure in the evaluation of BMD [6].
Figure 1
Measurement of bone mineral density (BMD) by using quantitative computed tomography (CT). Regions of interest of L3, muscle, and fat are shown with their CT readings in yellow, pink, and blue colour, respectively. BMD was calculated as 89.2 mg/cm3 in this example
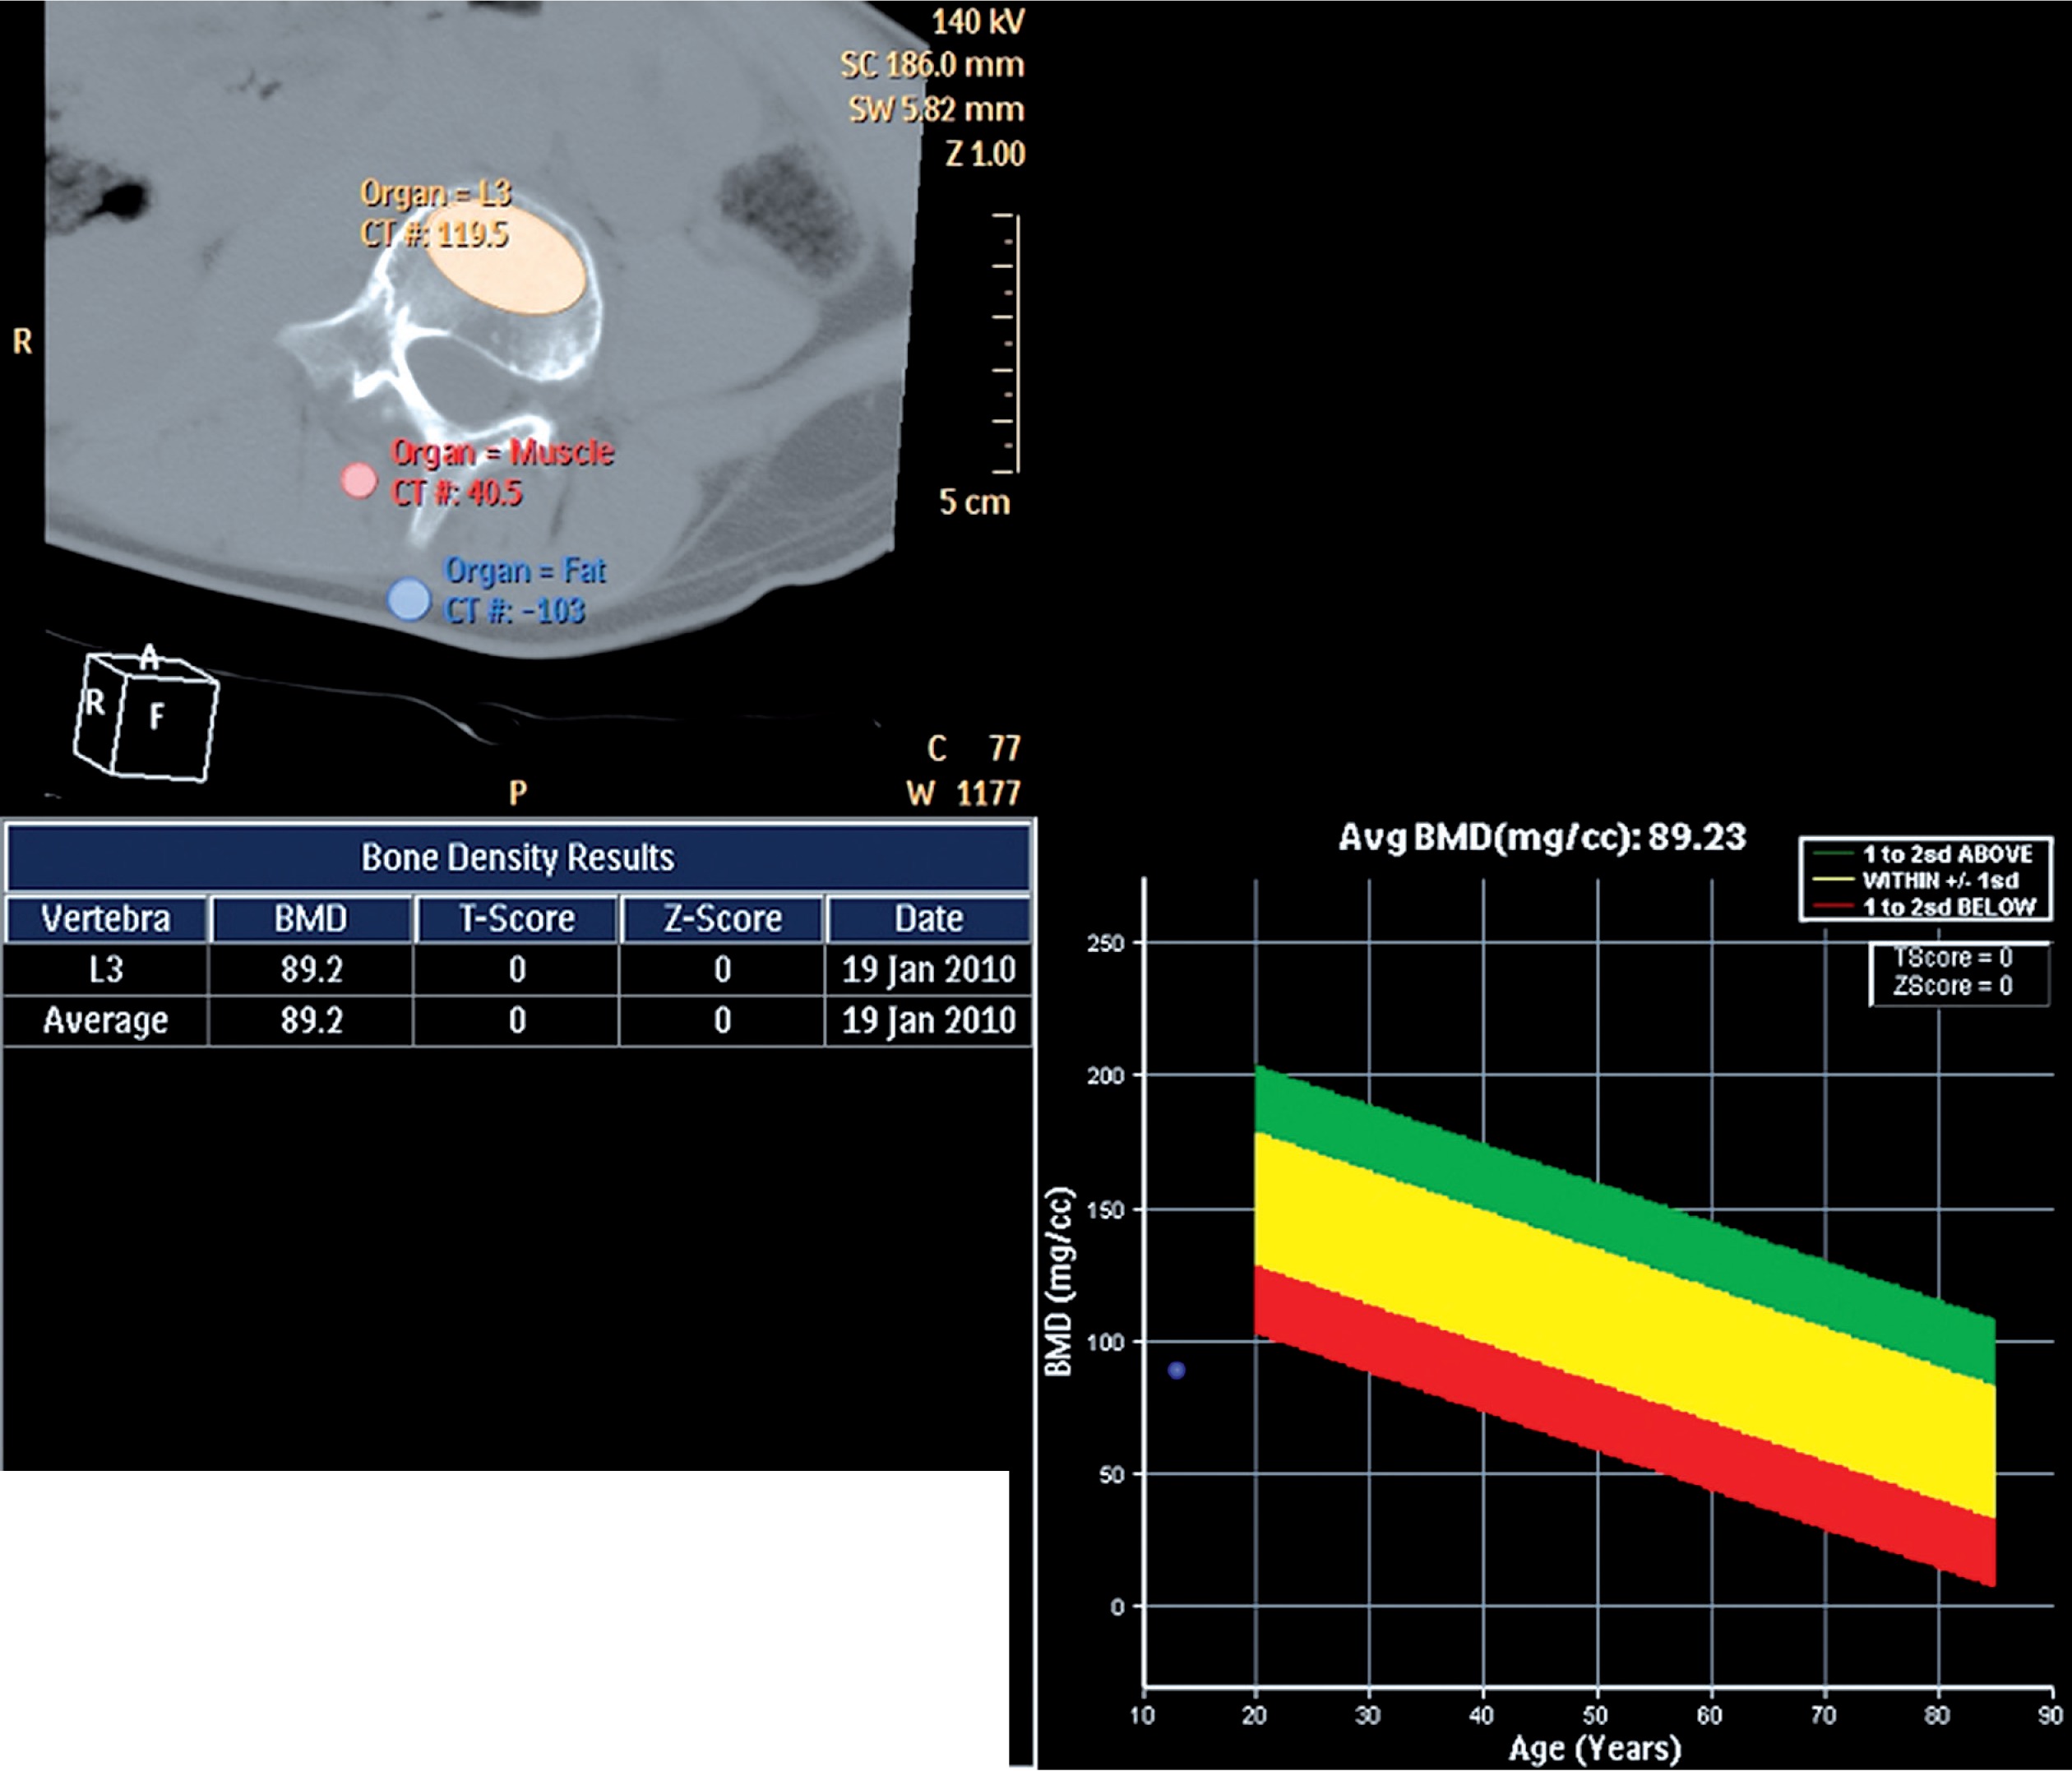
To eliminate the effect of contrast material on contrast-enhanced CT examinations, a formula: BMD = 0.91 × mean BMD MDCT – 0.031, developed by linear regression analysis was used, as in some other studies [7,8].
Statistical analysis
Continuous data are expressed as means ± standard deviation (SD) and categorical variables as percentages. The distribution of continuous variables was evaluated by the Kolmogorov-Smirnov test and showed a normal distribution (p > 0.05). Because of this, BMD values between scoliosis patients and controls were compared with the independent t-test. The chi-square exact test was used for the comparison of categorical data while the independent t-test was used for the analysis of parametric variables. P-values of less than 0.05 were considered statistically significant. BMD changes in idiopathic and congenital scoliosis patients were assessed using univariate analysis test by considering the age. Statistical analysis was performed by using the Statistical Package for the Social Sciences (SPSS) version 22.0 (SPSS Inc., Chicago, IL, USA).
Results
Twenty-three patients were female and 20 were male. Among the control group, 23 were female and 18 were male. The average age of the patient group was 14.9 ± 10.1 years and in the control group it was 15.1 ± 10.2 years. Twenty-two of the patients with scoliosis were idiopathic, 15 were congenital, four were neuromuscular, and two were neurofibromatosis. The average age in the idiopathic scoliosis patient group was 16.5 ± 6.2 years and in the congenital scoliosis group it was 9.7 ± 7.1 years. There was no significant difference regarding age (p = 0.94) and sex (p = 0.81) between scoliosis patients and controls. A significant difference was found in the mean ages between idiopathic and congenital scoliosis patients (p = 0.006).
The demographic data and QCT BMD values are outlined in Table 1. The mean BMD values of patients with scoliosis were significantly lower compared with the control group (106.8 ± 33.4 mg/cm3 vs. 124.9 ± 29.1 mg/cm3, p = 0.009). A significant difference in BMD values between scoliosis patients and controls was found at all levels (L1 to L5, p = 0.002, 0.034, 0.007, 0.007, and 0.012, respectively) except the T12 level (p > 0.05).
Table 1
Demographic features and QCT BMD values of the patient and control groups
| Factor | Patients(n = 43) | Controls(n = 41) | P-values |
|---|---|---|---|
| Age (year)* | 14.9 ± 10.1 | 15.1 ± 10.2 | |
| Female-to-male ratio | 23/20 | 23/18 | |
| BMD** | |||
| Mean | 106.8 ± 33.4 | 124.9 ± 29.1 | 0.009 |
| T12 | 118.2 ± 45.7 | 128.6 ± 28.8 | NS |
| L1 | 106.0 ± 34.0 | 129.5 ± 32.6 | 0.002 |
| L2 | 107.2 ± 32.3 | 122.7 ± 33.6 | 0.034 |
| L3 | 98.1 ± 34.4 | 117.3 ± 28.8 | 0.007 |
| L4 | 102.0 ± 36.2 | 122.1 ± 30.0 | 0.007 |
| L5 | 109.4 ± 39.8 | 129.6 ± 31.9 | 0.012 |
In univariate analysis, no significant difference in BMD values was found between idiopathic and congenital scoliosis patients (p > 0.05).
Discussion
The mean BMD values of scoliosis patients measured by QCT were significantly lower compared with the control group in this study. Also, the relationship of BMD between idiopathic and congenital scoliosis patients was evaluated, and no significant difference was found. Although osteoporosis is the most common metabolic bone disease in adults, it is rare in childhood. The mechanism of osteoporosis in scoliotic patients is still unexplained. Low bone mass may be either a cause or a result in patients with scoliosis.
There are different imaging modalities to estimate BMD, including single-photon absorptiometry, dual-photon absorptiometry, DEXA, QCT, and qualitative ultrasound. DEXA is an accepted and frequently preferred areal measurement technique for monitoring BMD [9]. Although DEXA is quick, flexible, and has low radiation dose, it cannot separate cortical and trabecular bone. Moreover, DEXA may affect from aortic atherosclerosis, degeneration, and osteoarthrosis. Most of the studies in the literature were done using the DEXA method, which may lead to errors in scoliosis patients because of spinal deformities. The three-dimensional disorder of the vertebrae may provoke false results when DEXA is used for evaluating BMD in scoliosis. Especially in severe scoliosis, invalid results may occur due to positioning problems with DEXA [10]. It is also reported that both curvature and rotation of the spine may affect the DEXA results [11]. QCT is a unique volumetric technique that provides measurement of a particular area, and it supplies multiplanar reconstruction [12]. Furthermore, QCT allows differentiation of cortical and trabecular BMD. Additionally, quantification of BMD with QCT is independent of bone size, in contrast to DEXA. Therefore, we used QCT as a more recent and accurate technique to measure BMD in patients with scoliosis.
Various studies in the literature have described the relationship between osteoporosis and scoliosis [13-16]. The prevalence of osteoporosis in patients with adolescent idiopathic scoliosis is almost 20–38% [14,15,17,18]. These studies had limitations such as a low number of subjects and a lack of well-documented demographic data. Cheng et al. [13] investigated the association between BMD and adolescent idiopathic scoliosis in young women by using DEXA for areal and peripheral QCT for volumetric measurements. They reported that both areal and volumetric BMD in the control group was higher than in the AIS group. In our study, spinal QCT was preferred instead of peripheral QCT. Moreover, not only idiopathic scoliosis patients but also congenital and neuromuscular scoliosis patients were included in the current study. A study by Tahvildari et al. [19] reported low BMD in patients with adolescent idiopathic scoliosis by using DEXA. Sadat-Ali et al. [4] compared BMD values in patients with adolescent idiopathic scoliosis and their healthy siblings by using DEXA, and they found lower BMD values in the scoliosis group. Similarly to this study and the literature, we found statistically significant lower BMD values in patients with scoliosis compared with the control group.
It is known that patients with congenital scoliosis have a worse prognosis than idiopathic scoliosis. Thus, we were also interested in BMD values in these two patient groups. Nevertheless, we found no significant difference in BMD values between idiopathic and congenital scoliosis patients. This may be due to the small number of patients. Further studies with more subjects are needed to analyse BMD values in these two patient groups.
BMD may be affected from overload. There have been a few reports about microstructural abnormalities of the bone related to spinal deformity [16,18,20,21]. Shea et al. [20] reported that the convex side had lower bone mass than the concave side. They suggested that curvatures perform strength to facet joints and that concave and convex sides are subjected to compression and tension. Similarly to their results, Routh et al. [21] demonstrated that both bone mineral content and BMD were higher on the concave side. In addition, Schlager et al. [22] suggested that irregular loading may affect bone formation and provoke scoliosis.
It is unknown whether osteoporosis in scoliosis is a primary problem or secondary to the spinal abnormality. Cheng et al. [18] performed histomorphometric research to understand this issue. Anomalous metabolic and developmental activity in AIS were explained by the decreased osteoclasts in the trabecular compartment. These histological findings approve the theory that low bone mass may be the underlying problem. The osteopaenia might develop before the lateral curvature, and the low bone mass could be the main cause of spinal abnormality in these patients. Because bone mineral content is consistently associated with stamina and stability, osteopaenia may affect the spinal structure and provoke the spinal deformity.
It is a controversial question whether low BMD in patients with scoliosis is a temporary phenomenon or a permanent problem. Cheng et al. [15] conducted a prospective study by using DEXA and reported a persistent lowness in BMD. Fourteen girls with osteopaenic adolescent idiopathic scoliosis were followed up for three years, and DEXA results showed persistent low BMD. In another study [17], 196 patients with adolescent idiopathic scoliosis and 122 healthy controls were followed up for 3.5 years during periods of rapid growth. BMD was monitored by using DEXA and peripheral QCT. They reported that 86% of osteopaenic patients had persistent low BMD. In children, there is dynamic growth in the bone mass. If osteopaenia is a permanent problem, the patients may be vulnerable to osteoporosis in late adulthood.
The studies investigating the relationship between BMD and scoliosis features have conflicting results. A histomorphometric study by Cheng et al. [18] showed that there is no relationship between the degree of curvature in scoliosis and the BMD value. Contrary to this, a prospective study showed that osteopaenia might be an important risk factor in curve progression [23]. In addition, Lee et al. [24] reported a powerful inverse relationship between curve severity and BMD in patients with adolescent idiopathic scoliosis. They indicated that it might also be crucial to prevent osteopaenia as well as to control curve progression in patients with adolescent idiopathic scoliosis during the peripubertal period.
It is still unknown if it is necessary to treat osteoporosis or osteopaenia in scoliotic patients. This is due to the fact that the pathophysiology is still not fully explained. Understanding the effect of scoliosis on BMD will contribute to the treatment of both osteoporosis and scoliosis. Furthermore, the pathophysiology of both diseases will be more clearly understood. More prospective, randomised, and longitudinal follow-up studies should be performed to investigate whether low bone mass is an aetiological factor in scoliosis.
The study had some limitations. One of them was that it is a retrospective study. However, it is one of the few studies that used QCT for BMD assessment. Another limitation was the small sample size of patient and control groups. We plan to continue this study with a larger number of patients.
Conclusions
Using the QCT method can give more accurate results to determine BMD, especially in patients with scoliosis. This study demonstrated that the vertebral body BMD values of the patients with scoliosis were significantly lower than those of the control group. No significant difference in BMD values was found between idiopathic and congenital scoliosis patients. Osteoporosis is a known status in patients with scoliosis. However, the mechanism of this condition and its contribution to the treatment of scoliosis needs further investigation.