


Introduction
Radiation awareness of potential oncogenic effects from medical imaging, particularly computed tomography (CT), is highly focused on children and young adults, who tend to be sensitive to the stochastic effects of the ionizing radiation because of sustainable active cell division and relative longevity [1]. If, however, the total dose is accumulated below 100 mSv and is received over a longer period of time, the radiation effects owing to exposure are likely to be less severe, and the lifetime risk of fatal cancers is also estimated to be a factor of 2 to 4 less than that with exposure to higher doses and dose rates, according to the National Research Council (NRC) 1990 [2]. Several large epidemiological cohort studies published afterwards have shown a correlation between paediatric absorbed dose accumulation with a minimum of 50-60 mGy and estimated risks of leukaemia and brain tumours on the basis of the Life Span Study of atomic bomb survivors [1,3-5]. Recently, some authors [6] have set patients’ dose alerts at the cumulative effective dose estimate of 50 mSv for ages under 40 years in their clinical practice.
The availability and continual improvement of CT scanning over the past 2 decades have led to increased use of such imaging, and consequently have provoked a cumulative radiation burden [1,7-12]. Despite the likelihood of high cumulative CT dose in paediatric patients whose underlying illnesses are life-threatening or long-standing [7-12], the optimization remains one of the important factors contributing to applicable use of the ionizing radiation.
The purposes of this study were to estimate occurrence rate of pediatric patients who received a potentially vulnerable cumulative dose from CT examination(s), and to determine the influence of patient and scanning factors on the high-dose inclination.
Material and methods
This was an retrospective single-centre study performed at a tertiary healthcare university hospital [King Chulalongkorn Memorial Hospital, Bangkok, Thailand], which was approved by the institutional review board with a waiver of informed consent. All patients below 18 years of age who received a minimum cumulative effective dose of 50 mSv from CT examination(s) during a 5-year period between 1 January 2015, and 31 December 2019 were enrolled by a query of a searchable database via Radimetrics® version 2.9 (Bayer Healthcare, Whippany, NJ) commercial dose-reporting software, Picture Archiving and Communication System (PACS), and electronic medical records (EMR). Our chosen cut-off value of 50 mSv, at the least, was relevant to consider the high cumulative radiation exposure in the paediatric patients for close monitoring and persuading further radiation reduction. One hundred and seven patients met the inclusion criteria. Of these, 17 were excluded: 7 were adults but having typographic errors of age, 6 had unavailable images, 3 had incomplete data, and 1 had duplication of the hospital number.
Data collection
Basic patients’ demographic data (gender and age at time of CT scanning), frequency of CT examinations, number of CT scanning parts and acquisition phases, sites of CT scanners, weighted CTDIvol and estimated effective dose per examination, and cumulative effective dose were retrieved by Radimetrics®. Individual principle diagnosis collected from PACS and EMR was classified into 3 cate-gories including oncological condition, non-oncological illness, and trauma.
The sites of the CT scanners were grouped according to divisions into diagnosis, neurosurgery, radiotherapy, nuclear medicine, and the outsides as follows:
Diagnosis had 5 general CT machines in the diagnostic sector [including a Canon Aquilion ONE (Canon Medical Systems Corporation, Japan), a Siemens SOMATOM Force (Siemens AG, Erlangen, Germany), a GE Discovery CT750 HD (GE Healthcare, Milwaukee, USA), a Siemens SOMATOM Sensation 16 (Siemens AG, Erlangen, Germany) and a Philips Ingenuity (Philips Medical Systems, Cleveland, USA)], 2 CT machines in the emergency sector [including a Philips Brilliance 64 (Philips Medical Systems, Cleveland, USA), and a GE Revolution (GE Healthcare, Milwaukee, USA)], and 1 CT-guided machine in the interventional sector [including a Canon Aquilion LB (Canon Medical Systems Corporation, Japan)].
Neurosurgery had 1 portable neuro-CT machine – a CereTom (NeuroLogica, Danvers, USA).
Radiotherapy had 2 CT simulators, including a 16-slice Philips Brilliance Big Bore (Philips Medical Systems, Cleveland, USA) and a 64-slice Siemens SOMATOM Definition AS Open (Siemens AG, Erlangen, Germany).
Nuclear medicine had 1 hybrid PET/CT machine and 2 hybrid SPECT/CT machines, comprising a Siemens Biograph 16 PET/CT (Siemens AG, Erlangen, Germany), a Siemens Symbia TruePoint SPECT/CT (Siemens AG, Erlangen, Germany), and a GE Discovery NM/CT 670 (GE Healthcare, Milwaukee, USA).
Outsides comprised many unnamed CT machines that were used to perform examinations in other institutions, then the images were imported in our PACS.
The frequency of CT examinations, number of scanning body parts, and number of acquisition phases were counted. The researchers considered each head, neck, chest, upper abdomen, or pelvis as one scanning part, and each non-contrast, arterial-phase, venous-phase, delayed-phase, or repeated scan as one acquisition phase.
CT dose parameters per examination were characterized through weighted volume CT dose index by different scan lengths of each phase (weighted CTDIvol) and estimated effective dose. The Radimetrics® uses the library of Cristy phantoms and matches patients to a particular phantom based on age and diameter by using Monte Carlo simulation and International Commission on Radiological Protection (ICRP) Publication 103 tissue weighting factors to calculate the effective dose [13].
Adapted from U.S. NRC and ICRP Publication 103, in this study, the cumulative dose was defined as an individual’s total effective dose resulting from repeated exposures of ionizing radiation from the CT scan to the head or body part, over a period of time; the collective dose was defined as the sum of all individual doses in a specified group of people in the same period of time.
Statistical analysis
Microsoft Office Excel 2016 (Microsoft Corporation, CA) was used for database management, calculation, and graphs. For further statistical analysis, the data were exported from Excel into IBM SPSS Statistics for Windows, Version 22.0 (IBM Corp., Armonk, N.Y., USA).
Demographic data were summarized as frequency and percentage for categorical variables, and median with range for continuous variables owing to non-normality of the data distribution. The percentage of patients who were exposed to a high cumulative effective dose during a 5-year period was computed as the occurrence rate.
The collective dose was calculated by summation of effective doses derived from a specified group of the prospectively influential variables, then calculated as a percentage. Such influential variables were settled regarding the diagnosis and sites of CT scanners. The total collective dose was the sum of effective doses in all individuals. Nonparametric statistical analysis in the form of the Kruskall-Walis H test was used to determine the CT dose parameters differences among the diagnostic groups.
The recorded variables comprised gender, frequency of CT examinations, number of scanning parts, and acquisition phases and principle diagnoses were analysed through simple and multiple linear regressions with bootstrap resampling method to determine factors affecting high-dose inclination.
A p-value of < 0.05 was indicated to be statistically significant.
Results
During a 5-year period, there were 2771 individuals who had been exposed to CT scans. Of these, 90 patients (3.2%) had cumulative effective dose estimates over 50 mSv, 17 (0.6%) had over 100 mSv, 4 (0.14%) had over 200 mSv, and 1 (0.04%) had over 300 mSv. Individual CT dose accumulations ranged from 50 to 303 mSv (a median of 74 mSv). The total collective dose was 7985 mSv.
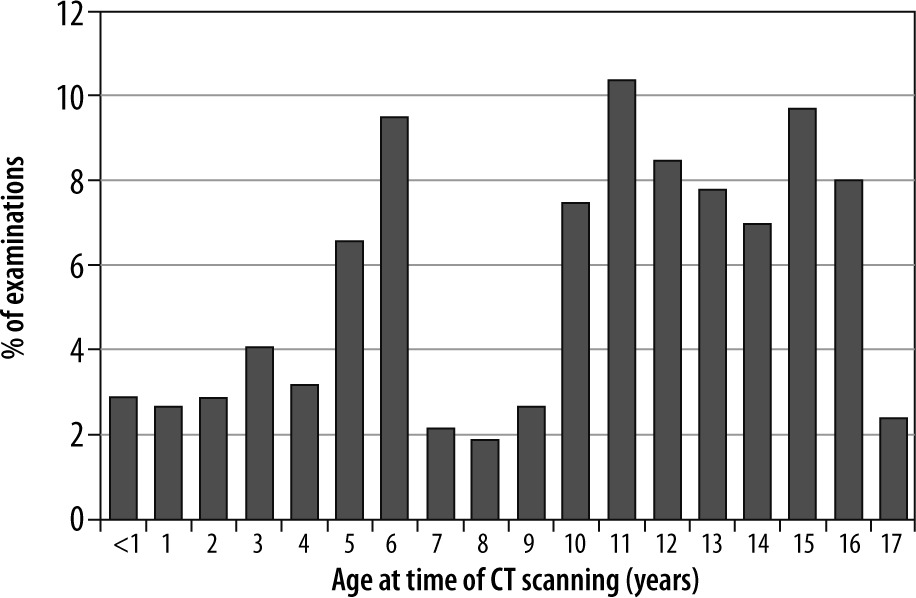
Age distribution was bimodal with peaks at 5-6 years and 10-16 years (Figure 1). The median age was 11 years (range: 2 days to 17 years) at the time of CT scanning. Fifty-one per cent were female. In 90 patients, a total of 412 CT examinations [median: 4, range: 1-13 examinations per patient], 824 scanning parts [median: 2, range: 1-5 parts per examination], and 720 acquisition phases [median: 2, range: 1-5 phases per examination] were obtained.
Oncological condition was the most common diagnosis in paediatric patients exposed to high CT cumulative doses, comprising 63 of 90 patients (70%), who primarily gathered 320 of 412 examinations (78%), with a median of 5 examinations (range: 1-13) per patient, and had a collective dose that was 74% (5947 mSv) of the total. Not surprisingly, the median cumulative effective dose was the highest in the oncology (77 mSv), followed by trauma (70 mSv), and illness (61 mSv); however, there was no statistically significant difference between these 3 diagnostic groups. The data are summarized in Table 1.
Table 1
Distribution of number of patients, frequency of computed tomography (CT) examinations, and cumulative and collective doses according to the 3 diagnostic groups
With respect to sites of CT scanners (Table 2), the diagnosis division comprised 57% of the examinations, to contribute only 32% of the collective dose, while CT simulator in radiotherapy comprised 17% of the examinations, to contribute 39% of the collective dose. Accordingly, the greatest median effective dose also occurred in the radiotherapy division (41 mSv per examination), being approximately 4.5-fold higher than the grand median dose (9 mSv).
Table 2
Distribution of frequency of computed tomography (CT) examinations and radiation exposure according to sites of CT scanners
As a result of differential exposures to radiation among sites of CT scanners, CT parameters per examination were further explored, as shown in Table 3. The total of 412 CT examinations were from 98 (24%) head scans and 314 (76%) body scans. Body CT scanning offered a much higher effective dose than did head CT. The grand median effective doses of the head and body CT scans were 5 mSv (range: 1-65 mSv) and 13 mSv (range: 1-128 mSv), respectively. The percentages of the collective dose distribution from the head and body scans were 10% and 90%, respectively.
Table 3
Variable computed tomography (CT) parameters and effective dose estimates in head and body CTs according to sites of CT scanners
† Head scanning parts included 87 brain CTs, 1 brain CT perfusion, and 10 brain/neck CTs using 16-cm phantom diameter. #Body scanning parts included 7 brain/neck/chest CTs, 29 brain/neck/chest/abdomen CTs, 36 neck CTs, 1 neck/chest CT, 12 neck/chest/abdomen CTs, 45 chest CTs, 75 chest/abdomen CTs, 20 one-part abdomen CTs, and 89 two-part abdomen CTs using 32-cm phantom diameter.
For head scanning (Table 3), the portable CT of neurosurgery division, mostly used 71 mGy of the weighted CTDIvol with single-phase acquisition to provide as many median effective doses as the diagnosis division and outsides obtained with median 2-phase acquisition. Meanwhile, CT simulator of radiotherapy used 55 mGy of the median weighted CTDIvol to notably contribute to effective dose about 3.5-fold greater than the others did.
Regarding body scanning (Table 3), the radiotherapy division also generated the greatest median effective dose (46 mSv), being approximately 3.5-fold higher than the grand median dose (13 mSv) because it was considerably higher both in numbers of CT scanning parts and weighted CTDIvol. Despite having higher numbers of CT scanning parts, the nuclear medicine utilized lower weighted CTDIvol and subsequently contributed much less exposure (median of 6 mSv) than the others did. In addition, the outside CTs were obviously high in number of acquisition phases (median of 3 phases) and estimated effective dose (median of 26 mSv).
There were various acquisition phases in body CT examinations among sites of CT scanners (Table 4). About two-thirds of CT scanning in the emergency sector and three-quarters of CT scanning from the outsides were performed with dual or triple acquisition phases. Moreover, 19% of examinations from the outsides were encountered with more than 3 phases.
Table 4
Distribution of computed tomography (CT) acquisition phases per examination according to the sites of CT scanners
To determine the factor-driven high-dose accumulation during a 5-year period, a multiple linear regression was conducted. Through a simple linear regression analysis between all independent variables and the cumulative exposure, target variables identified as frequency of CT examination, and number of scanning parts and acquisition phases, which were significant at p < 0.05, were subsequently selected in the multiple linear regression model. The patients with higher numbers of scanning parts or phases would have inclination of the cumulative dose (p < 0.05), while the frequency of CT examinations was insignificant, as shown in Table 5.
Table 5
Factors affecting high cumulative dose inclination during a 5-year period by multiple linear regression analysis
Discussion
Several studies [1,3-5] have shown that high dose accumulation (~50-60 mGy) in children has a considerable influence on estimated risks of tumours; thus, a survey of occurrence rates and an assessment of contributing factors to such high radiation exposure, particularly from CT scans, are crucial to proper manipulation of radiation reduction. From the literature reviews, the repeated diagnostic examination from disease chronicity, such as complex medical problems and oncological illness, was the mainstay of high cumulative exposure in several articles [1,8,10,14,15]. However, a few recent articles [11,12] have demonstrated that critically injured patients comprise another group that also received high CT cumulative doses, particularly from trauma stat protocols.
Our study revealed the occurrence rate of paediatric patients receiving at least 50 mSv from CT scans during a 5-year period to be 3.2%. The diagnoses of oncological and trauma conditions were 70% and 6%, respectively. We suggest that the influential factors on high-dose inclination were more likely from customized CT protocols in the particular scanners by applying multipart scans, multiphase acquisitions, and high-dose parameter settings rather than from higher frequency of examinations.
Because our institution is a large-scale referral centre equipped with many CT machines in several specialty sectors, paediatric patients may have been exposed to many CT examinations from different divisions in the hospital and also from outside sources before the referral. The different sites of CT scanners might have different limitations, be supervised by their own policies, and subsequently perform CTs in a diversity of scanning protocols. As a result, a wide range of radiation doses could contribute a significant component of high cumulative dose in an individual. In this study, radiation dose from each CT examination was relatively low in the diagnostic division, because of having optimized CT protocol by paediatric radiologists and modern CT scanners (multidetector CT with automatic tube current modulation and iterative reconstruction). Nonetheless, a high percentage of multiphase scanning was revealed from CT in the emergency sector, where two-thirds of the examinations were performed with dual- or triple-phase acquisitions. Our suggestion is that paediatric emergency protocols should be further reviewed with the team (physicians and radiologists) regarding number of acquisition phases for different specific indications.
The body examinations performed by the CT simulator of the radiotherapy division were obviously higher in numbers of scanning parts and weighted CTDIvol, and half of them were also scanned with dual-phase acquisitions; therefore, the high-dose exposure is notably with a median of 41 mSv per exam. Each head examination also produced a high effective dose with a median of 17 mSv despite almost single-phase scanning. The previous publications [16,17] have ascribed that because the CT simulator is performed with immobilization devices for effective patient positioning while scanning, the CT machine should be constructed with a larger aperture, which compromises the distance between the X-ray source and the detectors, subsequently reducing the signal-to-noise ratio and detrimentally affecting the image quality. All these combinations can increase the radiation dose, particularly when requiring more favourable image quality than from standard scanners. Despite discerning high-dose occurrence in the CT simulator, there is a lack of previous literature about paediatric radiation doses and machine-specific radiation optimization. Thus, a national survey ascertaining dose reference levels from CT simulators in both children and adults would be highly beneficial.
Kritsaneepaiboon et al. [18] reported that a satisfactory head CT scan usually produces 2-3 mSv of effective dose in single-phase scanning; thus, multiple head CT examinations even in dual phases barely reached a cumulative dose of 50 mSv within 5 years. However, using adult head CT parameters in paediatrics, particular in those of younger age, provides an unnecessary radiation burden. Our results showed that most paediatric head scans from the portable neuro-CT of the neurosurgery division were operated with 71 mGy of CTDIvol, the same as applied in adult brain scans. In consequence, paediatric protocol settings and regular monitoring are required.
It stands to reason that multiple factors can take part in changeable radiation exposure; therefore, more vulnerable factors are presumably more driven dose inclination. The aim of our research was to assemble and analyse all possibly vulnerable factors including patient characteristics, various sites of CT scanners, and operator-dependent technical parameters for a thorough understanding and determination of such factors and the cumulative exposure relationship. These results would be valuable for implementation of plans regarding dose management and/or further research.
There are some limitations to this study. Firstly, the occurrence rate of high cumulative dose might be underestimated because data of radiation doses from the outside sources might not be available in some enrolled patients. Secondly, size of the patients (patients’ weight or diameter) and each individual scanned parameter (e.g. kV or mA) were not included when comparing weighted CTDIvol among sites of CT scanners. Thirdly, in individual cases with high frequency of CT examinations and/or multi-part scanning, the justification was not determined. Finally, this study is a retrospective design with small sample sizes due to a low occurrence rate; therefore, insignificant results could be obscured by restricted numbers of each variable.
Conclusions
There was a low occurrence rate of paediatric patients with high CT dose accumulation. Of these, about 70% were diagnosed as having oncological illness. The factors of potentially high cumulative esposure to ionizing radiation were customized CT protocols with high CTDIvol, multiphase acquisitions, or multipart scanning, but not high frequency of CT examinations.