


Introduction
Reliable analysis of left ventricular (LV) wall motion plays an increasingly essential role for clinical decision making, e.g. in the diagnosis and treatment of ischaemic heart disease [1]. As qualitative wall motion evaluation is inherently subjective and subject to considerable investigator-dependent variability [2], quantitative analysis is increasingly being employed.
In this regard, several post-processing software packages (so-called feature-tracking-based techniques) were introduced in recent years that allow for strain deduction from standard clinical cardiovascular magnetic resonance (CMR) datasets [3]. Although these software packages have in common that in theory they all enable clinically feasible strain assessment, the algorithms on which their feature tracking processes are based differ substantially. Until now, the impact of the underlying algorithm on the strain result validity has not been sufficiently explored. The aim of this study was therefore first to compare the agreement and reproducibility of the two most commonly employed optical flow strain assessment algorithms (non-rigid, elastic image registration, and blood myocardial border tracing) and second to compare the results with the current reference standard for quantitative wall motion analysis – CMR tagging.
MATERIAL AND METHODS
Study population
Controls (group A) and patients with aortic stenosis and associated hypertrophic cardiomyopathy (group B) were prospectively enrolled into the study between 2015 and 2017. Aortic stenosis was diagnosed and graded using echocardiography [4]. This study was approved by the local institutional review board. All subjects gave their written, informed consent before being included in this study. The study protocol conforms to the ethical guidelines of the 1975 Declaration of Helsinki.
Magnetic resonance imaging
Examinations were performed using a 1.5 T clinical magnetic resonance (MR) scanner (Ingenia, Philips Medical Systems, Best, the Netherlands). For functional analysis, retrospectively gated SSFP sequences were acquired in the standard cardiac axes [5]. The ejection fraction was assessed in short-axis bSSFP sequences with a minimum of 12 short-axis slices and 30 phases reconstructed per slice. To allow for the highest congruency between tagged and bSSFP images, additional sets of bSSFP cine images with 25 cardiac frames per RR-cycle were acquired in the short-axis orientation at the midventricular level for the evaluation of optical flow-derived strain. Further scan parameters were: FOV 370 mm, TE/TR of 1.4/3.0 ms, flip angle 50°, slice thickness 8 mm, and in plane resolution of 1.4 mm. Tagged images were acquired in identical positions as short-axis bSSFP data sets using the same number of cardiac frames [2,5]. For tagged images the following parameters were used: complementary spatial modulation of magnetisation in a grid pattern with a grid-gap space of 8 mm; FOV 320 mm, typical TE/TR 6/33 ms, flip angle 25°.
Strain analysis
All images were analysed by an experienced reader (six years of CMR experience, six years of experience in strain analysis).
Tagging
Dedicated harmonic phase-analysis software (Tag Track, GyroTools Ltd., Zurich, Switzerland) was used to calculate midmyocardial strain. Short-axis circumferential strain values were derived from mid-left-ventricular short axis slices as previously reported [6,7]. Manually drawn midmyocardial track-lines are automatically propagated throughout the entire RR cycle using the grid crossing points as points of orientation. In case of faulty propagation, track lines were manually corrected.
Feature tracking analysis
Dedicated software was employed to perform feature-tracking strain analysis with a non-rigid, elastic image registration algorithm (Segment, Medviso, Sweden) and a blood myocardial border-tracing algorithm (TomTec, Germany). Short-axis circumferential strain was calculated with both feature-tracking software packages from the same midventricular short-axis slice as used for tagging analysis.
Strain assessment as performed by the TomTec software has been previously described elsewhere in detail [6]. Endocardial contours are drawn in an end-diastolic phase and then propagated automatically throughout the RR-cycle. In the case of faulty contour propagation, the endocardial trackline can be adapted in a selected phase, and the propagation process is then repeated.
For segment-based strain analysis endocardial and epicardial contouring is also performed in a diastolic phase after cropping (manually or automatically) bSSFP images to a necessary minimum (covering both cardiac chambers). Contour lines are then propagated automatically for all phases of the RR-cycle. In the case of faulty propagation endo- and epicardial contour lines can be corrected and re-propagated.
Strain analysis
To compare the precision and robustness of two common feature-tracking algorithms (non-rigid, elastic image registration; blood myocardial border tracing), peak systolic circumferential strain (PSCS) was computed with all software packages and then compared to tagging.
For comparison of regional strain, the left ventricle was divided into four equiangular segments. For consistency and in order to establish a standard model that allows for accurate segmentation, the RV upper-septal insertion point served as the partition between the first and second segment. Strain was determined for each of the four segments.
The various strain analyses using the different analysis software packges were performed with an interval of seven days in order to avoid bias.
Statistical analysis
Statistical analyses were performed using GraphPad Prism 7.0 (GraphPad Software, Inc., San Diego, CA). Results are expressed as mean ± SD. Normal distribution was tested with the D’Agostino-Pearson test.
To test for significant differences between the modalities Friedman’s test was used. In case of significance post-hoc Dunn tests were performed. P-values of < 0.05 were considered statistically significant. Additionally, PSCS derived from segment and TomTec were compared to tagging using the Pearson correlation coefficient for correlation and the Bland-Altman method [8] to assess agreement. Increased variance in reproducibility of tagging, segment, and TomTec was tested for using the coefficient of variation from duplicate measurements.
RESULTS
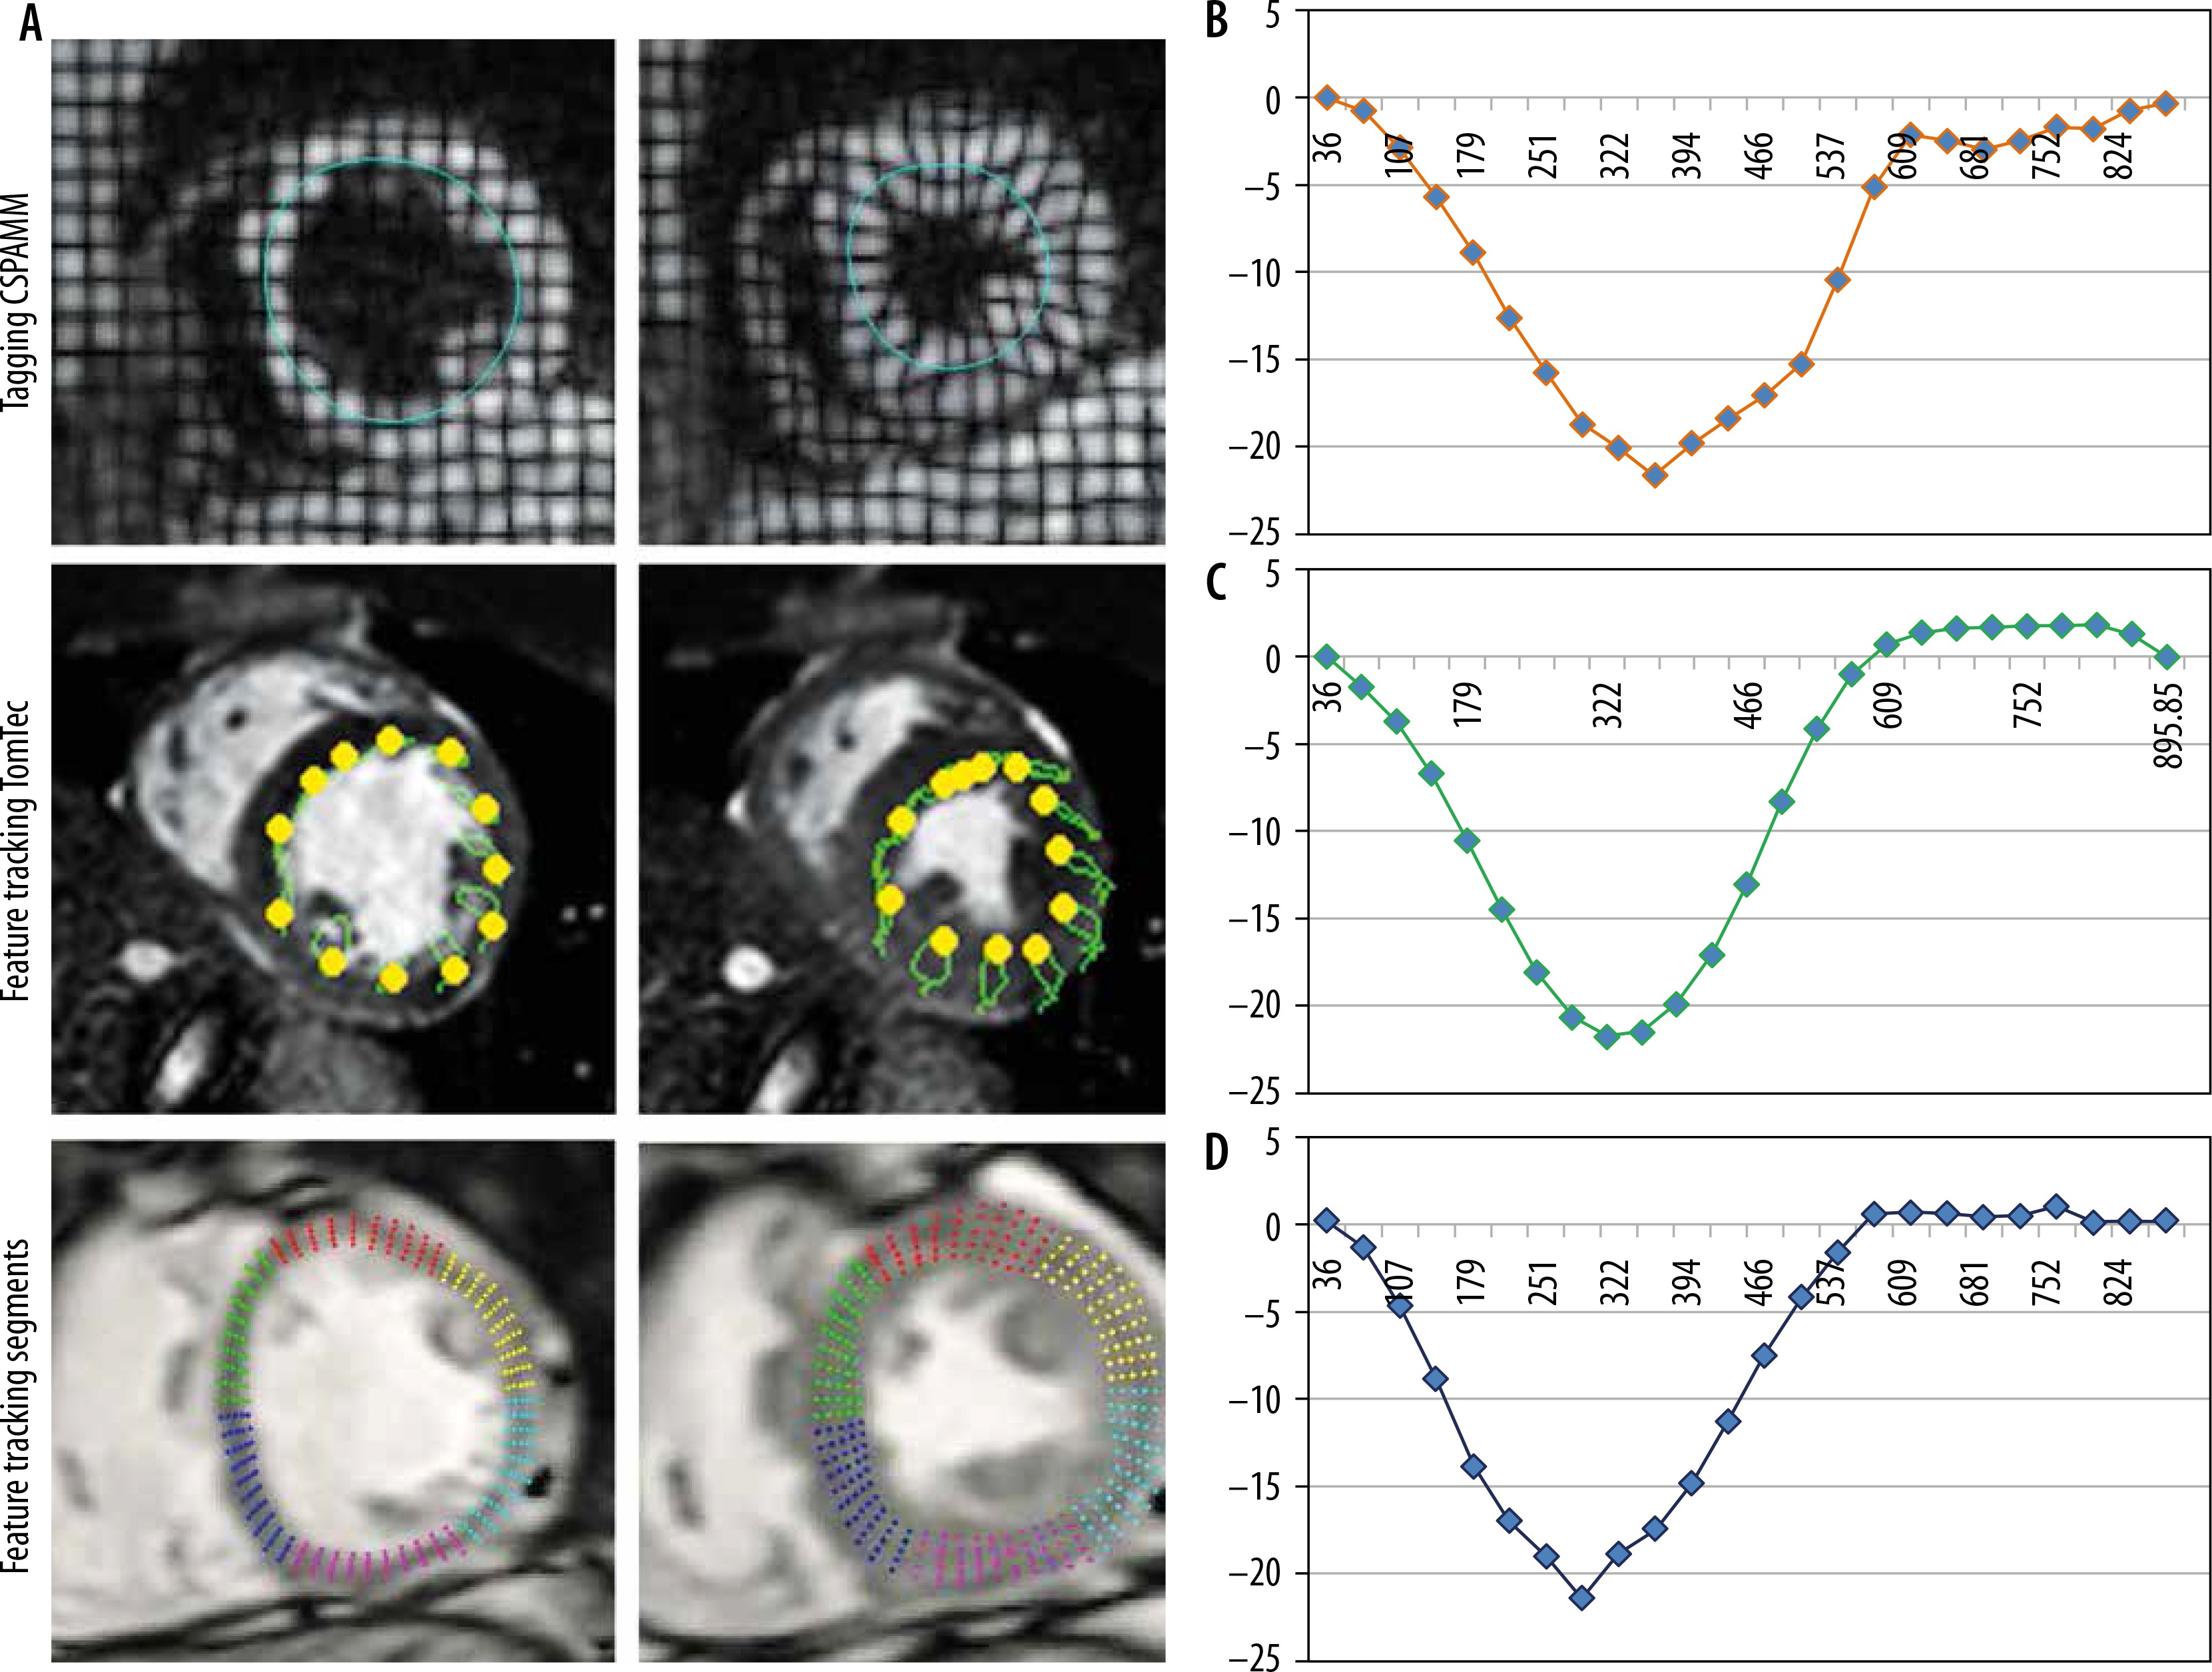
A total of 15 healthy controls (five female) (group A) and 15 patients (eight female) with aortic stenosis and associated hypertrophic cardiomyopathy (group B) were recruited from 2015 to 2017. The study protocol was completed by all participants. Table 1 summarises the baseline characteristics of the patients and healthy volunteers as well grading of aortic stenosis. Figure 1 shows examples of tagging and feature-tracking (non-rigid, elastic image registration; blood myocardial border tracing)-derived strain assessment as well as typical strain curves. Mean results for global PSCS are listed in Table 2.
Table 1
Baseline characteristics of the study population
Table 2
Results for peak systolic circumferential strain computed with tagging and feature tracking (segment and TomTec) for all subjects (grouped), healthy controls (group A), and patients with aortic stenosis and associated hypertrophic cardiomyopathy (group B)
| PSCS | Grouped (A + B) | Group A | Group B |
|---|---|---|---|
| Tagging (%) | –22.63 ± 2.6 | –21.5 ± 1.5 | –23.4 ± 2.96 |
| Segment (%) | –21.57 ± 3.43 | –19.9 ± 1.7 | –23.3 ± 3.9 |
| TomTec (%) | –21.463 ± 3.2 | –20.47 ± 3.2 | –22.52 ± 2.8 |
Figure 1
Midventricular short-axis circumferential strain assessment using tagging and feature tracking (segment and TomTec). Circumferential strain curves obtained with the tagging and feature tracking (segment and TomTec) software in a control subject
Intermodality/inter-algorithm comparison (tagging, segment, TomTec; pooled data of group A + B) for global PSCS using Friedman’s test revealed statistically significant differences (χ2 = 8.3, p = 0.0125). Post hoc tests using Dunn’s test showed that results from TomTec significantly differed from tagging (p < 0.05), while all other comparisons (tagging vs. segment; segment vs. TomTec) revealed no significant differences (p > 0.05 each). Intermodality assessment revealed the highest correlation between tagging and segment (r = 0.84), while correlation between tagging and TomTec (r = 0.36) and segment and TomTec (r = 0.5) were considerably lower. Intermodality Bland-Altmann testing revealed a higher agreement between segment and tagging (–1.071 ± 1.917 [95% limits of agreement {LoA}: –0.11 to 2.45]) than between TomTec and tagging (–1.173 ± 3.377 [95% LoA: –7.791 to 5.445]). Agreement between segment and TomTec was 0.102 ± 3.55 (95% LoA: –1.17 to 1.37) (Figure 2).
Figure 2
Bland-Altman plot comparing global PSCS derived by tagging and segment (top plot), tagging and TomTec (middle plot), and segment and TomTec (lowest plot). The Bland-Altman plots show the highest agreement between tagging and segment, whereas the lowest agreement is seen in the plot comparing segment and TomTec

Subgroup intermodality comparison (Friedman’s test) for both healthy volunteers (group A) and patients with aortic stenosis and associated hypertrophic cardiomyopathy (group B) revealed no significant differences between results.
Subgroup intermodality assessment revealed the highest correlation between tagging and segment for both group A (tagging – segment: r = 0.89; tagging – TomTec: r = 0.34; segment – TomTec: r = 0.35) and group B (tagging – segment: r = 0.53; tagging – TomTec: r = 0.18; segment – TomTec: r = 0.51).
Results of regional strain analysis are listed in Tables 3 and 4. Assessment of intra- and inter-observer reproducibility of PSCS (pooled data of group A + B) delivered comparable results for tagging (5.8 %/6.28%) and segment (6.2%/6.8%), while reproducibility of TomTec was slightly inferior (8.3%/9.05%).
Table 3
Tagging- and feature-tracking (segment and TomTec)-derived regional peak systolic circumferential strain
Table 4
Intermodality comparison (tagging and feature tracking) of regional peak systolic circumferential strain (pooled data of groups A + B) using the Friedman’s test and (in case of significance) the Dunn’s post hoc test as well as intermodality assessment of correlation (Pearson’s)
Segment-based feature-tracking strain analysis took 9 min on average (contouring 3 min, computation time 6 min). Both tagging- and TomTec-based strain analysis took 4 min on average (3 min contouring, < 1 min computation time), while image planning and acquisition of tagged images took an additional 2 min on average.
Discussion
Optical flow-based strain assessment is increasingly being employed to assess myocardial strain in both scientific and clinical settings as part of a comprehensive CMR analysis [9,10]. Although the various available feature tracking post-processing software packages have been validated individually [6,11], data regarding direct comparisons of the different strain computation algorithms is sparse, especially for regional data [12]. Furthermore, this is the first direct comparison of different optical flow-strain analysis algorithms including an additional comparison with tagging, the reference standard for strain assessment [13,14].
The main results of this study are that global myocardial strain measurements differed between TomTec (blood myocardial contrast algorithm) and tagging but also in between the two feature-tracking tools (segment and TomTec). Comparisons between segment and tagging, on the other hand, revealed no significant differences and good agreement.
The differing feature recognition and tracking algorithms may be the source for the deviating results. The TomTec tracking algorithm has been described in detail before [15]. In brief, TomTec employs a repetitive region search and, like many other optical flow strain computation tools, uses a blood myocardial border tracing algorithm (by advanced medical imaging development) [12]. The software recognises and categorises voxels along manually defined borders based on a number of visual properties (e.g. inhomogeneity and grey level). A predefined number of voxels are summarised to clusters. Using probable pattern correspondence these voxels are then redetected in the following frame. This process is repeated for all phases of the RR cycle. This technique has the advantage that the tracking process is very fast, even close to real time, because the number of tracked features and thus also the computational intensity is limited. The disadvantage is that the tracking is only performed on a rather small amount of voxels on the endocardial border, which makes this method potentially more sensitive to image imperfections and possible tracking errors [16]. Only high contrasts between myocardium and left ventricular blood pool as well as between myocardial voxel clusters ensures reliable tracking [17], otherwise tracking errors will lead to misinterpretation of LV-strain.
The segment feature-tracking software registers all voxels from an image (or a predefined region) and then warps that information to a second image using non-rigid deformation. In this way motion fields can be calculated for entire images. Because this is a computationally intensive process, images are typically cropped in the first step, to reduce the necessary voxel recognition and tracking to a minimum. This technique has the advantage that it is potentially more stable because more data points are included into the computation. The disadvantage is that strain calculation is computationally more intensive and therefore more time consuming, while the myocardial contouring/placing of track lines in segment is comparably fast as TomTec.
A known drawback of optical flow-based strain assessment is the low regional resolution [13,18]. Supporting this notion, significant differences were found for regional strain results between both tagging and TomTec (anterior, septal, and lateral) as well as between tagging and segment (anterior and lateral). Although not all regional results significantly differed from tagging and the correlation was even good for some regions (Table 3), in total the results still differed to an extent preventing reliable clinical and scientific use. It has to be considered that all feature-tracking methods calculate strain based more on an “estimation” of the myocardial deformation than on an exact deduction (as done with tagging methods). The occurrence of small errors during strain computation is unavoidable due to multiple effects (e.g. out of plane effects or the occurrence of contrast differences at the tracking contour due to flow turbulences). These errors are usually uncorrelated between the different regions and the different phases. As global strain calculation is composed of multiple values deducted from multiple regions in multiple phases, uncorrelated errors are partially eliminated during computation. This, at least partially, explains why global strain is more accurate and reproducible than regional strain for both segment and TomTec. In comparison to the blood myocardial tracing algorithm (TomTec), the non-rigid, elastic image registration algorithm (segment) incorporates more datapoints in the calculation of both regional and global strain. This serves as an explanation why of the two feature-tracking software packages segment is more precise on both a global and regional level.
Supporting the results of several previous studies investigating the TomTec software [6,19,20], analysis of reproducibility revealed increased variability. In comparison, reproducibility of segment was superior to TomTec and even comparable to tagging. These results are in line with a previous report by Barreiro-Perez et al. [12], who investigated inter-vendor agreement of optical flow-based strain-assessment software and found a clear outperformance of segment in comparison to the other software vendors.
In subgroup comparison (healthy volunteers vs. patients with aortic stenosis and associated hypertrophic cardiomyopathy), segment detected the most severe strain differences, while TomTec-based analysis revealed the lowest differences. While TomTec measures strain at the endocardial border [21], segment averages the strain over the entire myocardial wall. In healthy volunteers circumferential strain is physiologically the highest at the endocardial border [22]. In patients with aortic stenosis endocardial strain may be increased (typically found in early stages of disease) or reduced (typically longitudinal strain rather than circumferential strain) resulting from the chronic LV pressure-overload leading to subendocardial ischaemia and myocardial dysfunction [23]. The current study collective consisted of patients with predominantly mild and moderate aortic stenosis. Therefore, we expect the lower strain values of FT to be a result of underestimation [16], rather than a result of underlying subendocardial dysfunction.
Limitations
The number of patients (n = 15) and controls (n = 15) included in the study was small. However, because both intra- and interobserver reproducibility were assessed, the total number of tests performed (n = 90) was large enough to demonstrate the higher precision and superior reproducibility of the non-rigid, elastic image registration algorithm (segment) in comparison to the blood myocardial border tracing algorithm (TomTec). Nevertheless, the number of subjects was probably too small to perform reliable subgroup analysis, which is why no significant differences were found in between the three strain assessment software packages. This study was conceptualised to evaluate the impact of feature-tracking algorithms on the validity of strain results, we therefore chose to only compare the most reproducible strain parameter (circumferential strain). Because both longitudinal and radial strain analyses have been shown to be more variable, these parameters were not additionally investigated.
CONCLUSIONS
This study demonstrates that the type of algorithm employed during feature-tracking strain assessment has a significant impact on the results. While strain values computed with the non-rigid, elastic image registration algorithm (as employed by segment) are more precise and reproducible, those computed with the blood myocardium tracing algorithm (TomTec) can be deducted significantly faster. The question remains whether a clinical implementation of feature-tracking strain analysis is already feasible at this time. The current algorithms either enable fast yet variable analysis or reliable yet time-consuming analysis.