


Introduction
Hypertrophic cardiomyopathy (HCM) is characterized by the presence of left ventricular (LV) hypertrophy in the absence of any aetiologies that result in such hypertrophy, including systemic and cardiac diseases, whether they feature sarcomeric-related mutations or whether they remain unresolved [1]. Myocardial fibrosis occurs in HCM and contributes to arrhythmias and even sudden cardiac death [2]. Fibrosis consists of combined interstitial and replacement types, with the characteristic cardiac magnetic resonance (CMR) pattern being patchy fibrosis in ventricular insertion points in late gadolinium enhancement (LGE) images [3,4].
The burden of fibrosis detected by LGE could not only predict sudden cardiac death and total mortality but also determine the need for an implantable cardiac defibrillator for primary prevention [5,6]. According to a study by Bru-der et al., myocardial fibrosis and scar were associated with a hazard ratio of about 5.47 for total mortality in asympto-matic patients during a 3-year follow-up [7].
Advanced feature-tracking cardiac magnetic resonance (FT-CMR) imaging has contributed to the diagnostic and prognostic evaluation of a diverse range of cardiac disorders in recent years. Different studies have concluded that LV myocardial strain, as measured via the FT-CMR technique, is a sensitive predictor of preclinical LV dysfunction [8,9].
Although the importance of myocardial fibrosis detected by CMR in the diagnosis and prognostication of HCM is well-established, only a few studies have thus far focused on the role of LV FT-CMR values in the prediction of myocardial fibrosis [2,10,11].
Accordingly, in the present study, we aimed to assess whether FT-CMR could reveal the presence of underlying myocardial fibrosis.
Material and methods
Study population
This retrospective cross-sectional research was conducted on 51 selected patients (51% female, mean age = 21 ± 5.2 years) with established HCM, who were referred to our tertiary cardiovascular centre between February 2018 and December 2019. All the patients had significantly increased LV mass index (≥ 110 g/m2 in males and ≥ 95 g/m2 in females) [12,13]. The exclusion criteria comprised more-than-mild valvular disease, evidence of obstructive coronary artery disease or myocardial infarction, and the presence of cardiac implantable electronic devices. All the patients underwent transthoracic echocardiography within 1 week before or after CMR examinations.
Cardiac magnetic resonance diagnostic criteria
HCM was defined as the presence of asymmetrical LV hypertrophy with maximal LV end-diastolic wall thickness of 15 mm or more in the absence of other conditions of LV hypertrophy. The threshold for diagnosis was decreased in the presence of a positive family history or a genetic test of HCM (≥ 13 mm) [1,14]. The presence of patchy mid-wall fibrosis in anterior and posterior right ventricular (RV) insertion points and regions of maximum LV wall thickness was an ancillary diagnostic marker of HCM [15].
Cardiac magnetic resonance imaging technique
CMR was performed with a 1.5-Tesla scanner (Siemens Avanto, Erlangen, Germany) featuring an 8-element cardiacphased array receiver surface coil. Functional cine ECG-gated sequences were obtained with the patient having a breath-hold. Multiple views, consisting of the 2-, 3-, and 4-chamber views as well as the short-axis images, were obtained (field of view = 300 mm, imaging matrix = 156 × 192, slice thickness = 8 mm, without interslice gaps for short-axis images; repetition time/echo time = 31/1.2 ms).
All the CMR sequences were examined by an expert cardiologist. Additionally, an expert radiologist re-evaluated all the patients’ data.
Feature-tracking cardiac magnetic resonance
Following the definition of LV endocardial and epicardial borders manually in the end-diastolic phase in the 2-, 3-, and 4-chamber views as well as all the slices of the short-axis views, 3D deformation parameters were analysed off-line utilizing CVI 42 software (Circle CVi, Calgary, Canada) (Figure 1). Image brightness was changed manually to achieve the highest contrast between the endocardium and the blood pool. The strain percentage represented the amount of myocardial fibre change from the end-diastolic frame to the end-systolic frame.
Figure 1
A-D) Four-, two-, and three-chamber as well as short-axis cine functional images with defined endocardial and epicardial borders for strain analysis by feature-tracking cardiac magnetic resonance method in a case of hypertrophic cardiomyopathy. E) Bull’s eye plots and strain curve which depicts peak circumferential strain
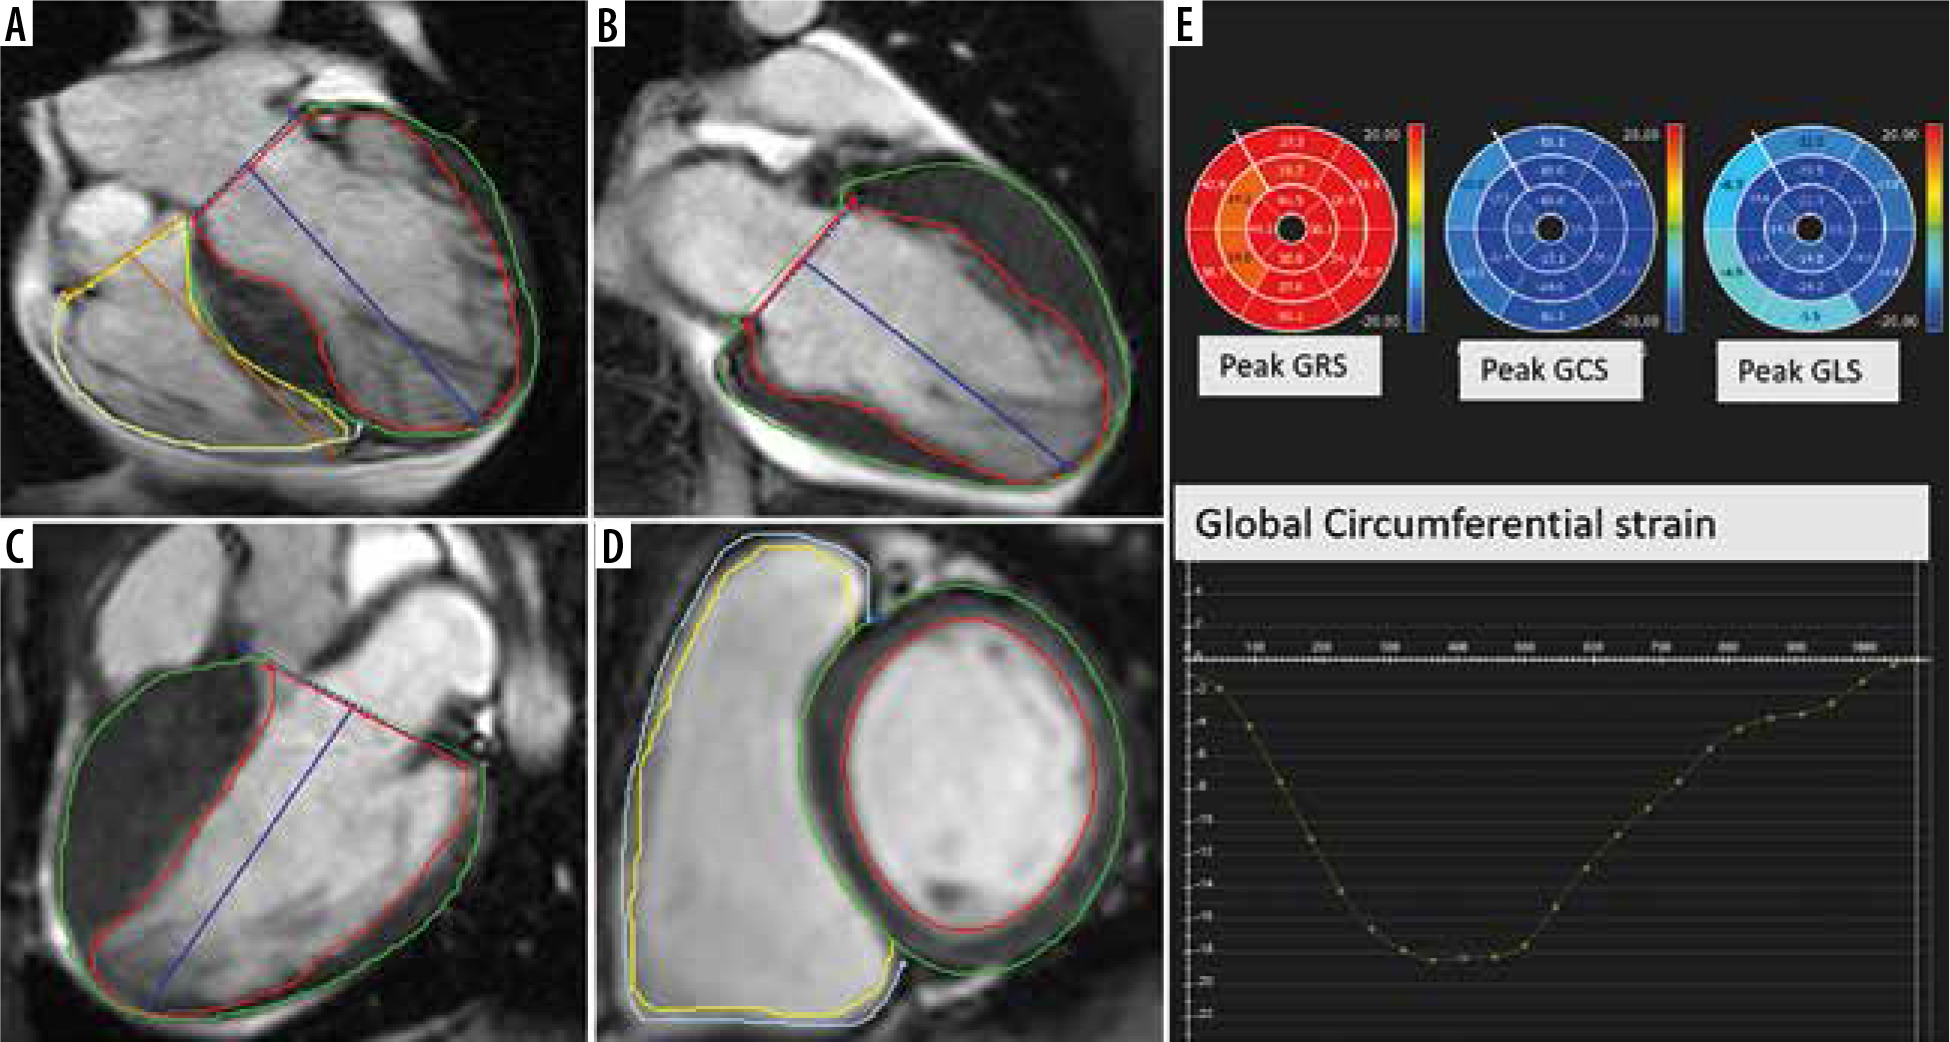
Longitudinal and circumferential values were depicted as negative numbers, given the shortening in muscle length from the end-diastolic view to the end-systolic view, while radial strain was described as a positive value due to myocardial thickening in the cardiac cycle. Regional systolic strain and systolic rates together with diastolic strain rates were determined in 6 basal and mid-ventricular segments, as well as 4 apical segments, in accordance with the myocardial classification of the American College of Cardiology/American Heart Association (ACC-AHA) [16]. For convenience, all the strain indices were depicted as an absolute value.
Late gadolinium enhancement
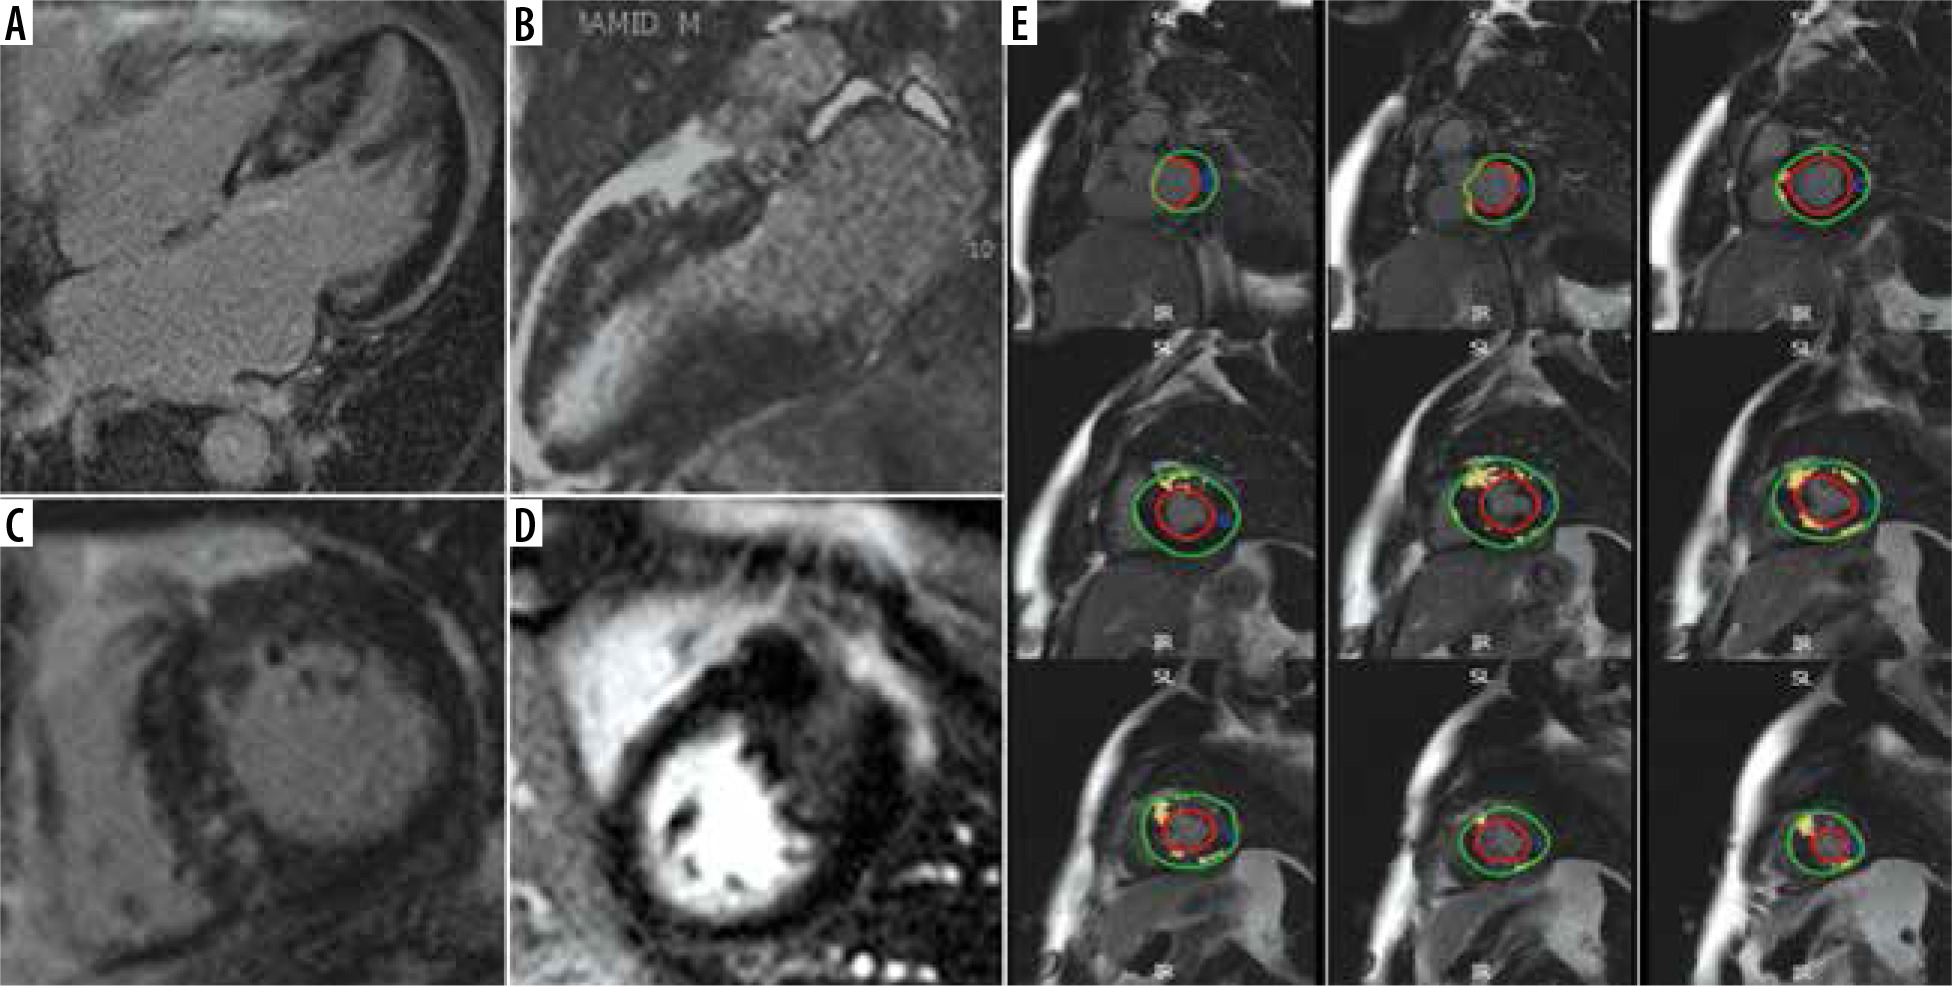
Ten minutes after the intravenous injection of 0.15 mmol/kg of the gadoterate meglumine (Dotarem) contrast agent, LGE sequences were obtained in a stack of short-axis and multiple long-axis projections to cover the entire LV myocardium. The inversion time of the normal myocardial region was determined via the scout sequence. The extent of myocardial fibrosis was assessed in the short-axis slices after the endocardial and epicardial borders of the LV were defined in all the stacks from the base to the apex of the heart. Within each slice, the normal myocardial region was traced, and all areas with the signal intensity of 5 standard deviations (SDs) above the standard values were determined [17,18]. Papillary muscles were considered in the blood pool and were not included in the myocardial mass calculations. Subsequently, the enhancement volume and the mass percentage were quantified as the proportion of the volume and mass of the myocardial region with fibrosis divided by the total LV mass, respectively [19] (Figure 2). Assessment of regional myocardial fibrosis was performed for each AHA myocardial segment at LV basal and mid-levels. Segmental myocardial fibrosis was defined as the presence of LGE in at least 50% of the volume of that segment based on visual assessment.
Figure 2
A-D) Four-, two-, and short-axis late gadolinium enhancement (LGE) sequence in a patient with hypertrophic cardiomyopathy depicts extensive patchy predominantly mid-wall fibrosis. E) Stack of short-axis LGE slices with endocardial and epicardial borders drawn. The small blue reference region of interest is marked to determine regions of fibrosis by the 5-standard deviation method
Echocardiography
The echocardiographic reports were evaluated, and the patients were divided into obstructive and nonobstructive types, based on LV outflow tract gradients of 30 mmHg or more calculated at rest.
Statistical analysis
The categorical variables were displayed as frequencies and percentages, while the continuous variables were reported as the mean ± the SD or as the median with the interquartile range depending on the normality of distribution. The correlation between the variables was tested using the Pearson and Spearman correlation coefficients, as appropriate. The differences between the 2 groups were assessed using a 2-sample t-test or the Wilcoxon rank-sum test depending on parametric or nonparametric data for the continuous variables. Additionally, the c2 test was applied for the categorical variables. The relationships between strain parameters and LGE characteristics were evaluated using correlation and linear regression analyses. The Akaike information criterion (AIC) model selection was employed to distinguish between a set of possible models describing the relationship between global strain measurements and total enhanced mass measures. The best-fit model, carrying 97% of the cumulative model weight, encompassed every parameter with no interaction effects.
In addition to the univariate logistic regression, a parsimonious logistic regression model was developed through a backward selection of each of the regional strain, global strain, and strain rate variables; they were selected based on the clinical relevance or significance of their univariate associations (p < 0.2) to determine the predictors of LGE measured by the amount of the enhanced cardiac mass. The Hosmer-Lemeshow goodness-of-fit test was drawn upon to summarize the discrepancy between the observed values and the values expected under the model in question. A p-value of less than 0.05 was considered statistically significant. The data were analysed using Stata software (StataCorp, 2015. Stata Statistical Software: Release 14. College Station, TX: StataCorp LP).
Results
The final analysis was conducted on 51 patients with established HCM. The mean age of the participants was 21.0 ± 5.2 years, and women comprised 51% (n = 26) of the study population. The mean ± SD for LV mass index was 121.53 ± 9.56 in males and 105.00 ± 8.64 in females. Most of the patients (58.8%, 30/51) were diagnosed with nonobstructive HCM, while 41.2% (21/51) had obstructive HCM. The systolic function of the LV was preserved in all the participants, with a median and interquartile range of the LV ejection fraction of 58% and 53-61, respectively. The mean enhanced mass was 15.2 ± 10.5% of the total LV mass. Table 1 demonstrates the demographic data of the study population.
Table 1
Demographic data of the study population
All global longitudinal strain (GLS), global radial strain (GRS), and global circumferential strain (GCS) values were comparable between the 2 groups of obstructive and nonobstructive HCM (p = 0.4, p = 0.3, and p = 0.1, correspondingly).
The univariate linear regression analysis established that both left ventricular end-systolic volume index (LV ESVI) (fitness [F] [1, 49] = 8.11 and p = 0.006) and left ventricular end-diastolic volume index (LV EDVI) (F [1, 49] = 6.6 and p = 0.012) statistically significantly predicted enhanced mass. The prediction ability of both LV indices remained significant after adjustments were made for LV outflow tract obstruction.
The univariate linear regression, performed to evaluate the predictive role of deformation parameters for total enhanced mass, demonstrated that GCS and GRS statistically significantly predicted total enhanced mass (%) (F =12.29 and p = 0.001 vs. F = 7.92 and p = 0.007, respectively) (Table 2).
Table 2
Univariate regression of global strains predicting total enhanced mass
Multiple regressions were run to predict the total enhanced mass of the LV from the GCS, GLS, and GRS values in Model I (Table 3). The inclusion of all the global strain values in a single model statistically significantly predicted the outcome variable (i.e. the ratio of enhanced LV mass) (p = 0.004); nonetheless, we computed multiple goodness-of-fit measures for each multiple regression model. As is presented in Table 3, GCS uniquely predicted total enhanced mass better than the combination of the other global strain values, with the greatest measures of AIC, AIC for small sample size (AICC), and Bayesian information criterion (BIC). After the inclusion of LV EDVI, the cardiac index, LV ejection fraction, and LV ESVI in Model III, LV GCS and LV EDVI together predicted total enhanced mass better than the other independent variables.
Table 3
Multivariate regression models of global strains predicting total enhanced mass
[i] AIC – Akaike information criterion, BIC – Bayesian information criterion, AICC – AIC for small sample size, GLS – global longitudinal strain, GCS – global circumferential strain, GRS – global radial strain, R – rate, LV – left ventricular, EDVI – end-diastolic volume index, CI – cardiac index, EF – ejection fraction, ESVI – end-systolic volume index
A univariate logistic regression analysis was also carried out to assess which regional strain or strain rate values could predict fibrosis in the same segment. The results are shown in Table 4.
Table 4
Univariate regression of regional left ventricular strain values predicting fibrosis in each segment
Discussion
In the current investigation, we assessed the role of non-contrast CMR parameters in the prediction of the amount of LV replacement fibrosis in patients with HCM and significantly increased LV mass index. The salient findings of our study are as follows:
Among all the global deformation parameters, including LV strain and strain rates, GCS was the single robust predictor of the amount of replacement fibrosis in our patients with HCM. Furthermore, GRS was another powerful predictor of fibrosis.
LV EDVI and LV ESVI potently predicted LV fibrosis. The combination of LV GCS and LV EDVI was the most powerful predictor of fibrosis, and this combination was more potent than each parameter alone.
Segmental strain values predicted the presence of LV regional fibrosis in approximately half of the LV segments.
No significant difference was found in global LV strain values between our 2 groups of obstructive and nonobstructive HCM.
Strikingly, our investigation revealed LV GCS, followed by GRS, as the most robust predictor of LGE. Bogarapu et al. evaluated 29 paediatric patients with HCM who underwent CMR. Patients with myocardial fibrosis demonstrated a reduction in LV GLS, GCS, and GRS, as well as the strain rate, especially in regions with evidence of fibrosis [2]. A finding of our research was that GCS was the best predictor of LV fibrosis. It is well-known that myocardial fibrosis mainly involves the mid-myocardial layer in patients with HCM and has a lesser tendency to involve the subendocardial or subepicardial myocardium. LV GCS is predominantly reproduced by mid-myocardial (mesocardial) fibres. As a result, we assume that the derangement of mesocardial myocytes by replacement fibrosis may affect circumferential strain earlier than radial or longitudinal strain. In another landmark study by Vigneault et al., FT-CMR could reveal subtle myocardial dysfunction in patients suffering from HCM with sarcomeric mutations. The authors remarkably demonstrated that the difference in endocardial/epicardial LV circumferential strain was higher both in cases of overt HCM and in HCM carriers [19]. This finding underscores the diagnostic value of deformation parameters, particularly circumferential strain, in the preclinical stage of HCM.
In the current investigation, we properly applied the signal threshold versus reference mean method for quantification of fibrosis on the LGE sequence. Regions with signal intensity 5-SD above the mean of reference myocardium were considered as areas of fibrosis. Based on previous studies, the threshold of more than 3-SD is associated with the highest accuracy with acceptable reproducibility. Moreover, it is mentioned that the 5-SD method provides the most congruity with visual assessment for estimation of the fibrosis extent [17,18].
Previous research has revealed an association between strain parameters and the presence of LV fibrosis. Popovic et al. demonstrated that all strain values were reduced in their patients with HCM despite the absence of myocardial fibrosis, while their subgroup with myocardial fibrosis had notably decreased LV GLS [20]. Another investigation showed that in patients with a history of myocardial infarction, deformation indices derived via speckle-tracking echocardiography were capable of differentiating normal and remote regions from infarcted segments [21]. This finding reinforces the valuable role of strain indices in the assessment of various pathological conditions that result in myocardial replacement fibrosis.
In the present research, we assessed the distribution of LGE in LV segments according to the AHA recommendation and demonstrated that in some myocardial segments, regional strain values predicted the presence of myocardial fibrosis [1]. Serri et al. reported that global strain was markedly decreased and basal longitudinal septal strain was significantly diminished compared with the other segments in their patients with asymmetrical HCM [22]. In a recent study on 26 HCM patients the results of logistic regression analysis reported regional circumferential strain as a strong predictor of segmental LGE. The authors concluded that FT-CMR, especially regional circumferential strain, reliably shows fibrosis-containing segments [23].
In a study on patients aged below 20 years, Smith et al. concluded that segments with LGE correlated with a decrease in GLS, GCS, and GRS and reported that LV fibrosis was a strong predictor of adverse cardiovascular events [24]. Interestingly, we found that in some myocardial segments, there was no association between regional strain and fibrosis, which may have been due to technical problems in the calculation of myocardial strain or the fact that there is no one-by-one association between the reduction in the LV regional strain value and the presence of segmental fibrosis. Moreover, we suppose that it might have been better to include segmental myocardial thickness as a contributing variable in the calculated strain value.
Our study revealed the ability of LV volume indices, including EDVI and ESVI, to predict concurrent myocardial fibrosis and HCM. Moreover, adding LV EDVI to LV GCS strengthened the power of the regression model, which implies that a combination of these parameters could help estimate underlying LV myocardial fibrosis. This finding, nevertheless, requires further elaboration in future studies.
In a study by She et al. on 44 obstructive and 108 nonobstructive HCM patients, maximum LV wall thickness and the subtraction of peak radial strain potently differentiated the 2 groups of patients [25]. We found that neither the burden of myocardial fibrosis nor global strain was statistically significantly different between obstructive and nonobstructive HCM as determined in rest echocardio-graphy. What needs highlighting in this regard is that we drew upon echocardiography reports for the assessment of LV outflow tract obstruction in our retrospective study. Such disparities in findings warrant further research with the aid of stress tests in this challenging field.
The strength of strain analysis in routine CMR lies in the fact that it confers additional information regarding the presence of replacement myocardial fibrosis in patients with HCM. We posit that FT-CMR–derived myocardial strain values could be added to the present risk calculators in HCM. Indubitably, however, further investigations are needed to shed more light on this notion.
The value of strain images is further highlighted in scenarios where patients whose susceptibility to renal insufficiency precludes the administration of gadolinium contrast agents and where the post-contrast image quality is unacceptable.
In this research, a notable limitation is that we did not apply the results of advanced CMR mapping techniques. Moreover, our study population consisted of only a medium-sized group of selected subjects from a single tertiary centre, who had notably increased LV mass index and a higher percentage of LGE enhancement in the CMR examination as expected. It is also worthy of note that the evaluation of prognosis is another issue of great significance that necessitates further large-scale multicentric investigations.
Conclusions
We conclude that in patients with HCM and significantly increased LV mass index, LV replacement fibrosis can be predicted by a reduction in LV GCS and an increase in LV EDVI. These unique CMR parameters may be useful to identify myocardial fibrosis in patients with HCM without the use of contrast agents.