Introduction
Oropharyngeal squamous cell carcinoma (OPSCC) has shown increasing incidence in recent decades due to an increase of human papillomavirus (HPV) distribution, especially among younger people. HPV-positive OPSCC cases now account for 70% of newly diagnosed OPSCCs in the United States of America [1]. Patients with a first diagnosis of oropharynx carcinoma often present with a locally advanced and surgically unresectable disease. But can tumour volume be an important pre-treatment parameter, like traditional TNM staging? Not only can the gross tumor volume (GTV) of oropharynx carcinomas be a pre-treatment parameter, but also three-dimensional images of OPSCC. In a clinical study [2] more accurate tumour volume estimation was shown to be an additional predictor between conventional radiotherapy (RT) alone, modern, highly conformal RT techniques, or more aggressive, combined treatment. Despite the fact that the eighth version of American Joint Committee on Cancer – Union for International Cancer Control (AJCC – UICC) does not use the GTV, we think that radiologists should report tumour volume in their conclusions. The idea of correlation between the GTV and the radiotherapy outcome is not new. The eighth edition reviewed staging system of oropharyngeal squamous cell carcinoma (TNM-System) from 2017 distinguishes between HPV-16-negative and HPV-16-positive tumours of the oropharynx. Today oropharyngeal cancers are treated with chemoradiation or first with surgery followed by radiation or chemoradiation. However, in our institute the management of OPSCC is performed in a multidisciplinary tumour board setting. The choice of the right treatment can be complex. After an internal tumour board decision for radiation therapy, our patients are addressed to an external Institute of Radiotherapy, where patients underwent intensity-modulated radiation therapy (IMRT) or volumetric modulated arc therapy (VMAT). GTV can predict local control at different head and neck subsites, and local recurrence is higher in large-volume tumours than in low-volume lesions arising in the same anatomic subsite [3-7]. Tumour volume and tumour response to RT have a profound influence on the dose required to control a given type of tumour, as well as other factors: the large number of stem cells which must be sterilised, intrinsic radio sensitivity, repair, rate of repopulation/regeneration during therapy, reoxygenation, and redistribution. Tumour control can be influenced by other mechanisms such as biological heterogeneity as the number of clonogenic stem cells, tumour microenvironment, or inter-cellular communication and genetic factors. An important factor influencing the RT outcome of patients with various types of tumours, including head and neck cancers, is that the clonogen number increases linearly with the tumour volume (TV) [8]. The TNM classification system for head and neck cancer incorporate only linear dimensions for a few tumour localisations. In the past, a two-dimensional approach in daily clinical practice or in measurement of TV or variations of TV are in use. Today, modern radiation oncology can precisely sculpt the radiation dose to target volumes while sparing multiple critical normal tissues such as the brainstem, optic chiasm, optic nerves, and the spinal cord.
Material and methods
Patients
Our internal institutional review board approved this study. Written informed consent was obtained from each patient. In this retrospective study we analysed 32 patients (74% men and 26% women) with histopathologically confirmed OPSCC between June 2018 and August 2019. Exclusion criteria were only poor-quality images (motion artefacts and from dental implants). All patients are listed in Table 1.
Table 1
Volume data of the different software types and their corresponding histopathology
Data acquisition and scan protocol
In our institute we used a dual-source CT scanner (Somatom Drive; Siemens Healthcare, Forchheim, Germany) with the patient lying supine on the table with their arms along their body. All CT examinations were obtained after intravenous administration of 100 ml of 350 mg iodine/ml iodinated contrast material (Iobitridol, Xenetix 350, Guerbet, France), at a flow rate of 2.5 ml/s, followed by a 50 ml saline flush, through an 18-gauge catheter placed in an antecubital vein using an automatic power injector (Medrad Stellant, Bayer). Scanning parameters are listed in Table 2.
Gross tumour volume calculation
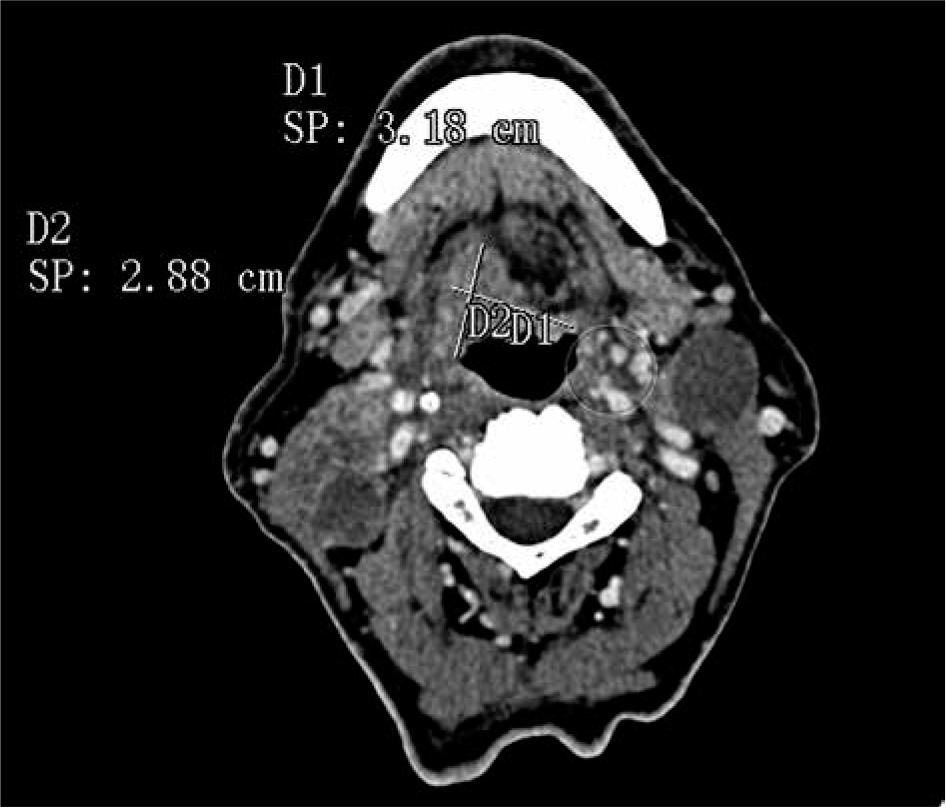
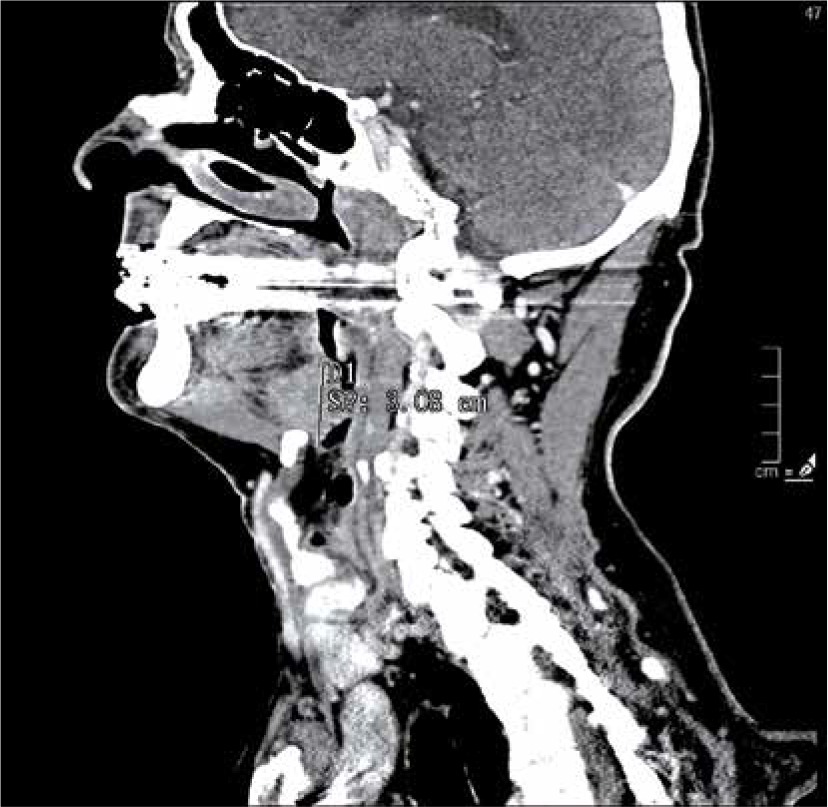
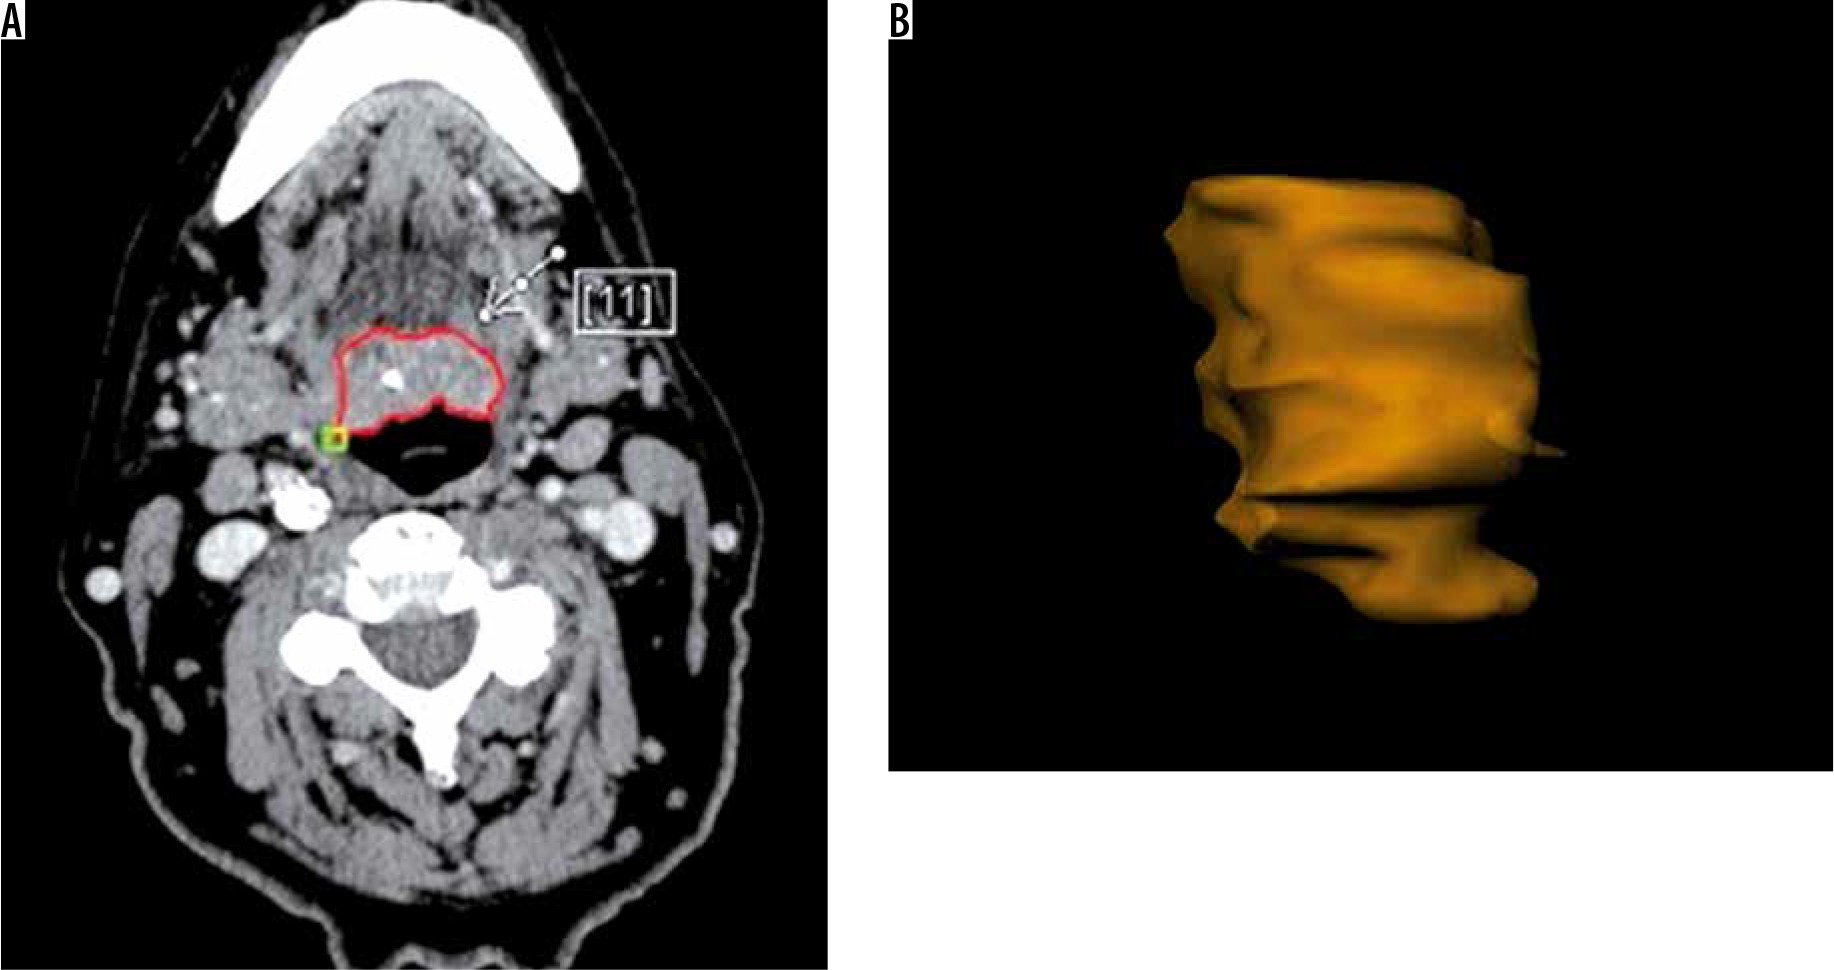
One radiologist calculated the TV manually measuring tumour length (L) and width (W) on the axial plane (Figure 1) and the height (H) on the sagittal plane (Figure 2). Then he calculated the TV using the formula 0.5236 × L × W × H (ellipsoid formula: volume = length × width × height × 0.5236) [9]. The other radiologist used syngo.CT-Liver-Analysis software to calculate the TV by contouring the volume only on axial CT images (Figure 3A). The advantage of this method is that a 3D model of the tumour is obtained (Figure 3B). Both volume-measuring methods were compared with the results of GTV-contouring method using 3D ProSoma software (MedCom, Darmstadt, Germany). In our radiotherapy department we use this software for organs at risk (OARs) contouring. We can build more treatment plans, and faster, and have more time to focus on delineation of GTVs and more time for our patients. The program allows the identification and contouring of the target volume and the creation of the clinical target volume (CTV). We also compared the times of the two methods: the first radiologist who used the simple formula needed on average one minute to determine the volume, while the second radiologist needed between three and five minutes with the syngo.via method, depending on the volume. The radiotherapist, on the other hand, needed between 1.5 and 2 minutes per patient with the 3D ProSoma software.
Statistical analysis
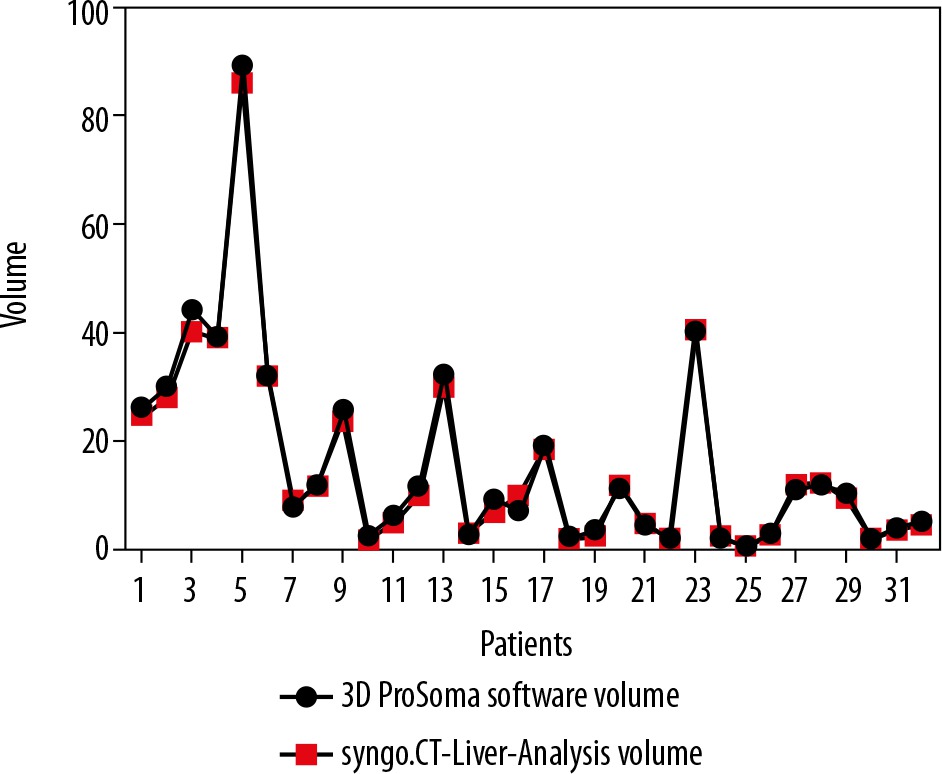
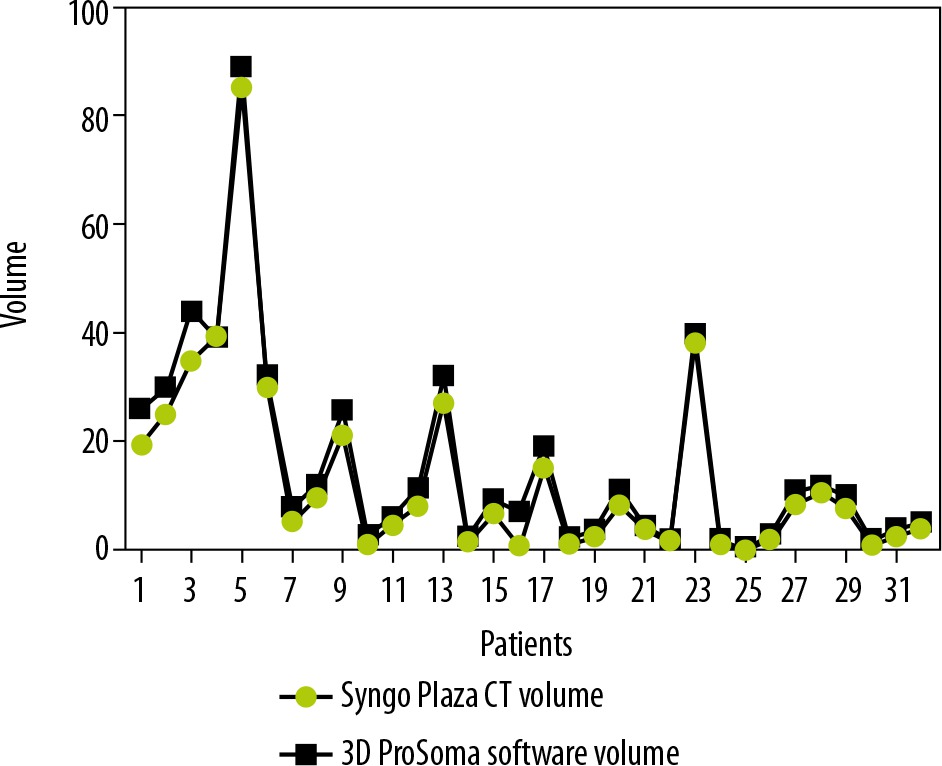
Graphpad Prism software was used for statistical data. To compare the two-volume calculating software packages we used the paired sample t-test. First, we compared the results from the ProSoma 3D software with the syngo.CT-Liver-Analysis software (Figure 4) and obtained a p-value of 0.0254 (assuming that a p-value less than 0.05 is statistically significant) and a correlation coefficient of 0.9980. The next step was a comparison between the results from the ProSoma 3D software with the Syngo Plaza software (Figure 5). In this case we obtained a p-value of 0.0001 and a correlation coefficient of 0.9943. The interobserver variability was calculated using the Bland-Altman method, from which the standard deviation (SD) between Syngo Plaza software and ProSoma 3D software was 2.1 and between syngo.CT-Liver-Analysis software and the ProSoma 3D software it was 1.34.
Results
Our study suggests that syngo.CT-Liver-Analysis software for GTV determination has a greater reliability than standard manual method with Syngo Plaza in comparison with the 3D ProSoma software, as used by radiotherapists.
Discussion
Traditionally syngo.CT-Liver-Analysis software is used for liver segmentation and for the identification of its vascular territories and subterritories, especially for liver surgery. Radiologists use this software to calculate and correct liver volumes, to compare resected and residual liver volume, for the segmentation of liver vessel tree structures, and to visualise tumour position in relation to vessels. Our goal was to find a new field of activity for this software. Radiotherapists and radiologists should communicate more with each other, especially because radiologists often have little knowledge about radiotherapeutic procedures. Limitations of this study are the small patient numbers and the use of only one radiological software package. In terms of time, we have seen that the method with the syngo.CT-Liver-Analysis software takes longer. The fastest method remains the simplest at present, although it must be said that the sensitivity decreases in comparison. Radiation therapy for head and neck cancer has evolved and has moved from 3-D conformal radiotherapy (3D-CRT) to intensity-modulated radiotherapy (IMRT). The main disadvantages of IMRT are the time-consuming treatment planning process and the larger number of multiple fixed-angle beams and monitor units (MUs), which increases the treatment delivery time. Volumetric modulated arc radiotherapy (VMAT) is a new radiation therapy technique in which treatment is delivered using a continuous arc motion of the gantry with simultaneous variation of the multi-leaf collimator (MLC) position, gantry speed, and dose rate with the ability to produce highly conformal plans in a short delivery time. In our institution oropharynx tumours are treated with sequential VMAT or VMAT-simultaneous integrated boost (SIB-VMAT) with Raystation software (Figure 6A and 6B). There are many fractionation schedules across institutions, but the most commonly prescribed doses are biologically equivalent to 70 Gy to gross disease and 60/54 Gy to suspicious nodes. At our institution we preferer a simultaneous integrated boost (SIB) with VMAT technique in which different dose levels are assigned to the various target volumes – dose 66/2.2 Gy to the GTV and a margin of protentional microscopic spread and positive neck nodes and 54/1.8 Gy to the clinically negative nodal regions. Thermoplastic masks are used to keep the patient in the exact position (Figure 7). The dose and fractionation may also be influenced by inclusion or exclusion of concurrent chemotherapy. Gross target volume (GTV-T) is defined by the radio-oncologist as the extent of the primary tumour, shown by imaging studies and physical examination, with margin of 5 mm around the obtained clinical target volume (CTV-T). Gross nodal disease is defined as focal nodal necrosis or heterogeneity, or as short-axial diameter > 10 mm (GTV-N) plus a margin of 10 mm for potential direct routes of microscopic spread (CTV-N) as reported in the DAHANCA guidelines [10]. Hence, the GTV and CTV are included in planning target volume (PTV) to account for patient setup errors. The CTV does not overlap uninvolved critical adjacent structures such the optic nerves or chiasm, even if the physician planned to minimise the dose to these structures. This is an issue for potential interobserver and intraobserver variability. Some problems in the tumour boundary definition on CT derives from the difficulty to separate the tumour from the peritumoral oedema area, which is excluded from the region of interest (ROI). For this reason, magnetic resonance imaging (MRI) is often used, which is more sensitive than CT in distinguishing tumours from normal adjacent structures. The use of MRI can reduce inter-observer variability [11]. Also, fluorine 18 fluorodeoxyglucose (18F-FDG) positron emission tomography (PET) provides not only anatomy but also noninvasive functional imaging and biological metabolism. FDG-PET is effective for defining GTV in radiotherapy planning for squamous cell carcinoma of the head and neck [12]. Tumour volume in HNC is often more strongly associated with local control than tumour stage. Variation in TV or GTV contouring are the greatest geometrical uncertainties in the entire treatment care process, and inadequate delineation can compromise the curative intent. In this context multidisciplinary collaboration between surgeons, radiologists, and radiation oncologists is mandatory to achieve improved tumour control via better TV definition.
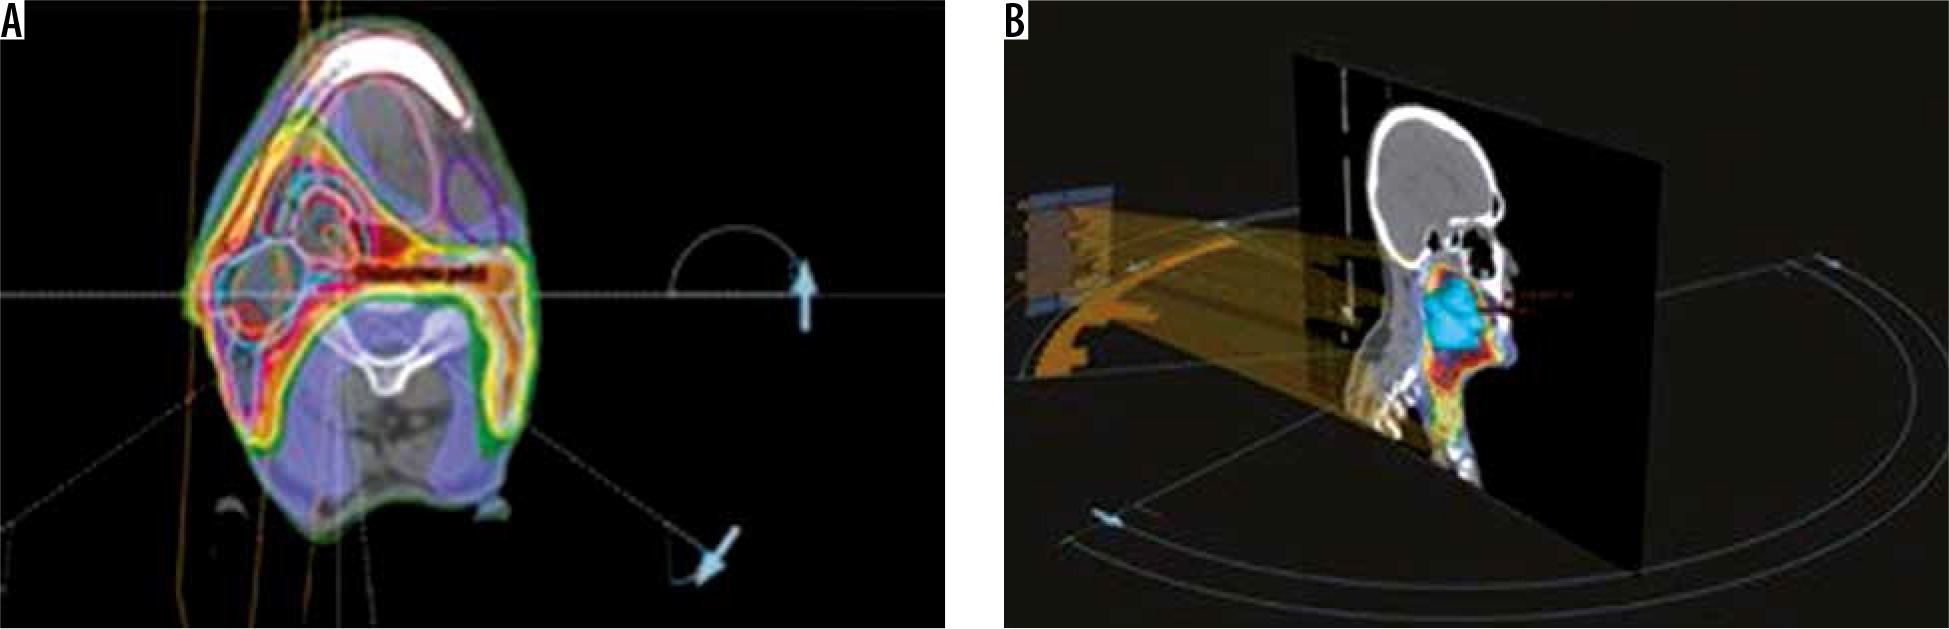
Figure 6
Examples of treatment planning software (ProSoma 3D) for oropharynx carcinomas with VMAT: 6 arcs are implemented in order to avoid shoulders (from arc angle 186° to 235°, 270° to 90°, 125° to 174°, clockwise and anticlockwise), help structures as spine expanded of 5 cm subtracted with PTV lowdose expanded of 0.6 cm was defined to minimise low-dose distribution outside PTV and around the spine