


Introduction
Traditionally, evaluation of cerebrospinal fluid (CSF) was based mainly on invasive procedures such as lumbar puncture, myelographies, radioisotope studies, or intracranial pressure monitoring, which yielded important information about CSF abnormalities in different disorders of the central nervous system (CNS). The results of these examinations have become a keystone for the most well-known concepts about CSF physiology and pathophysiology. Recently, rapid advances in imaging techniques have provided non-invasive methods for flow assessment, e.g. phase-contrast magnetic resonance imaging (PC-MRI), arterial spin labelling (ASL), or 3D-SPACE. Currently, PC-MRI is the best-known method and the only technique for both qualitative and quantitative evaluation. Constant development of magnetic resonance sequences enables new applications and improves knowledge of previously unknown CSF flow mechanisms.
The purpose of this paper was to review and evaluate recent applications and limitations of PC-MRI, regarding physical and technical fundamentals and the most up-to-date articles, with a special focus on normal pressure hydrocephalus (NPH), Chiari type I malformation (CMI), and a few other conditions.
Physiology of cerebrospinal fluid circulation
CSF is produced and absorbed simultaneously, occupying the ventricles, central canal of the spinal cord, and subarachnoid spaces. Eighty per cent of total CSF is produced by the choroid plexus (approx. 0.4 ml/min, 500-600 ml/24 h), almost 20% by the brain interstitium (brain parenchyma), and the smallest amount by ependymal lining of the brain ventricles and lining of subarachnoid space. Total CSF volume in an adult person is about 125-150 ml [1-3].
Being predominantly formed by plexus choroideus in the lateral ventricles (it generates slight pressure), CSF flows through the foramen of Monroe into the third ventricle, from which it is pushed via the Sylvian aqueduct to the fourth ventricle, than via the foramina of Magendie and Luschka to the subarachnoid spaces surrounding the brain and spinal cord. Although CSF is mainly absorbed by arachnoid villi (which generates low pressure, which completes the hydrostatic pressure gradient), drainage through the lymphatic vessels along the olfactory nerves in the cribriform plate and connection with the inner ear through the perilymphatic duct cannot be ignored [2,3]. Other cranial nerves (II, V, VII) and spinal nerves are also suspected to absorb a certain amount of CSF, but their role is considerably less significant. CSF is also a part of the glymphatic system, which is the paravascular compartment responsible for clearance of wastes and solutes, due to efficient exchange between CSF and interstitial fluid (ISF) [4,5]. Recently, failure of the glymphatic system is hypothesised to contribute to many pathologies, for example Alzheimer’s disease, because the β-amyloid is removed insufficiently [5,6]. The whole model of this paravascular pathway is much broader and is beyond the scope of this article.
Cerebrospinal fluid circulation in CNS compartments is composed primarily of two kind of motions – a bulk flow and pulsatile flow. The bulk flow is based on a hydrostatic pressure gradient primarily between the plexus choroideus and arachnoid granulations, which creates slow, discrete motion of CSF, impossible to measure with PC-MRI [2-4]. Pulsatile flow is based on the Monroe-Kellie doctrine which states that the sum of blood, CSF, and brain parenchyma volumes is constant, limited by the volume of the skull; therefore, an increase in one compartment leads to a decrease in another one [7]. It results in backwards flow of the CSF during the contraction of the heart, and forward flow during the diastole of the heart (“to and fro” flow, throughout the cardiac cycle). Likewise, the respiratory cycle contributes to CSF flow – variations of intrathoracic pressures evoke changes in the epidural venous plexus [8]. Contrary to bulk flow, pulsatile flow can be examined with PC-MR sequence. Mean velocity of CSF (about 5-8 cm/s) for velocity encoding gradients and precisely selected parameters are crucial to receive objective and comparable values. Moreover, recent studies imply that the whole process of CSF motion seems to be more complicated and reveal the need for further exploration [9].
Phase-contrast technique
Phase-contrast MRI is a technique that provides qualitative and quantitative assessment of a moving fluid; thus, study of the CSF flow became one of its major applications. The keystone of PC-MRI is a bipolar gradient (gradient with the same positive and negative magnitude and the same application time of both), which is placed in a sequence after the radiofrequency pulse, and before data collection during echo time (TE). If the bipolar lobe is applied only in one axis, the gradient sensitises the image to the flow in just one direction. Knowing that, applying the bipolar gradient in all three axes is necessary to develop a sequence sensitive to flow regardless of the direction [10].
The principle of the bipolar gradient is to develop a phase shift of spins moving with a specific velocity along the direction of the axis (Figure 1) – spins moving in the direction of the bipolar gradient acquire a positive net phase shift (represented as white colour in the phase images of PC-MRI sequences), while spins moving in the opposite direction to the gradient acquire a negative net phase shift (represented as black colour in the phase images of PC-MRI). The amount of acquired net phase shift is directly proportional to the flow velocity and time of bipolar gradient application (in range from 0 to +π or –π). It explains the significance of choosing a proper velocity parameter – velocity encoding (VENC) – that is matched by the magnitude and width of the bipolar gradient [10,11].
Figure 1
Phase shift during the application of bipolar gradient. 1. Stationary spins (blue line) acquire the same amount of negative phase shift and positive phase shift as the bipolar gradient is applied. 2. Spins moving in the opposite direction (yellow line) acquire negative phase shift because they are more prone to negative lobe of the bipolar gradient – they are more exposed to a higher magnetic field in the opposite direction. 3. Spins moving in the same direction (pink line) acquire higher positive phase shift as the positive lobe of the bipolar gradient is applied – they are exposed to the increased magnetic field with the direction of the flow
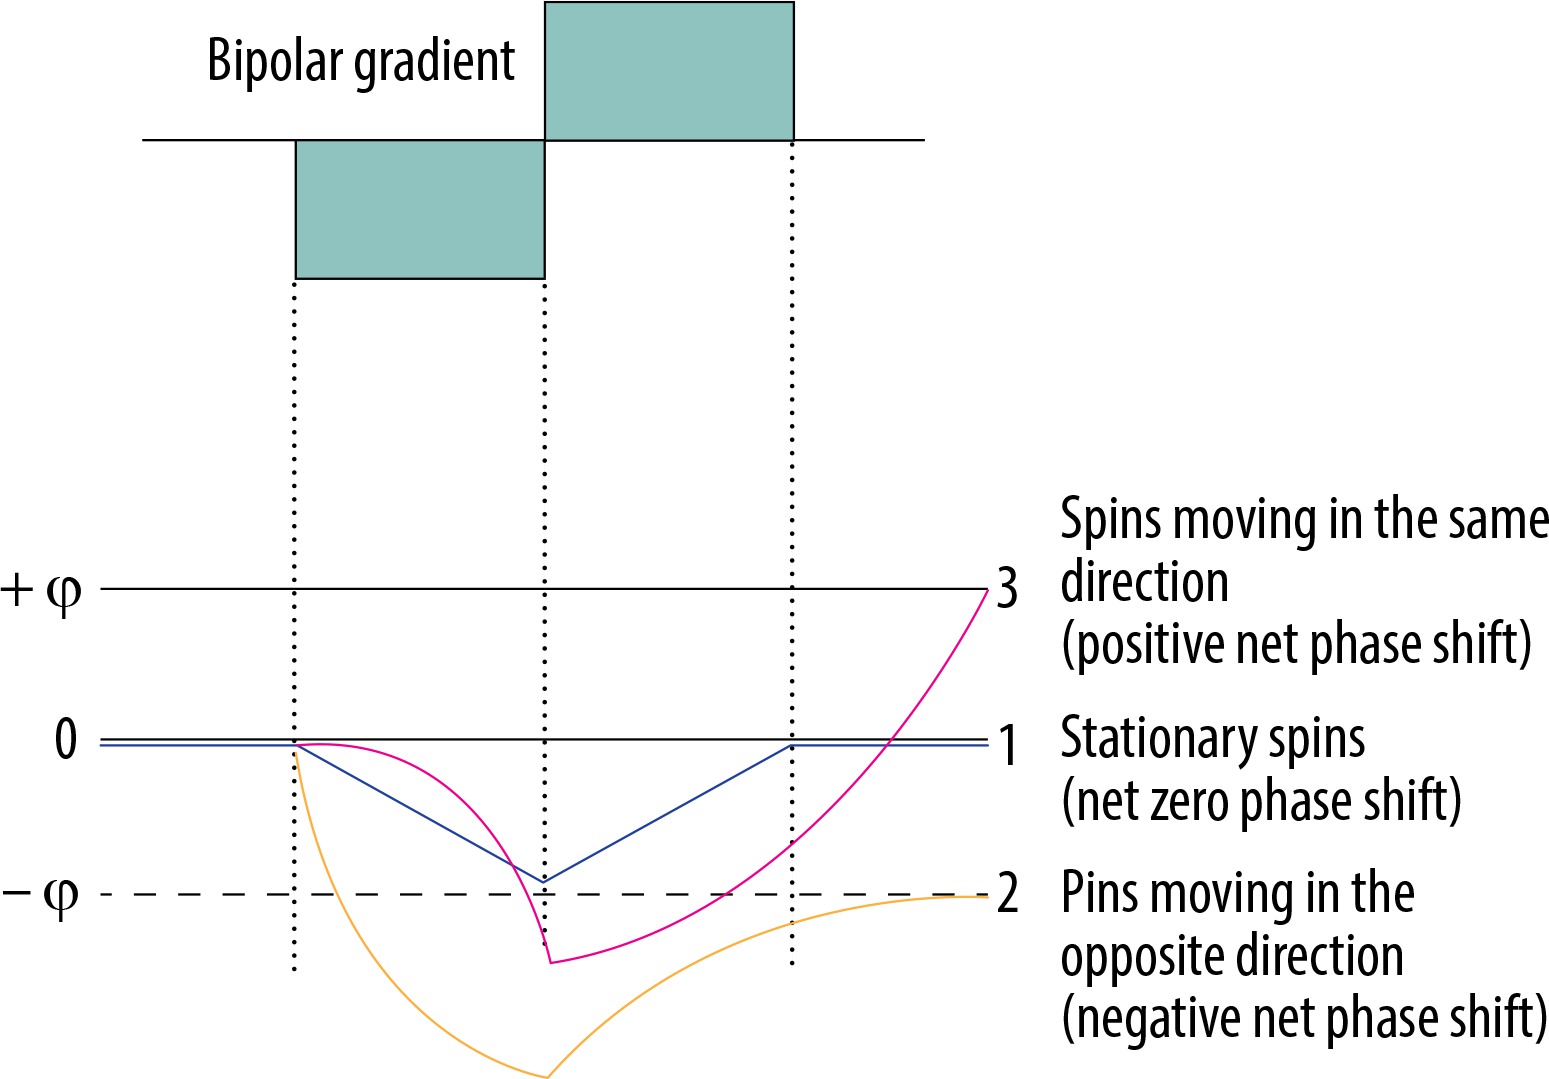
Stationary tissue spins obtain the same amount of negative phase shift from a negative lobe of the bipolar gradient, and positive phase shift from the positive lobe. Lack of any motion throughout the acquisition, i.e. staying in one location and experiencing the same amount of gradient pole strength in opposite directions, results in a zero net phase shift (Figure 1). Each time, the PC-MRI sequence must take an additional set of images without any bipolar gradient applied (reference images), to subtract data from the velocity encoded image. Only the signal of stationary spins is identical in both sets of images and is subtracted. This results in an image with the signal only from flowing spins.
A crucial parameter of every PC examination is VENC, which is directly connected with the properties of the bipolar gradient. The magnitude |G| defines the maximum positive (+π) and negative (–π) range of phase change. Underestimating the VENC value (fluid has higher velocity than assumed) leads to aliasing artefact (Figures 2 and 5). For that reason, it is strongly advised that a VENC is selected at slightly above the mean velocity of the investigated fluid. A typical velocity encoding value is 10 cm/s for CSF traversing through the foramen magnum and 8 cm/s for CSF traversing through the cerebral aqueduct. In some pathological conditions, e.g. in aqueduct stenosis, it may be necessary to select VENC higher than normal because of the higher velocity through the stenotic area. However, overestimation of velocity encoding leads to a low signal acquired from the flow and a low signal-to-noise ratio (SNR).
Figure 2
Reliance between phase shift and velocity encoding value. In the first example VENC equal to 20 cm/s will influence flow of –10 cm/s and +10 cm/s, causing phase shift –90o and +90°, respectively. In the second example analogous changes are visible; however, because of a faster flow, the acquired phase shift is more pronounced. In the third example, the velocity of 25 cm/s exceeds the VENC value, thus exceeding a 180° phase shift (red arrow) – it causes an aliasing artefact. This flow would be indistinguishable from a flow of 15 cm/s in the opposite direction
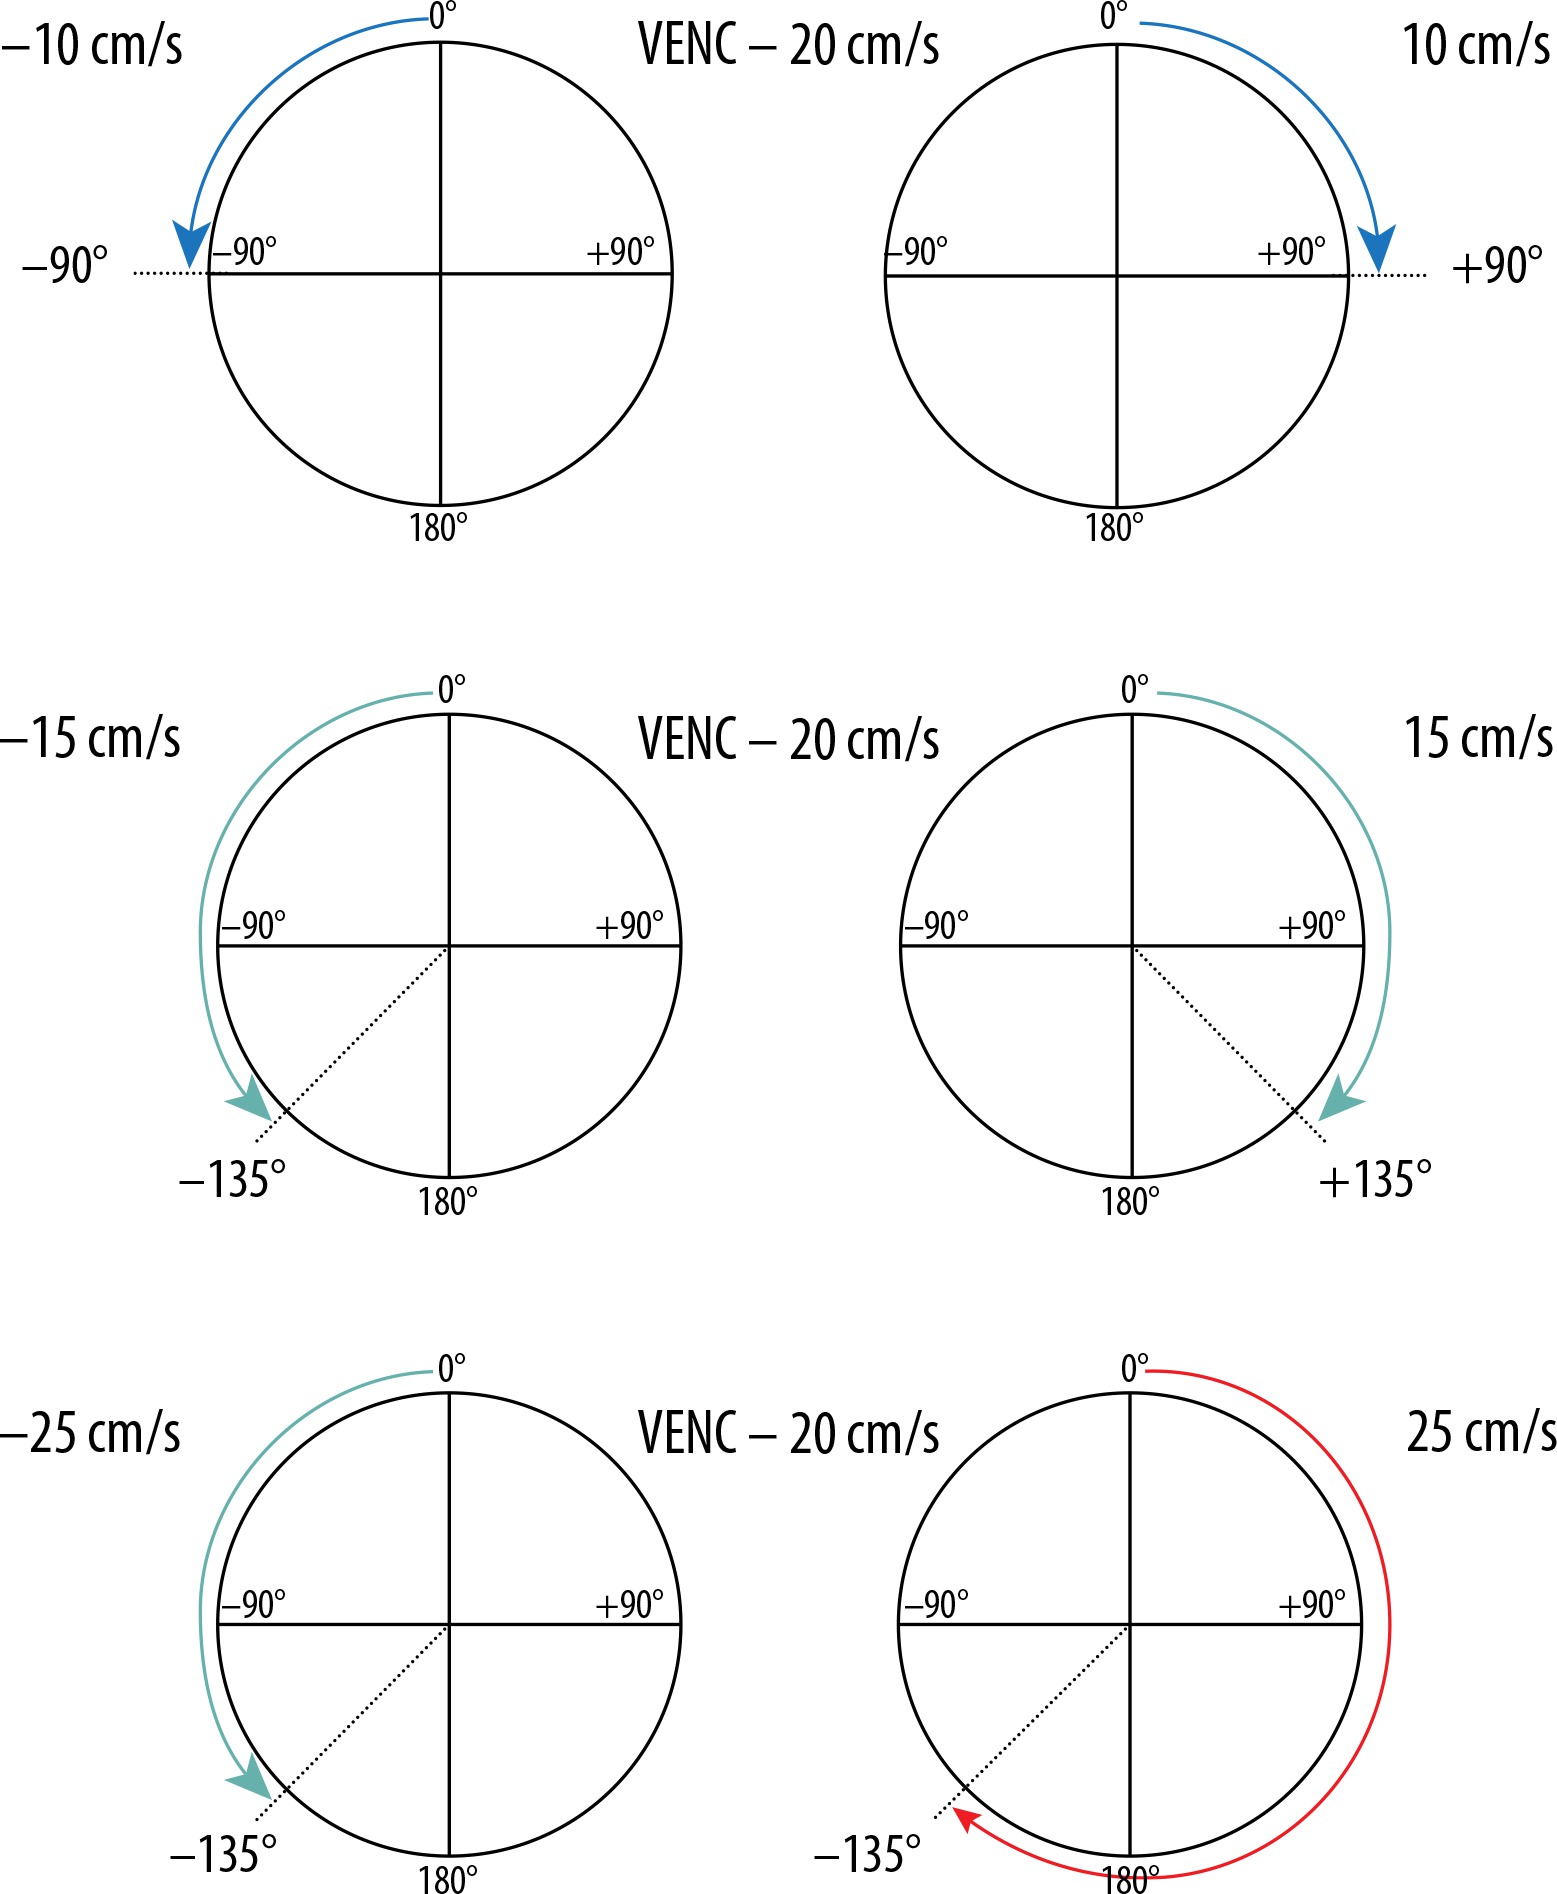
Figure 3
Magnitude (A) and phase (B) images. The magnitude image – flow is represented as bright signal, while stationary tissues are shown as a black background (signal is suppressed). The phase image – direction of the flow is encoded due to phase shift of flowing spins. The forward flow is represented as a bright signal, contrary to the reverse flow represented as a dark signal. Stationary background tissues are mid-grey

Figure 4
Flux curve and parameters of flow derived from the phase-contrast images. Region of interest (ROI) was placed in the perpendicular intersection of the aqueduct (red arrow). Images were acquired with velocity encoding value (VENC) = 12 cm/s. The flux curve represents the flow plotted against cardiac cycle. The values were obtained and calculated from the ROI. Several parameters can be calculated from the selected ROI. Stroke volume, mean velocity, and peak velocity are mostly used for quantitative comparison, with the stroke volume being the most comprehensive

Figure 5
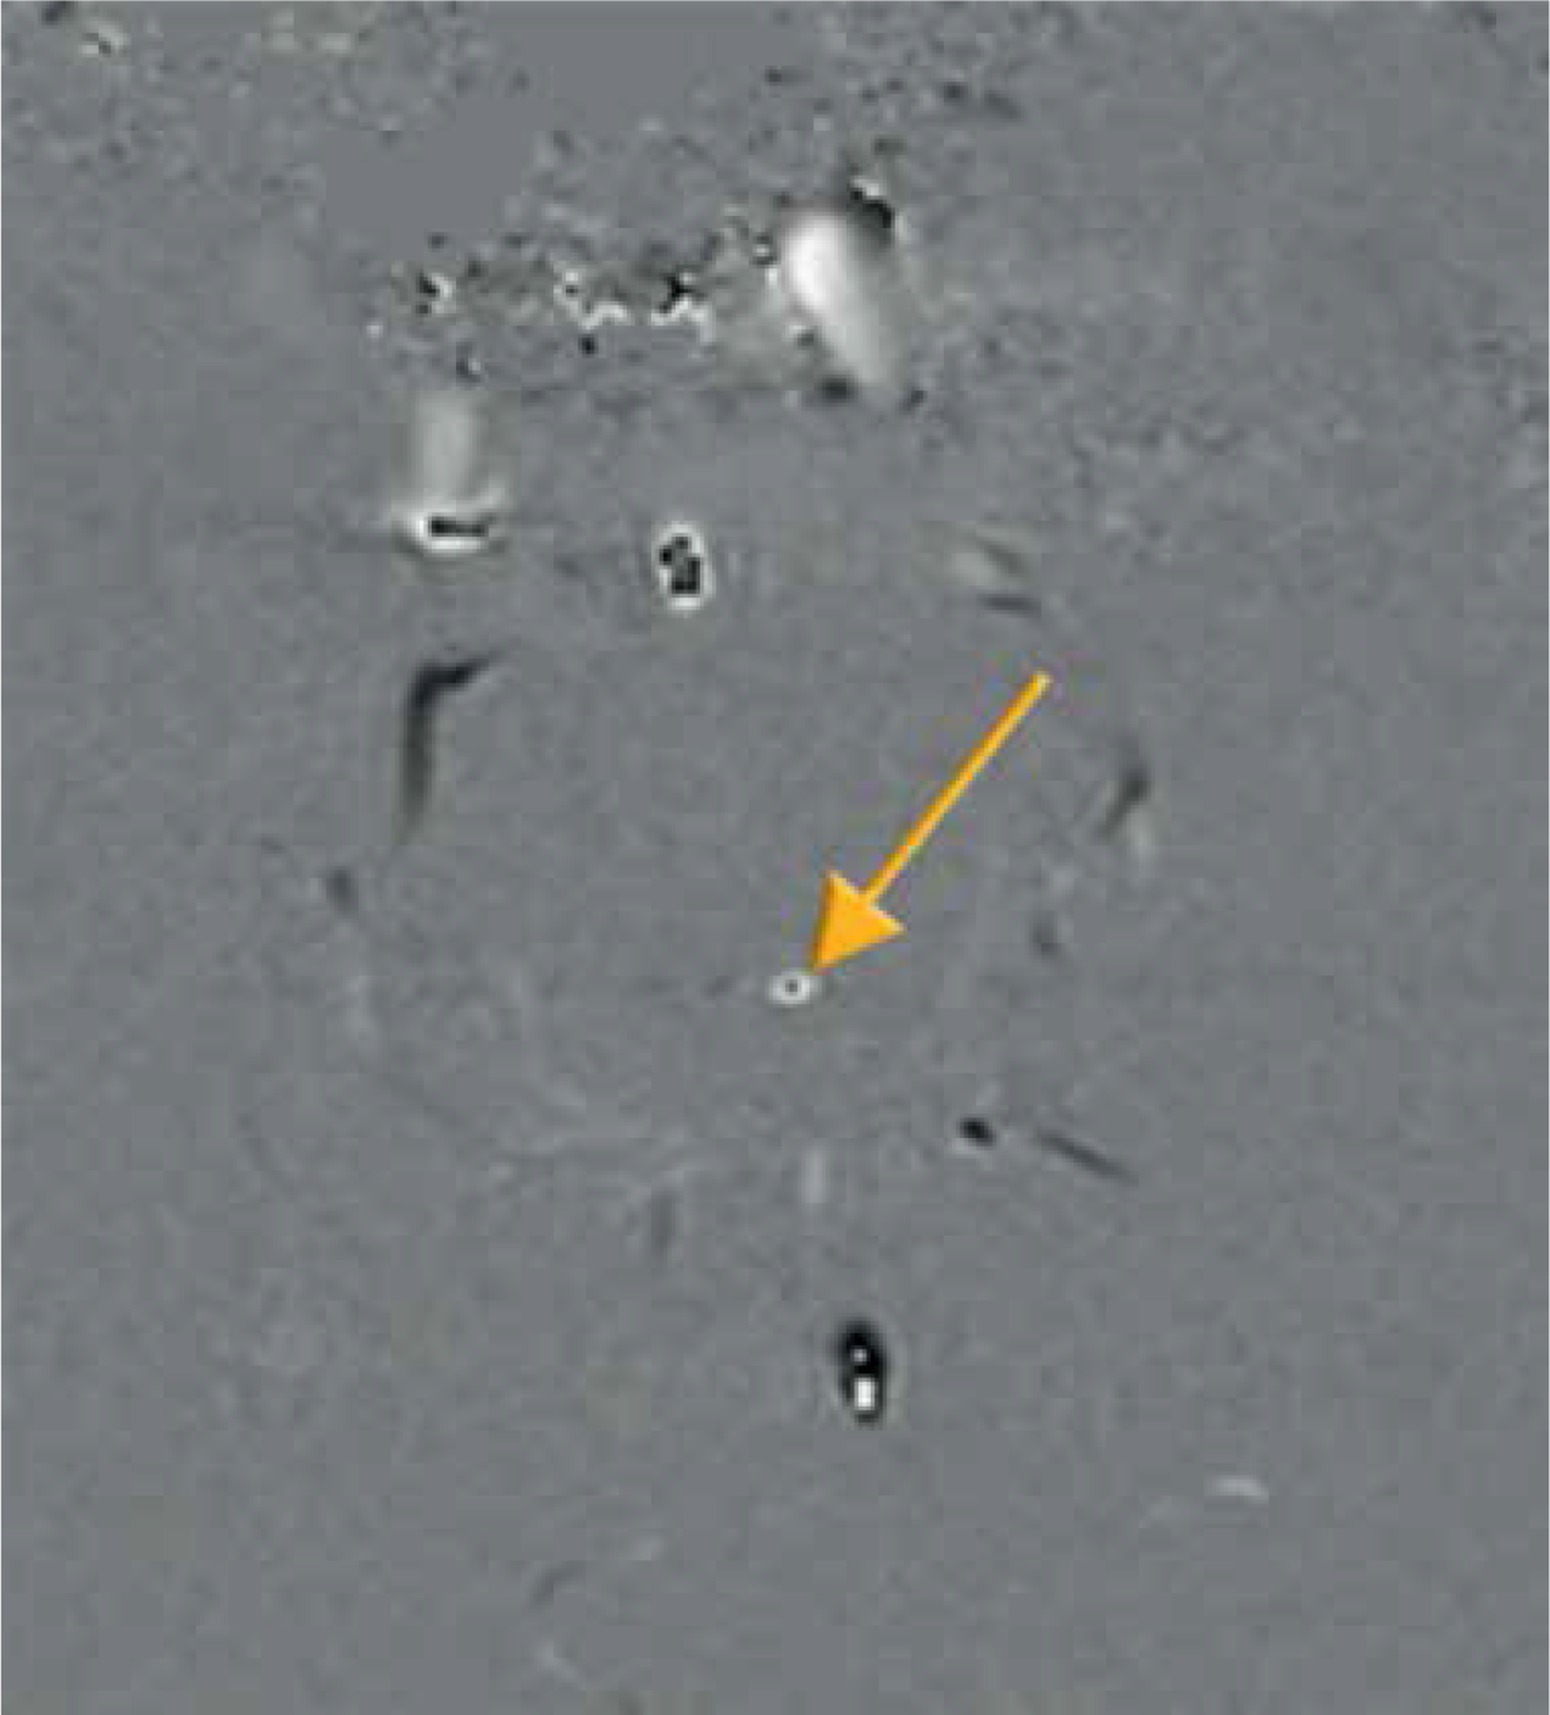
Aliasing artefact in the phase image (yellow arrow). Flow velocity in the centre of the aqueduct is higher in comparison to selected velocity encoding values. Underestimation of velocity encoding leads to incorrect mapping of the flow in the centre, as a flow in the opposite direction (black point)
Phase-contrast MR images consist of magnitude and phase images (Figure 3). The magnitude image represents flowing CSF visualised as a bright signal, while stationary tissues are supressed, shown as a black background. The phase image is phase-shift encoded (through-plane or in-plane), with white signal and black signal representing forward and backward flows, respectively. Being phase-dependent, it comprises the velocity information, which can be quantitatively estimated. Pulsatile CSF flow can be displayed in both type of images, thanks to PC-MRI gating with the cardiac cycle. A prospective or retrospective gating must be performed, to map pulsatile flow data on heart action and to increase the signal-to-noise ratio. As has been proven, the retrospective gating, based on assigning and averaging the signal to specific cardiac phases, is more reliable than the prospective one [12]. Likewise, PC-MRI sequence acquire signal from a few minutes of flow, which is averaged and plotted in relation to cardiac phases. CSF flow during the cardiac cycle may be displayed as the cine loop.
Phase-contrast MRI as a method of flow imaging is not free of limitations and pitfalls. First of all, quantitative assessment of mean peak velocity, peak systolic velocity, and stroke volume (Figure 4) is possible only in one plane exactly perpendicular to the unidirectional flow (jets), to prevent a partial volume effect. Evaluation of a multidirectional flow that could be objectively calculated in multiaxial planes is out of reach in 2D and 3D phase-contrast MRI – this is why this technique is not useful for assessment of the flow inside (sub)arachnoid cysts, the reflux flow from the third ventricle to lateral ventricles, or other types of turbulent flow [13,14].
Secondly, methods of manual segmentation (instead of semiautomated techniques) and manual region of interest (ROI) placement are responsible for interobserver and intraobserver variability in the collected data. A size of the ROI affects stroke volume, flow rate, and mean velocity values. Only peak flow velocity is ROI-independent. However, acceptable repeatability and sufficient accuracy were proven, and only discrete changes in data were detected due to the mentioned reasons. Stroke volume was also established as very accurate and least variable in the case of patients with NPH [15,16]. Plane selection in relation to the anatomic region of the aqueduct may also affect the overall obtained values, but these inequalities were found to be insignificant based on healthy volunteers [17]. Regardless of widely acceptable repeatability of the CSF flow using PC-MRI, highly specified guidelines for this examination are crucial to obtain comparable and reliable data between different studies.
Some other factors influencing the results must also be mentioned. Yamada et al. pointed out that PC-MRI is a technique providing heart cycle-related, averaged data from a time window of just a few minutes, completely neglecting respiratory-associated CSF motion and real-time, multidirectional CSF flow jets [14]. This is why time-SLIP (as a subtype of arterial spin labelling) is recommended to visualise several seconds of CSF flow pattern, e.g. a turbulent reflux flow between the Sylvian aqueduct and the third ventricle, and other flow disturbances impossible to detect with PC-MRI [9,14]. Utility of time-SLIP in NPH patients is still a subject of ongoing research. Its capability to depict flow within the cyst or to detect flow blockage is promising for a qualitative assessment. Nevertheless, PC-MRI remains the most evaluated and the most frequently used technique and the only quantitative method to date.
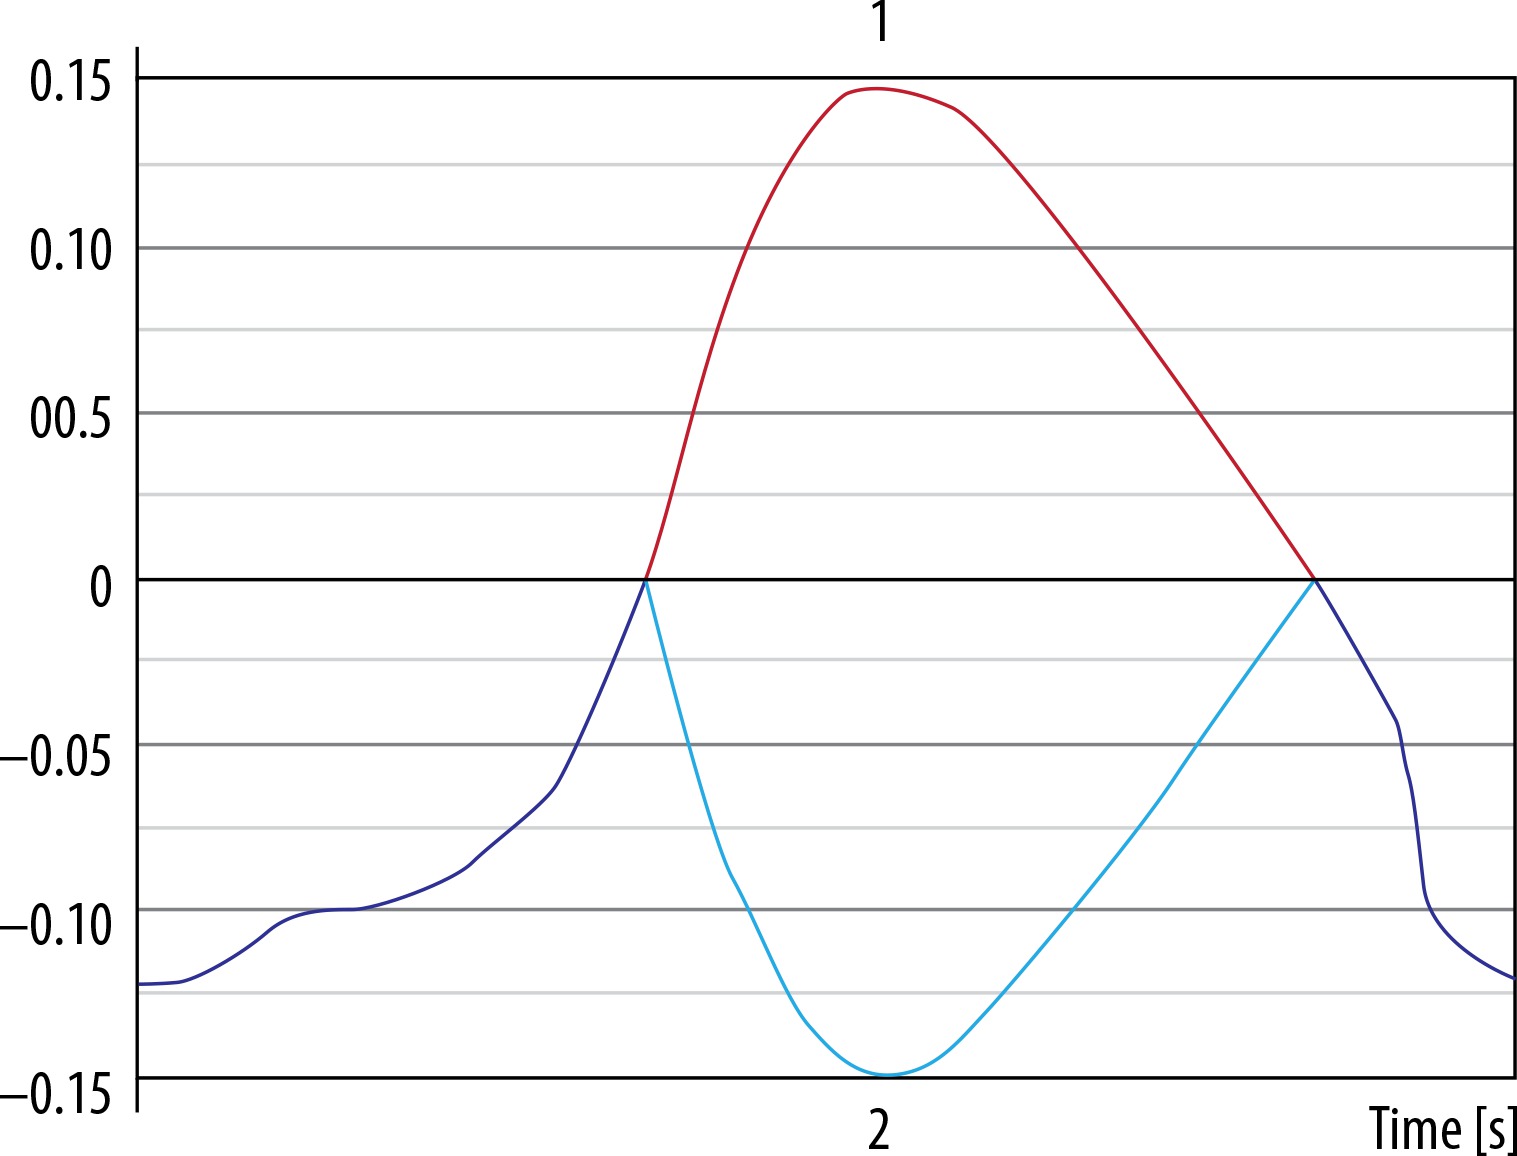
A proper velocity encoding value (connected with Vmax of flowing spins, which is rephased with the bipolar gradient) is necessary, to receive the highest signal possible. It is recommended that values of velocity encoding are selected slightly higher than the expected velocity of the examined fluid. Nonetheless, overestimated VENC leads to a diminished signal; on the other hand, underestimated VENC leads to the aliasing artefact – commonly present in the centre of the vessels, where flow velocity is higher than anticipated. It causes a phase shift greater than +π or –π. Spins exceeding the range of velocity encoding are going to wrap back simulating the flow in the opposite direction (Figures 5 and 6).
Figure 6
Aliasing artefact in the flow curve. 1. Red line represents data after post-processing, which is why aliasing artefact is no longer present and cerebrospinal fluid flow curve is corrected. 2. Light blue line represents unprocessed data. Flow velocity exceeds velocity encoding value and +/–π rephasing; as a result, it is mapped as flow in the opposite direction
High quality PC-MR images are dependent on fine-tuning between VENC, TR, and SNR. Sensitising an image to 5-8 cm/s CSF flow requires usage of strong bipolar gradients. The slower the velocity encoding, the stronger the magnitude that must be applied for a longer time, thus increasing TR. On the other hand, TR cannot be indefinitely increased; a relatively short repetition time is necessary to achieve maximal temporal resolution because the data must be plotted against one full cardiac cycle. Therefore, rigorous selection of proper sequence parameters is fundamental [18].
Electrocardiogram or finger plethysmography are used to plot data over the phases of the cardiac cycle. All the data are averaged from each cycle through the whole sequence, displayed as one cine loop. This is why the PC-MRI is insensitive to dynamic changes in CSF flow and turbulent flow, and insensitive to respiratory-derived CSF motions, because it represents an average from one time window [9,13].
The drawbacks of CSF PC-MRI are evident, but undoubtedly it is still a leading method for quantifying CSF flow velocities (such as stroke volume, peak systolic velocity, mean systolic volume, etc.) in different anatomical locations (sylvian aqueduct, foramen magnum) for clinical requirements such as differential diagnosis (e.g. NPH, Chiari type I, syringomyelia), postsurgical follow-up (patency of ventriculostomy, shunts, etc.), and it remains a promising, significant, and accessible MRI sequence.
Clinical application
Normal pressure hydrocephalus
Normal pressure hydrocephalus is a type of communicating hydrocephalus (without obstruction of CSF outflow) first described by Hakim and Adams in 1965 as an idiopathic condition, mostly affecting elderly patients, with a clinical triad of symptoms (triad of Hakim): gait disturbance, dementia, and urinary incontinence [19]. Since then, NPH has been the subject of numerous studies because it is one of few potentially reversable causes of dementia. Bradley et al. suspect that up to 10% of people with dementia may have NPH and may profit from treatment. However, despite the development of medical guidelines, diagnostic imaging methods, and extensive studies, its poor clinical manifestation and non-specific changes in radiological findings (complete triad of symptoms is merely present; the first and the only alteration is often enlarged ventricles) proves that NPH remains a diagnostic problem. Gait disturbance (typically the first syndrome) followed by dementia and urinary system malfunction occurs after a long asymptomatic period with only slight changes in MRI images. Patients suffering from secondary NPH (as a result of subarachnoid haemorrhage or meningitis) develop symptoms earlier than patients with primary (idiopathic) NPH [20]. It is worth mentioning that the existence of an iNPH as was suggested in 1965 is arguable, especially considering recent investigations and new pathophysiological theories.
Magnetic resonance assessment of the brain is crucial in the NPH diagnostic procedure, revealing several morphological and functional alterations. Typical findings comprise ventriculomegaly, narrow callosal angle (< 90°) (Figure 7), periventricular high signal on T2-weighted sequences (Figure 8), tight sulci in convexities of the cerebral hemispheres, upward bowing of the corpus callosum, and aqueductal flow void artefact (best seen on conventional SE sequences, often compensated by more rapid FSE/TSE sequences available on high-field MR units) [21-24].
Figure 7
Morphological changes in normal pressure hydrocephalus. Ventriculomegaly with pronounced dilatation of the frontal and temporal horns (left image) and a narrow callosal angle (right image)
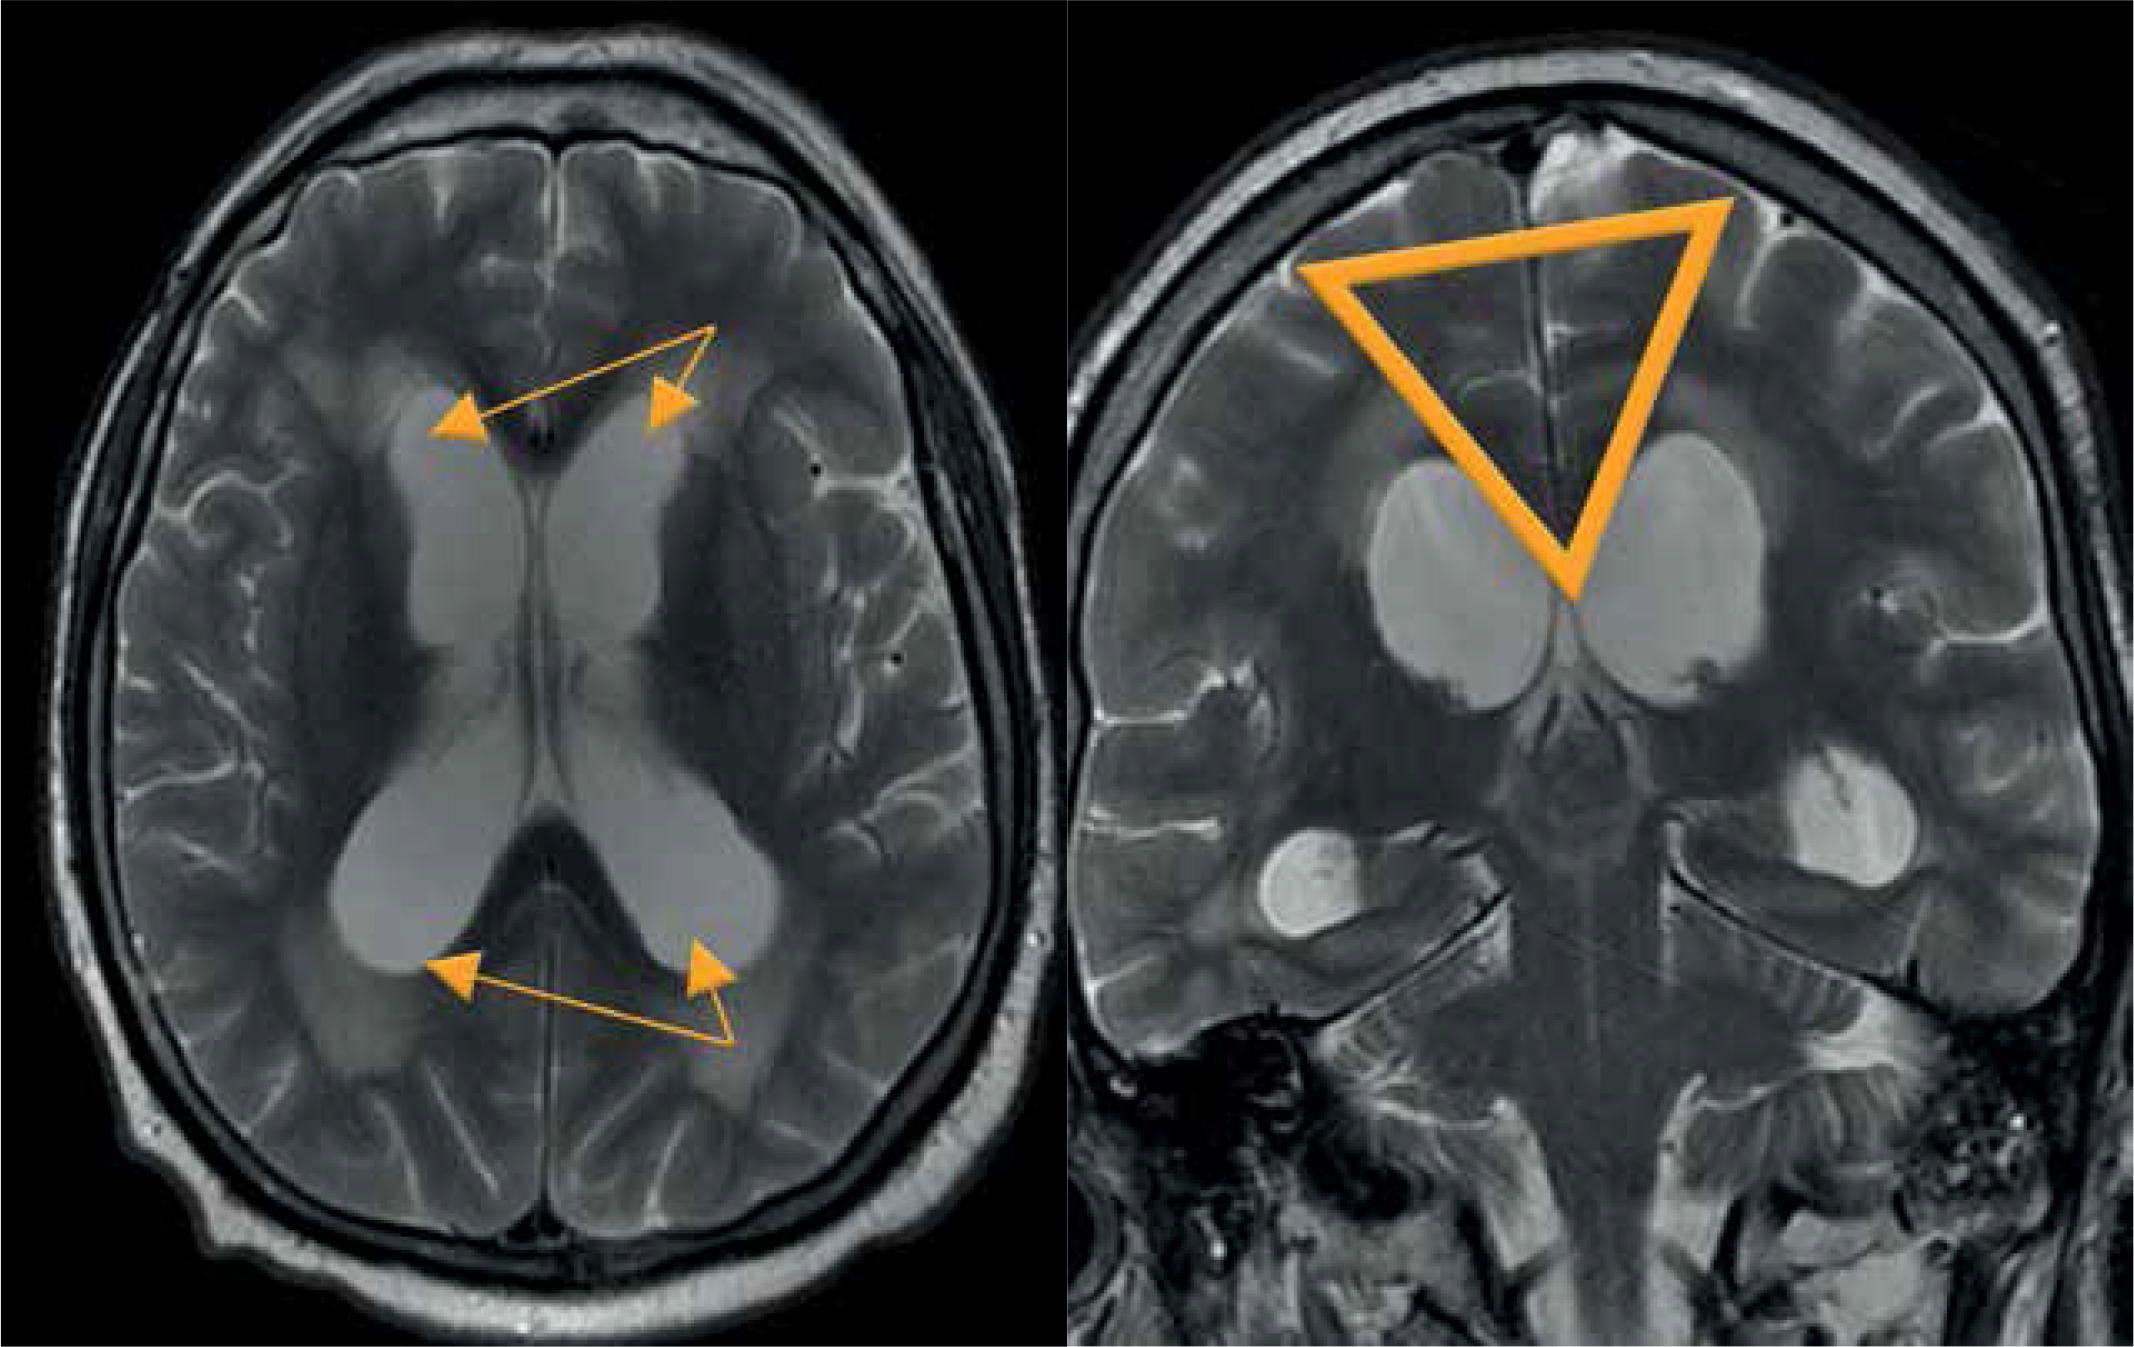
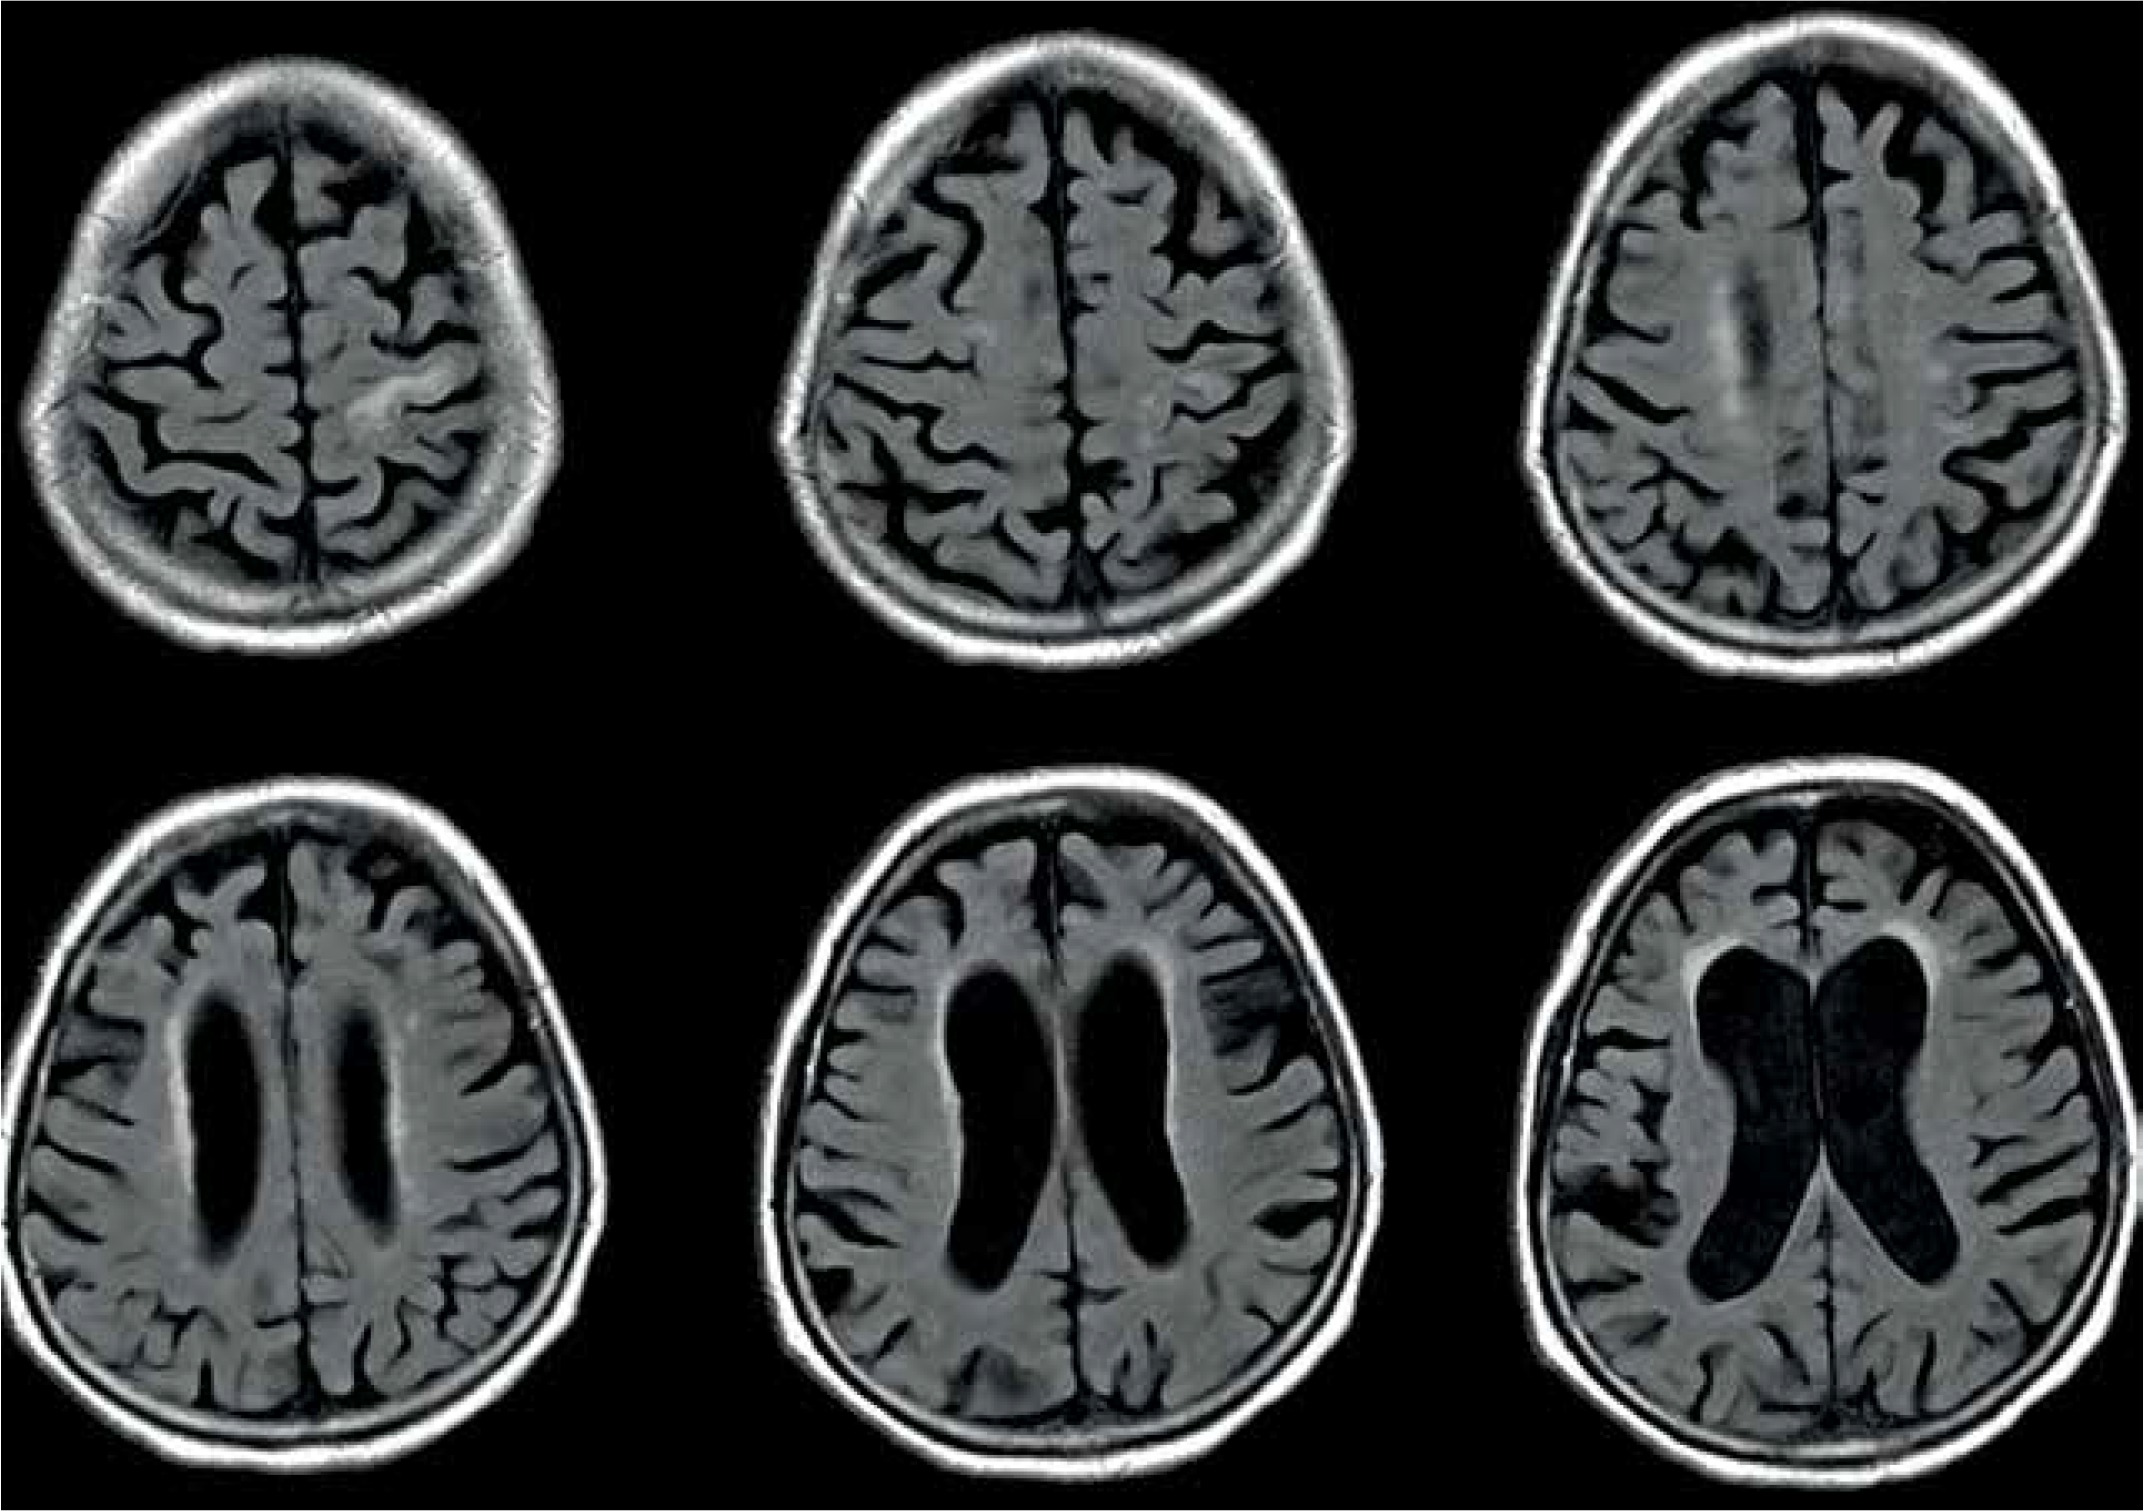
Figure 8
Periventricular high T2 signal on T2-weighted imaging. Example of magnetic resonance imaging findings in patients with normal pressure hydrocephalus
The treatment of choice in NPH is a ventriculoperitoneal shunt surgery (VPS). A VP shunt is a catheter with a valve enabling one-way outflow of the excessive amount of CSF from the ventricles. Patency control is obligatory because complications (infections, obstruction) are possible.
Assessment of the aqueductal flow void on spin-echo images was historically used to choose patients who might benefit from a VPS [24]. Due to technological advances and widespread accessibility of PC-MRI, it superseded SE-images and became a sequence most often used for evaluation of the CSF flow pattern in patients with NPH in relation to the cardiac cycle. Data are acquired in an oblique plane, perpendicular to the aqueduct, to diminish a partial volume effect, and then plotted against the cardiac cycle. The CSF flow during the heart cycle consists of a craniocaudal flow (during systole), and a caudocranial flow (during diastole), which is represented on a flow curve as values above the zero-line and below the zero-line, respectively (Figure 4). In 1996, Bradley et al. proposed aqueductal stroke volume > 42 μl as a cut-off value above which patients with NPH were thought to benefit from VPS placement [26]. Since then, the subject has been extensively studied as a promising method for non-invasive assessment of CSF flow, but with ambiguous results. Luetmer et al. proposed CSF flow > 18 ml/min as a cut-off point in the PC-MRI [15]. Sharma et al. proved that the peak systolic velocity in the aqueduct strongly correlates with a positive clinical response to a shunting procedure [27]. Moreover, Bradley et al. still (since 1996) use PC-MRI in conjunction with a high-volume CSF tap test to qualify patients with NPH to VPS [20]. Nonetheless, numerous articles provide results completely different to those mentioned above. Dixon et al. investigated for 10 months a group of 49 patients with NPH, who underwent VPS, and did not find any correlation between CSF flow rates (before/after procedure) and postoperative clinical condition [25]. A proportion of patients with increased CSF flow rates did not improve after VPS, while at the same time patients experiencing complications after the procedure had physiological CSF flow rates. Kahlon et al. failed to prove the importance of stroke volume as a marker of clinical outcome after shunt surgery [28]. Algin et al. attempted to find a connection between any of the CSF flow markers (ASV, mean CSF flow velocities) and response to treatment, but did not obtain any significant results [29]. This apparent discrepancy between research studies can be explained in a few ways. First of all, acquired CSF flow values are strongly machine, technology, and post-processing dependent [20], which means that no fixed cut-off value should be held. Bradley et al. in two articles and in a commentary from 2015 emphasise the importance of establishing ACSV values ≥ 2 times higher than values derived from healthy volunteers (age-matched control group) [20,30]. That is why every medical centre performing PC-MRI should have an individual range of values, to correctly select NPH patients who would profit from VPS procedures. Another reason for incompatible results is the difference in the chosen sequence parameters. CSF velocities derived from PC-MR images are diminished if a partial volume effect takes place; thus, selecting a correct matrix size and FOV is important to provide pixels that are as small as possible. Finally, not all symptomatic NPH patients will show an increased aqueduct stroke volume. Scollato et al. proved in a prospective study that SV often does not increase during onset of the disease; it may increase with the progression and may decrease with time due to the development of brain atrophy [31]. Also, severely ill patients with a long medical history may have normal stroke volume and are not likely to benefit from shunting procedures. Other studies have tried to estimate the diagnostic value of non-invasive PC-MRI versus invasive diagnostic methods, such as intrathecal infusion test, cerebrospinal tap test, and intracranial pressure measurement. Each of these tests are currently used (depending on the country) to help in the diagnosis and treatment decisions in NPH. PC-MRI was assessed as a highly specific technique, correlating well with invasive tap-test and infusion tests [32]. Zhang et al. paid attention to the fact that net CSF flow through the aqueduct differs not only in NPH, but also in communicating hydrocephalus and other neurological disorders [33]. Also, the correlation between net CSF flow and ICP values was found to be significant, contrary to recent investigations in which no such correlation was stated and the clinical usefulness of the aqueductal stroke volume measured in PC-MRI was highly questionable [34].
Ventriculoperitoneal shunts
VPS is a procedure in which an inflow catheter with a pressure-sensitive valve (responsible for drainage of any excessive amount of CSF) is inserted into the ventricles, and an outflow catheter is located in the peritoneal cavity. Thanks to unidirectional, pulsatile flow with a specific velocity, the patency of shunt can be evaluated with PC-MRI with VENC values chosen above 2-5 cm/s [35]. Although there are other methods to visualise patency, such as flow void artefact on conventional sequences or Time-SLIP sequence [14], PC-MRI is the only quantitively method available. PC-MRI has not only been proven to preserve patency, but also has been evaluated as a potential prediction method of postsurgical outcome; however, negative results were found in patients who underwent VPS [25]. Finding a proper reliable biomarker of a positive surgical outcome requires further studies and investigations.
Endoscopic third ventriculostomy
ETV is a procedure based on creating an opening in the tuber cinereum between the third ventricle and basal cisterns. Such an additional pathway restores CSF pulsatile motion. The whole procedure is managed with an endoscope placed in the lateral ventricles, with no medical devices being implanted. Although VPS surgery remains the treatment of choice in NPH, multiple drawbacks related with mechanical malfunction or biological complications (e.g. infections, abscesses, pseudocysts) [36,37] are the reason for the increasing popularity of ETV. Endoscopic ventriculostomy was traditionally performed in patients with non-communicating hydrocephalus, although its high long-term success rate (estimated at up to 72% [38]), low morbidity, and lack of typical shunt-associated complications made it a viable alternative in selected patients [39,40]. PC-MRI may be used post-surgically to quantify the patency of the opening and to prove the restoration of the CSF pulsatile flow [41]. Moreover, a significant positive correlation was revealed between stroke volume measured in PC-MRI in patients before surgical treatment and postsurgical outcome [42]. Regardless of the selected treatment method, PC-MRI undoubtedly remains an effective and non-invasive method of post-operative CSF flow assessment.
Chiari type I malformation (CMI) with and without syringomyelia
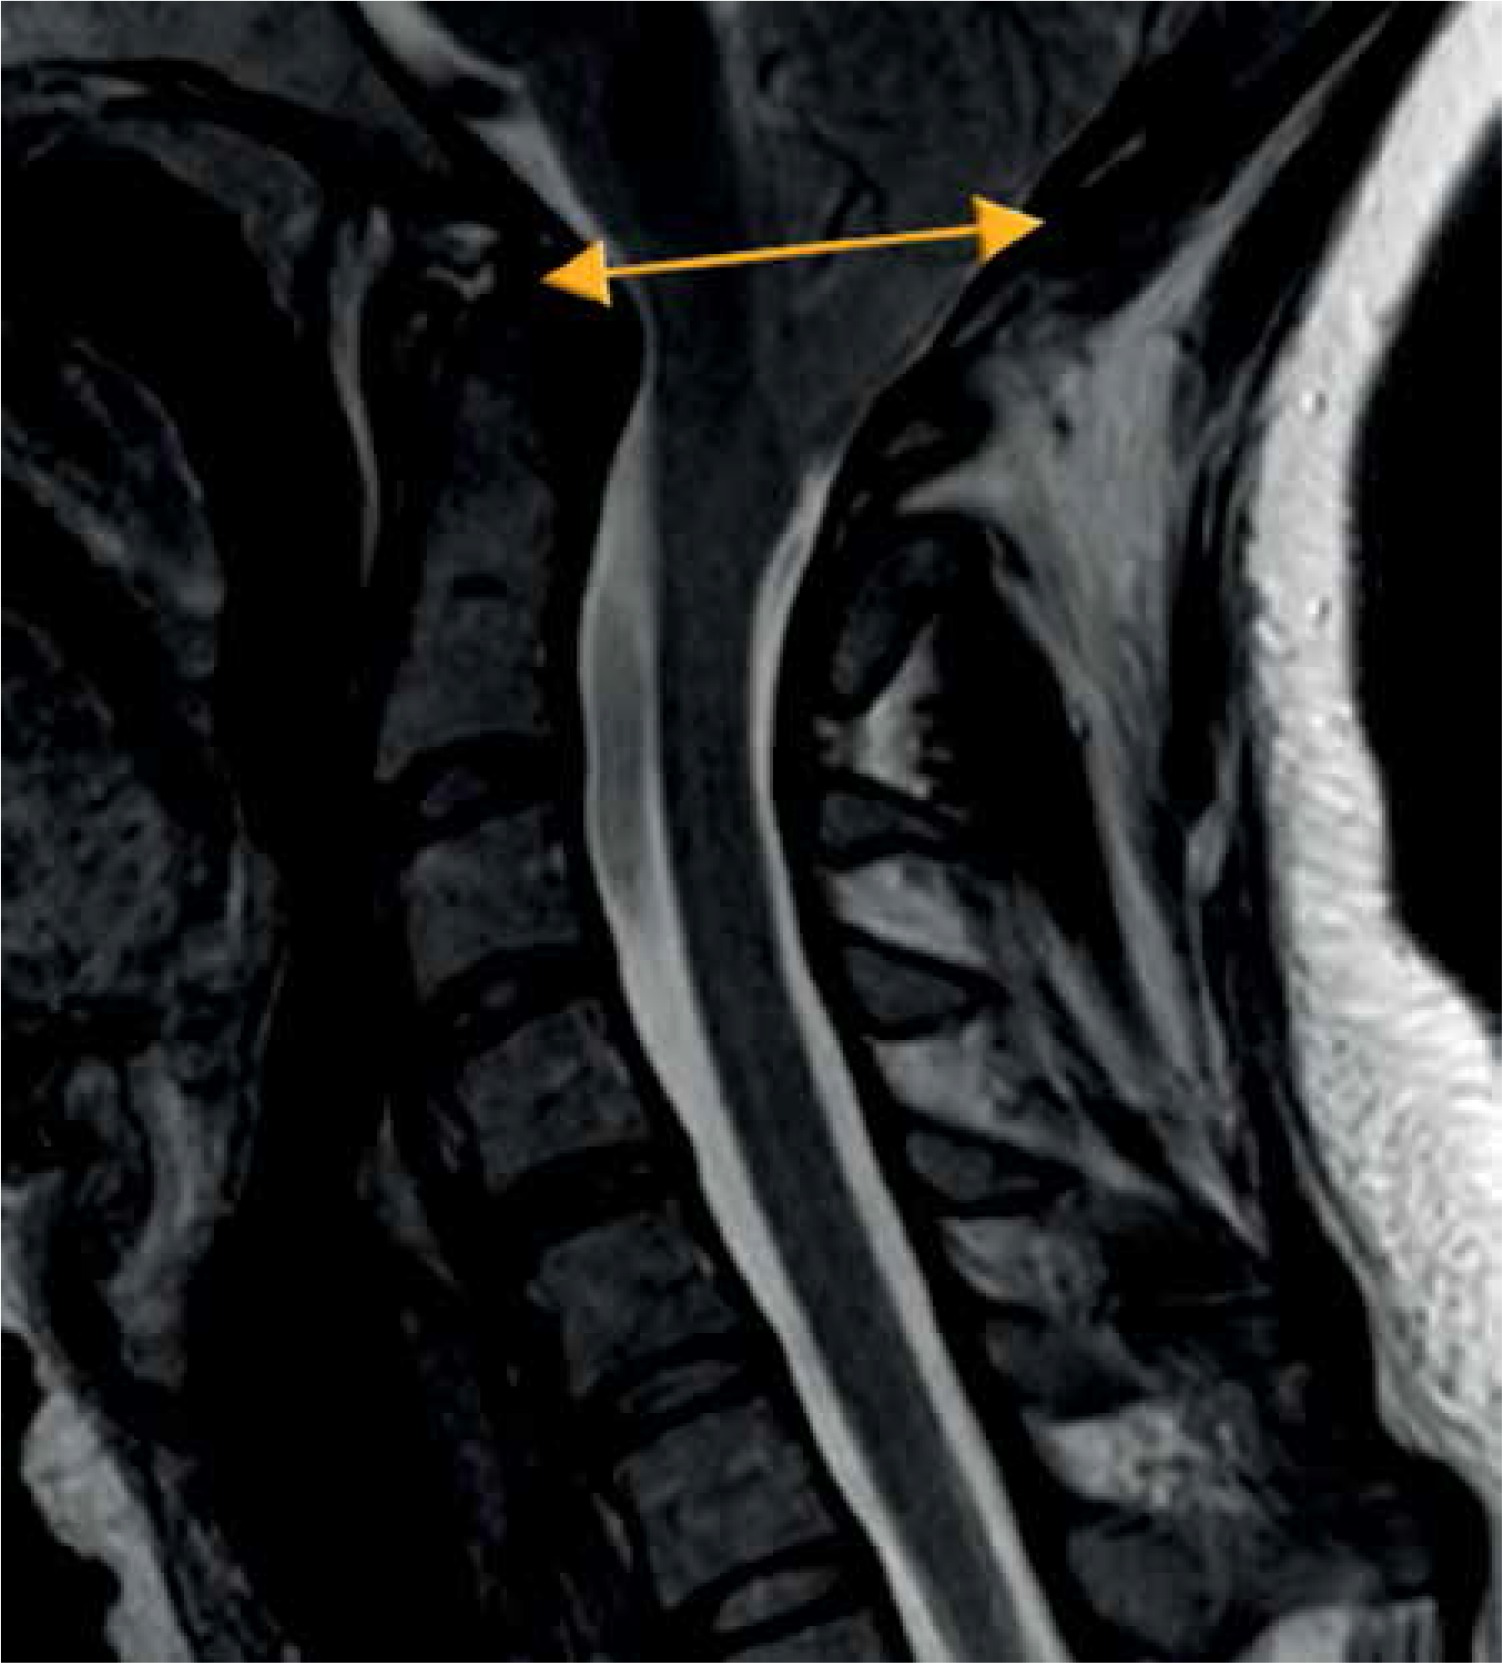
Chiari malformation is an abnormality in the morphology of the posterior fossa, which causes a downward displacement of the cerebellum either solely or with the medulla oblongata into the cervical spinal canal below the level of the foramen magnum. Malformation is subdivided depending on which anatomical structures are herniated below the level of the foramen magnum. CMI is characterised by a descent of the cerebellar tonsils greater than 5 mm below the McRae line (Figure 9). At times it leads to obstruction of CSF flow at the level of the foramen magnum and secondary syringomyelia. The classical clinical manifestations are headaches and neck pain during Valsalva manoeuvres (e.g. coughing, crying, or straining); however, patients may present gait balance disturbances, fine motor skill disorders, tinnitus, vertigo, Lhermitte’s sign, paraesthesia, and variety of other symptoms. Moreover, it is important to mention that a large number of patients are asymptomatic, their condition is detected accidentally during diagnostic procedures, so no further treatment is recommended. The majority of CMI cases, when conservatively treated, experience mild progression or even no progression, which was stated in long follow-up studies conducted by Strahle et al. [43]. A surgical procedure called posterior fossa decompression or surgical suboccipital craniectomy is reserved only for severely symptomatic patients to withhold progression of brain damage and restore CSF flow. The prognostic value of isolated tonsillar herniation on MRI is doubtful because it must be combined with other MRI findings and clinical presentation (benign tonsillar ectopia) [44]. Considering all factors, it is crucial to distinguish CMI from other unrelated secondary conditions or asymptomatic tonsillar ectopia. Regardless of different theories concerning CMI aethology [45,46], changes in the morphology of the posterior fossa and craniocervical junction are recognised to alter CSF flow within different regions of the spinal cord and brain stem, establishing PC-MRI as a fundamental technique in research studies and clinical evaluation.
Figure 9
McRae line (yellow line). Line connecting the basion and the opisthion on a sagittal brain image serves as a reference for assessment of tonsillar ectopia in Chiari malformation
Bhadelia et al. were the first researchers to apply PC-MRI in patients with CMI, and they discovered impaired CSF flow pulsation below the foramen magnum during systole as well as an improvement in the CSF flow after surgery [47]. Since then, peak systolic velocities and mean systolic velocities have been subjects of numerous studies. Haughton et al. stated that velocities acquired within the plane throughout the foramen magnum are more inhomogeneous in patients than in healthy volunteers. Also, maximal signal intensities were noticed to be higher independently of the cardiac cycle, with the systolic velocity being significantly greater in patients compared to the control group [48]. In both anterior and posterior cervical regions the prevalence of caudal (systolic) velocities over cranial (diastolic) velocities was separately estimated, with the diminished cranial flow measurements in the aqueduct, contrary to the increased caudal flow [49], which supports Gardner’s “water-hammer” theory of the pathophysiology of syringomyelia [50].
Paediatric patients with CMI and syringomyelia were also included in several research studies because PC-MRI is a non-invasive method of CSF flow assessment [51-53]. The results are consistent with other studies with approximately similar alterations in the CSF dynamics compared to adults [54,55]. Nonetheless, it must be stressed that CSF velocities vary with age [56], so selecting age-corresponding normative values is crucial to obtain unbiased results.
Regardless of the methodology chosen to evaluate CSF motion, many authors emphasised the importance of flow inhomogeneity, the presence of diastolic flow jets in anterior paramedial locations, and synchronous bidirectional flow [52,54,57], with greater abnormalities noted in symptomatic CMI patients [51,58] and patients with coincident syringomyelia [59]. Moreover, application of PC-MRI in the assessment of hydrodynamic changes before and after posterior fossa decompression has been extensively tested, not only to evaluate the effectiveness of suboccipital craniectomy, but also to gain insight into the pathophysiology of CMI and syringomyelia. Follow-up studies have shown a significant postsurgical improvement of flow and CSF velocities (with results comparable to healthy volunteers) and strong correlation with clinical improvement, which supports the theory of physiological block in CMI with reduction of maximal CSF velocities after surgical therapy [47,49,54,60,61].
Nevertheless, differentiating patients that would benefit from decompression surgery on the basis of symptoms and anatomical images is still inconvenient, especially with a lack of specific guidelines. Bhadelia et al. in an article from 2010, assessed CSF flow changes in CMI patients with cough-associated headache (CAH) and discovered results consistent with previous studies [47,62], as well as new features such as shorter CSF systole and longer diastole (67% sensitive, 86% specific) in CAH patients [52]. This individual result appears to be a promising selection tool, although more research needs to be done to establish convenient PC-MRI markers.
Despite the undoubted advantages of PC-MRI, there are a few major limitations that should be mentioned, which have created inconsistency in results. First of all, some of the previous studies used data from sagittally oriented image planes, while others used axial planes. This is why a flow blockage in the craniocervical junction detected in the sagittal plane [62] was assessed differently on axial images as a narrowing of the anterior subarachnoid space with uni- or bilateral jets [54,58]. Another pitfall is related to selection of variable slice orientations and different measurement locations; the predominantly used technique was single-slice 2D-PC MRI [53]. The whole complexity of abnormal CSF flow is impossible to acquire repeatedly with mean data plotted on one slice, which is why velocity values are incomparable between studies and sometimes contradict each other [63,64]. In addition, peak systolic velocities are strongly dependent on spatial resolution, especially if turbulent flow and intravoxel averaging are considered, leading to underestimated values.
It is believed that 4D-PC MRI will overcome these constraints because it is slice-selection independent, allows measurements in any region within the selected volume of tissue, and enables visualisation of CSF flow between different compartments [59,65]. A clear advantage of this technique over 2D PC-MRI is its comprehensive evaluation of CSF motion within a slab of tissue.
Syringomyelia
Syringomyelia is a disorder in which a cyst or cavity (syrinx) is formed within the spinal cord around the central canal. This condition is often hard to distinguish from simple dilatation of a central canal (called hydromyelia); therefore, some collective terms such as syringohydromyelia were introduced. Despite there being many different theories of the pathophysiology of syrinx formation, it is mainly considered to be secondary to CSF flow blockage, which results in increased pressure inside the central canal as the caudal flow is increased. PC-MRI is a useful technique to evaluate CSF flow inside the spinal cord because the pulsatile, altered flow inside syrinx cavities is detected. Systolic and diastolic CSF velocities are increased in patients with poor clinical condition and in patients with large cysts. After surgical treatment a decrease in velocities is observed, and in some patients it coincides with the decrease of syrinx volume [66]. PC-MRI may provide important preoperative information, may help to differentiate a cyst from a myelomalacia, and may be used as a method of postsurgical follow-up, because the increased flow values normalise after treatment.
Conclusions
Cerebrospinal fluid is a dynamic and complex compartment of the brain, with complicated mechanisms of transport and absorption, which are still the subject of ongoing research studies. Due to its multifunctional abilities, CSF has long been known to be altered in many pathological conditions. Phase-contrast MRI is a primary, non-invasive technique providing assessment of disruptions in the CSF compartment both qualitatively and quantitively. Its use revises the current knowledge and broadens present insight into the pathophysiology of CSF. Emerging techniques, such as 4D-phase contrast are promising methods for multidirectional assessment of flow. Knowledge about the physical background of this technique is essential to provide repeatable and comparable results.