


Introduction
Coronavirus disease 2019 (COVID-19), an on-going pandemic caused by severe acute respiratory syndrome coronavirus 2 (SARS-CoV-2), was reported for the first time in Wuhan city of Hubei province in China in December 2019. It has since spread rapidly to other parts of the world, causing a great deal of economic, social, historic, and scientific impact [1]. The World Health Organisation (WHO) declared the outbreak a global public health emergency on January 30th, 2020.
The clinical symptoms of COVID-19 can range from asymptomatic to mild disease (generalised body ache, dry cough, fever, and nasal congestion). The severe form of the disease is characterised by hypoxaemia, septic shock, coagulopathy, metabolic abnormalities, and death [2]. Altered sense of smell or taste in mild stages of the disease has also been observed [3]. Laboratory abnormalities include leucopaenia, elevated levels of serum ferritin, altered liver function tests, and raised cytokine levels (IL-6, IL-10). Evidence shows that a cytokine storm is induced by the virus by over-activation of the T cells, which causes lung damage leading to acute lung injury (ALI) [4].
The diagnosis of COVID-19 pneumonia is made by the detection of viral nucleic acid in pharyngeal swabs, sputum, or blood. The specificity of this test is high, with low sensitivity, due to which few patients show false negative results [5]. Studies have shown that radiological findings are observed earlier than the symptoms, which makes imaging important for early diagnosis and timely isolation [6]. This pictorial review aims to highlight the chest radiography (CXR) and computed tomography (CT) patterns of lung abnormality and common manifestations of COVID-19 pneumonia. A brief mention of point-of-care ultrasound (POCUS) has also been made. An awareness of these features will better equip radiologists in making an early and appropriate diagnosis.
Imaging in COVID-19
CXR and CT form the mainstay for imaging diagnosis of COVID-19 pneumonia.
Chest radiographs
CXR have a vital role to play in COVID-19 pneumonia, considering its highly contagious nature. Due to infection control issues and the requirement of effective decontamination of CT suites after scanning every patient, CT may not be possible for all patients. Furthermore, CXR is more readily available, inexpensive, and is the initial modality for screening [7]. In severe disease with acute respiratory distress syndrome (ARDS), portable CXRs are of paramount importance because patients cannot be mobilised for CT. A few specific patterns of disease have been observed, which are described below.
Ground-glass opacities
Ground-glass opacities are the earliest and the most common imaging manifestation of COVID-19 pneumonia; however, CXR has a low sensitivity for detection (69%) [8]. They become more conspicuous when an accompanying reticular pattern is present.
Peripheral alveolar opacities (Figure 1)
Figure 1
Peripheral predominant pattern of COVID-19 pneumonia. A) Schematic diagram depicting a peripheral predominant pattern of disease. B-D) Frontal chest radiography of 3 different patients with COVID-19 show peripheral, reticular, and patchy alveolar opacities (red arrows) in both lung fields
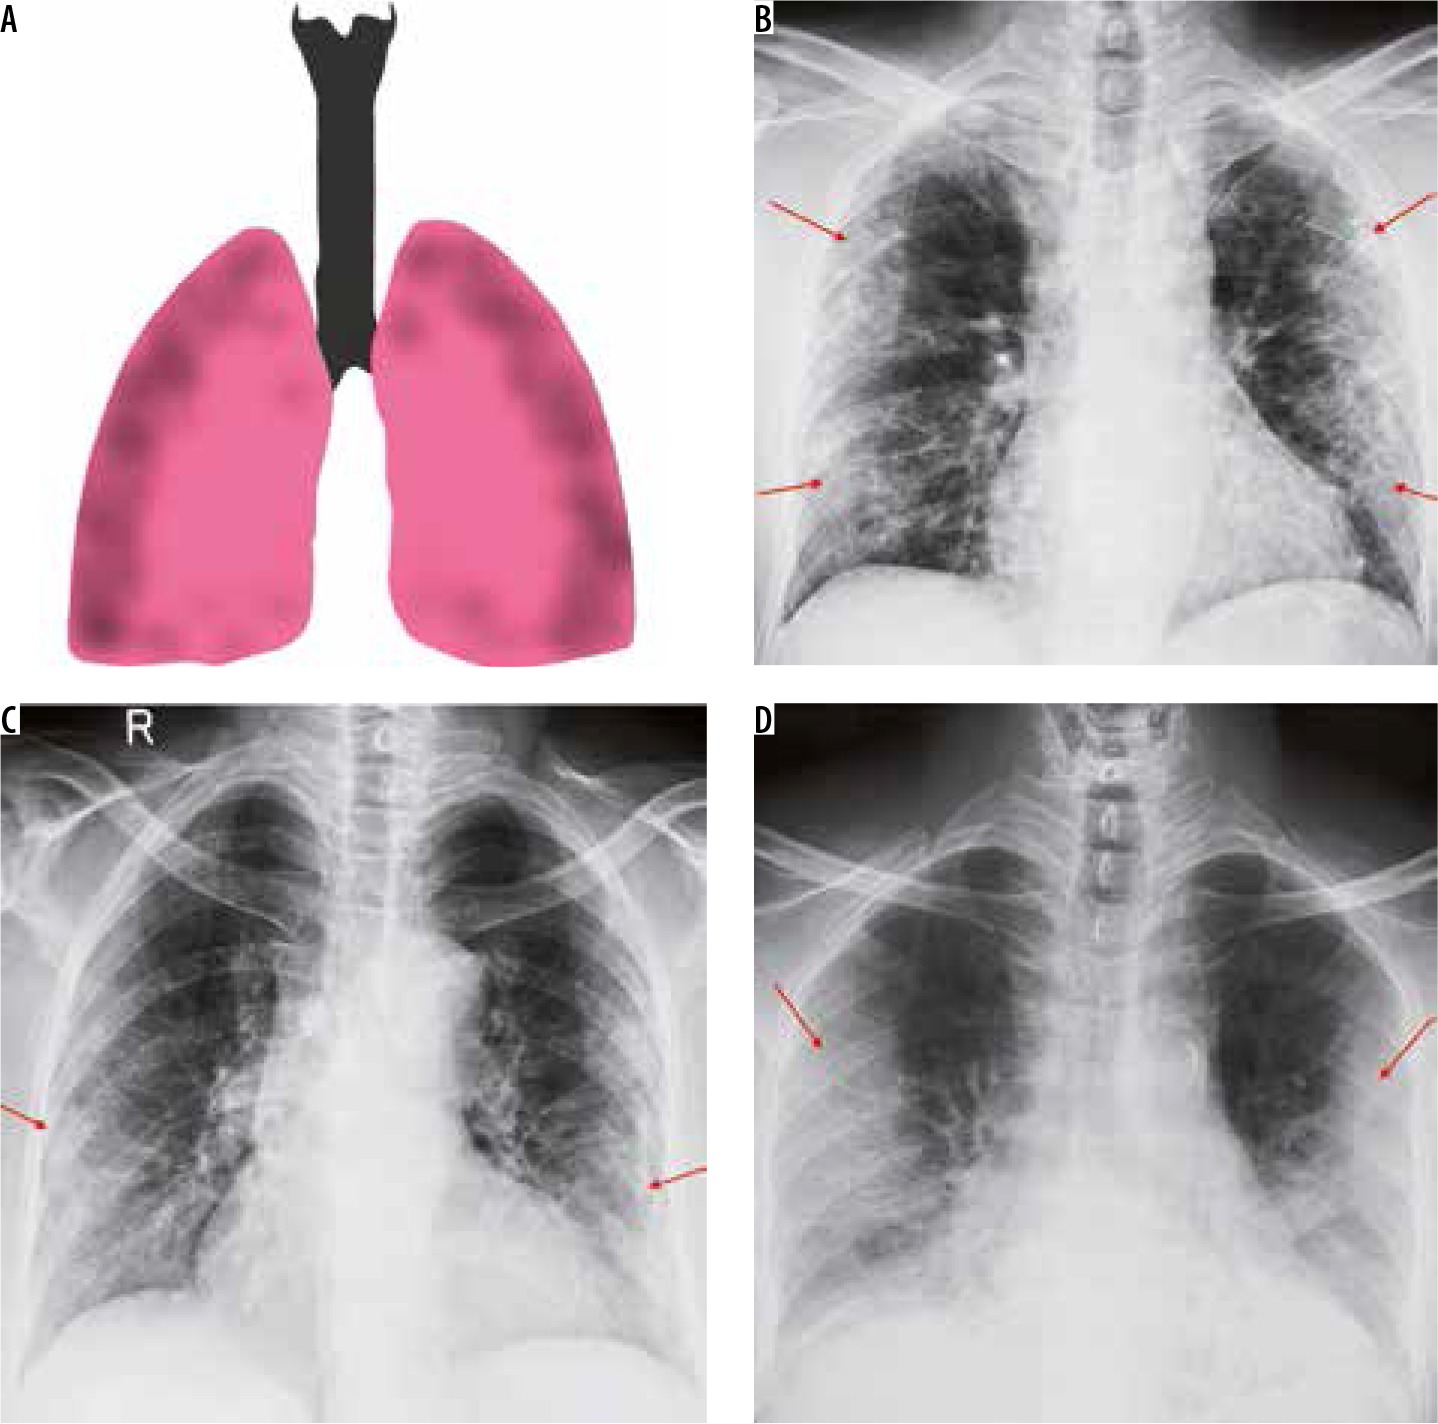
The predilection of COVID-19 to affect the peripheral lung fields is what makes it unique from other types of pneumonia. These peripheral opacities may be patchy or confluent and can be picked up on chest radiographs [9]. The opacities in COVID-19 pneumonia are often bilateral and multifocal, as compared to bacterial pneumonia, which is often unilateral and limited to a single lobe [7].
Lower lobe predominant consolidation (Figure 2)
Figure 2
Lower lobe predominant pattern of COVID-19 pneumonia. A) Schematic diagram depicting a lower lobe predominant pattern of disease. B-D) Frontal chest radiography of 3 different patients with COVID-19 show patchy opacities with lower lobe predominance (red arrows)
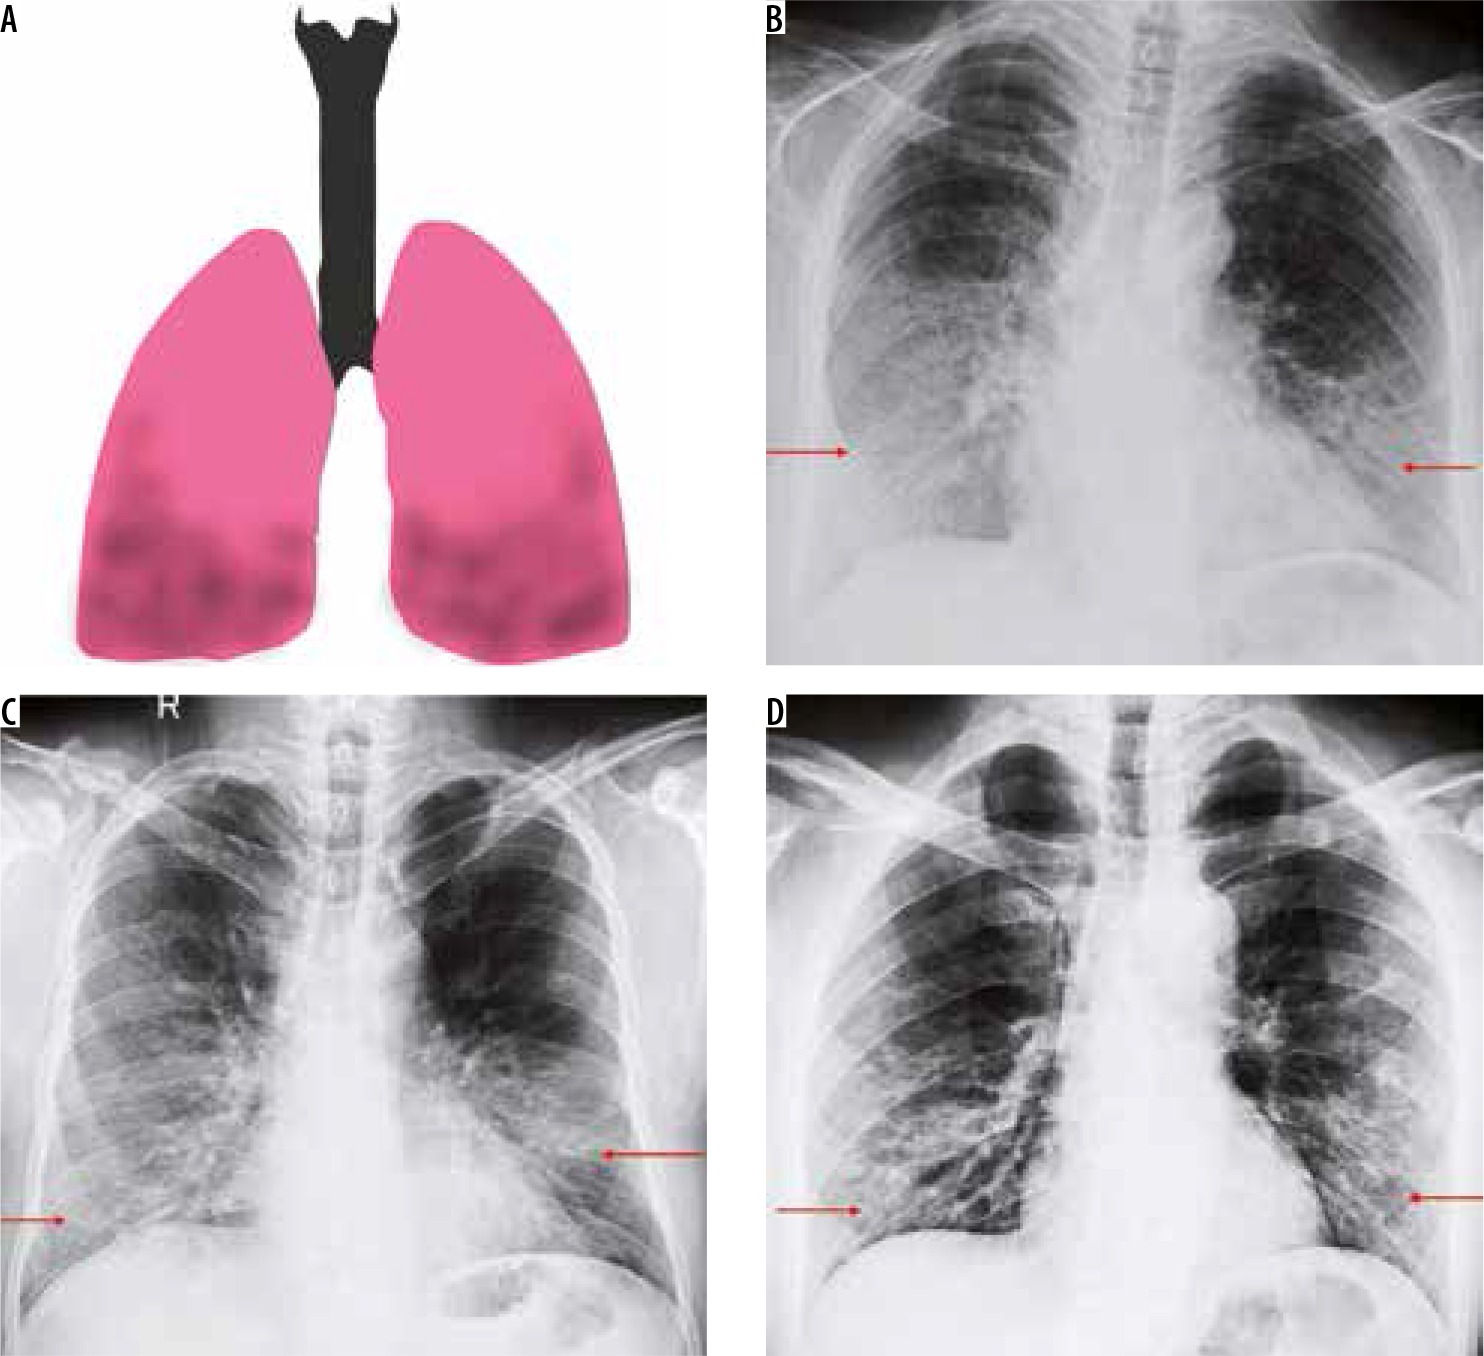
COVID-19 and other viral pneumonias typically present as lung opacities involving more than one lobe with a propensity for lower lung involvement [7,9]. A unilateral, central, or upper lobe predominant distribution is suspicious but indeterminate for COVID-19 infection and can also be seen in a variety of other infectious and non-infectious conditions.
Multifocal and diffuse air space opacities (Figures 3 and 4)
Figure 3
Multifocal pattern of COVID-19 pneumonia. A) Schematic diagram depicting a multifocal pattern of disease. B-D) Frontal chest radiography of 3 different patients with COVID-19 show areas of patchy alveolar opacities distributed in both lung fields (red asterisks)

Figure 4
Diffuse pattern of COVID-19 pneumonia. A) Schematic diagram depicting a diffuse pattern of disease. B-D) Frontal chest radiography of 3 different patients with clinical diagnosis of acute respiratory distress syndrome due to COVID-19 show varying degrees of parenchymal opacification in both lung fields

Diffuse air space opacities in COVID-19 are similar to the ARDS-like diffuse process that is seen with other widespread pulmonary infections. Most patients with these patterns are severely hypoxic and are usually intubated or on mechanical ventilation. The appearance is that of multifocal diffuse alveolar opacities in both lung fields and is usually seen in the late first or early second week of clinical symptoms [7].
A caveat to this is that a normal CXR is not uncommon in an asymptomatic individual or those presenting early in the course of the disease. Hence, the role of CT scan of the chest in COVID-19 infection is indispensable. In our experience, few patients had imaging findings of COVID-19 with an initial negative swab, as illustrated in Figure 5.
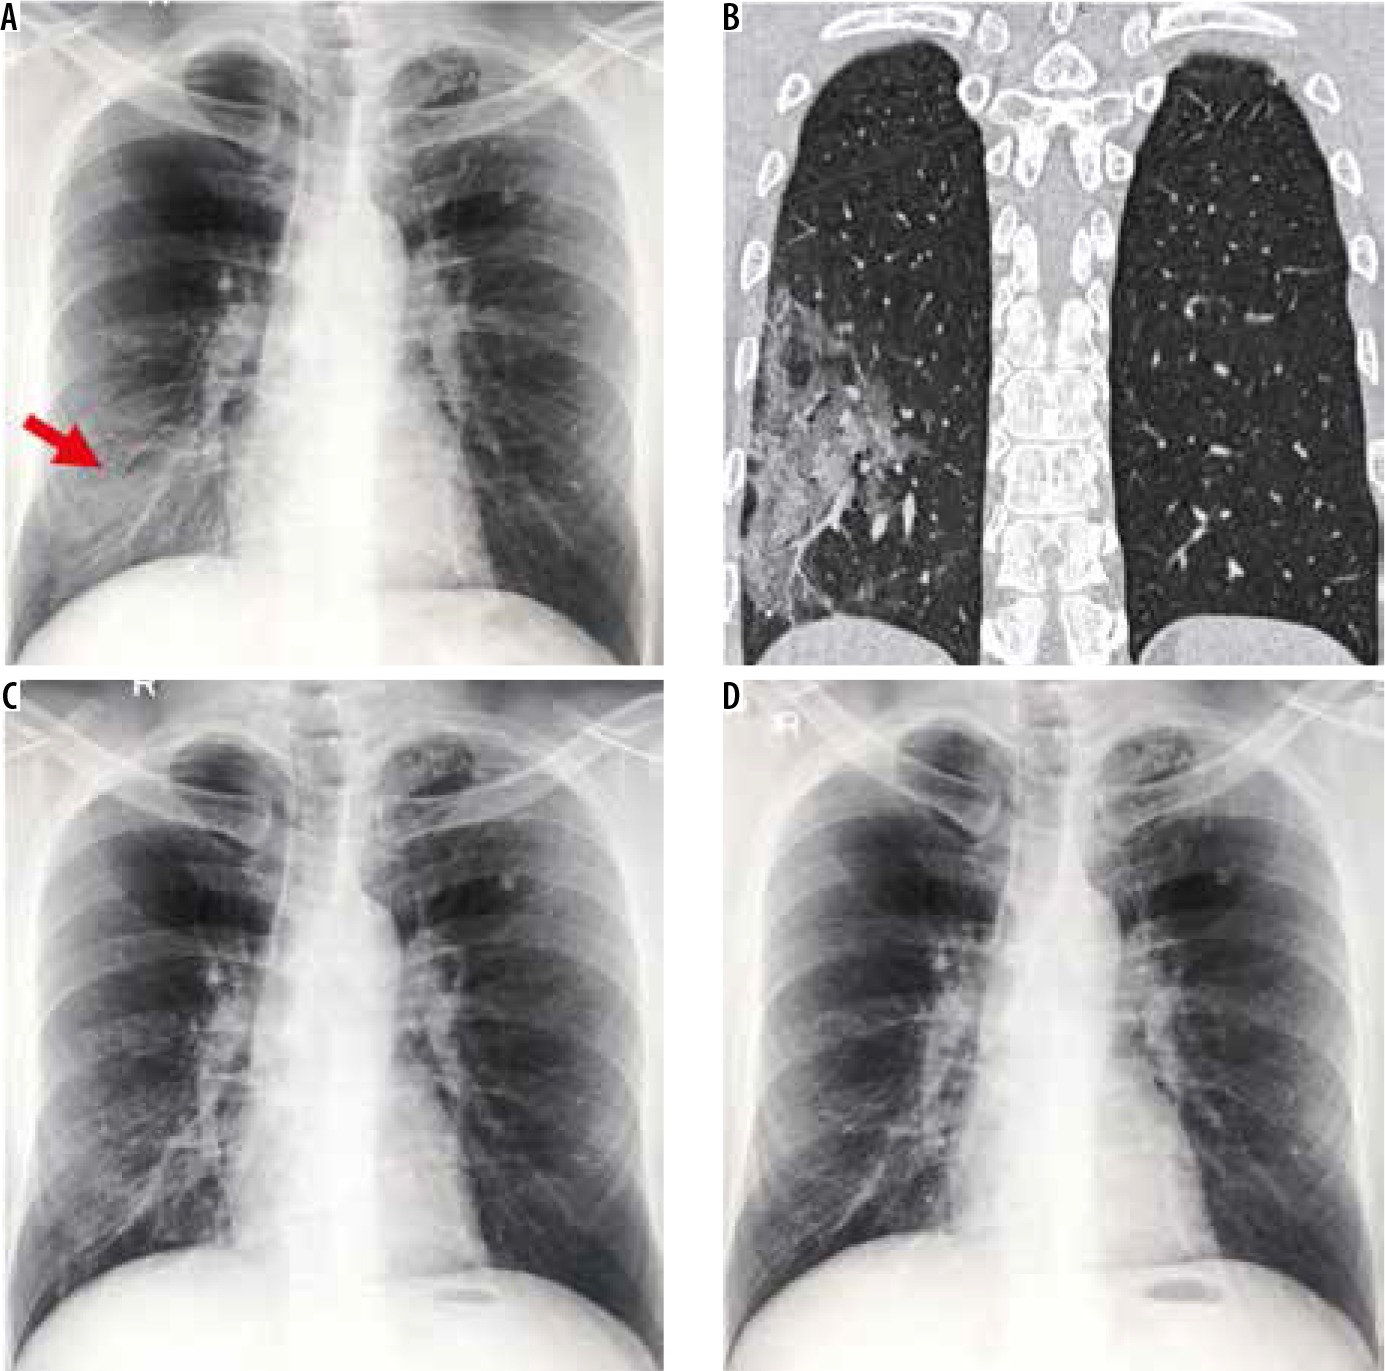
Figure 5
A 50-year-old man with COVID-19 pneumonia came with high-grade fever and loss of appetite for 2 days. The initial nasopharyngeal swab was negative for SARS-CoV-2. However, (A) frontal chest radiography on day 1 of presentation shows subtle ill-defined patchy opacity in the right lower zone (red arrow). B) Coronal reformatted computed tomography chest image shows a peripheral area of ground-glass opacity with interlobular septal thickening (crazy-paving appearance) in the right lower lobe. Follow-up radiographs on day 14 (C) and day 28 (D) showed subsequent resolution of the findings
Point-of-care ultrasound
Ultrasound (US), being a readily available and dynamic modality, is relevant in the imaging of COVID-19 pneumonia. Due to the high contagiousness of the disease and inability to transport unstable patients from the intensive care unit, CT may present as a limited option. In these settings, POCUS may provide results similar to CT and superior to radiographs in evaluation and follow-up [10].
US is performed by placing curvilinear or linear high-frequency transducers along the intercostal spaces. On US, findings such as thickening of the pleural line, B lines (appearing as multiple hyperechoic laser-like reverberation artefacts extending from the pleural line to the base of the screen without fading), and hypoechoic lung with air bronchograms due to alveolar consolidation have been described in cases of COVID-19 pneumonia [10,11]. Few such findings are demonstrated in Figure 6.
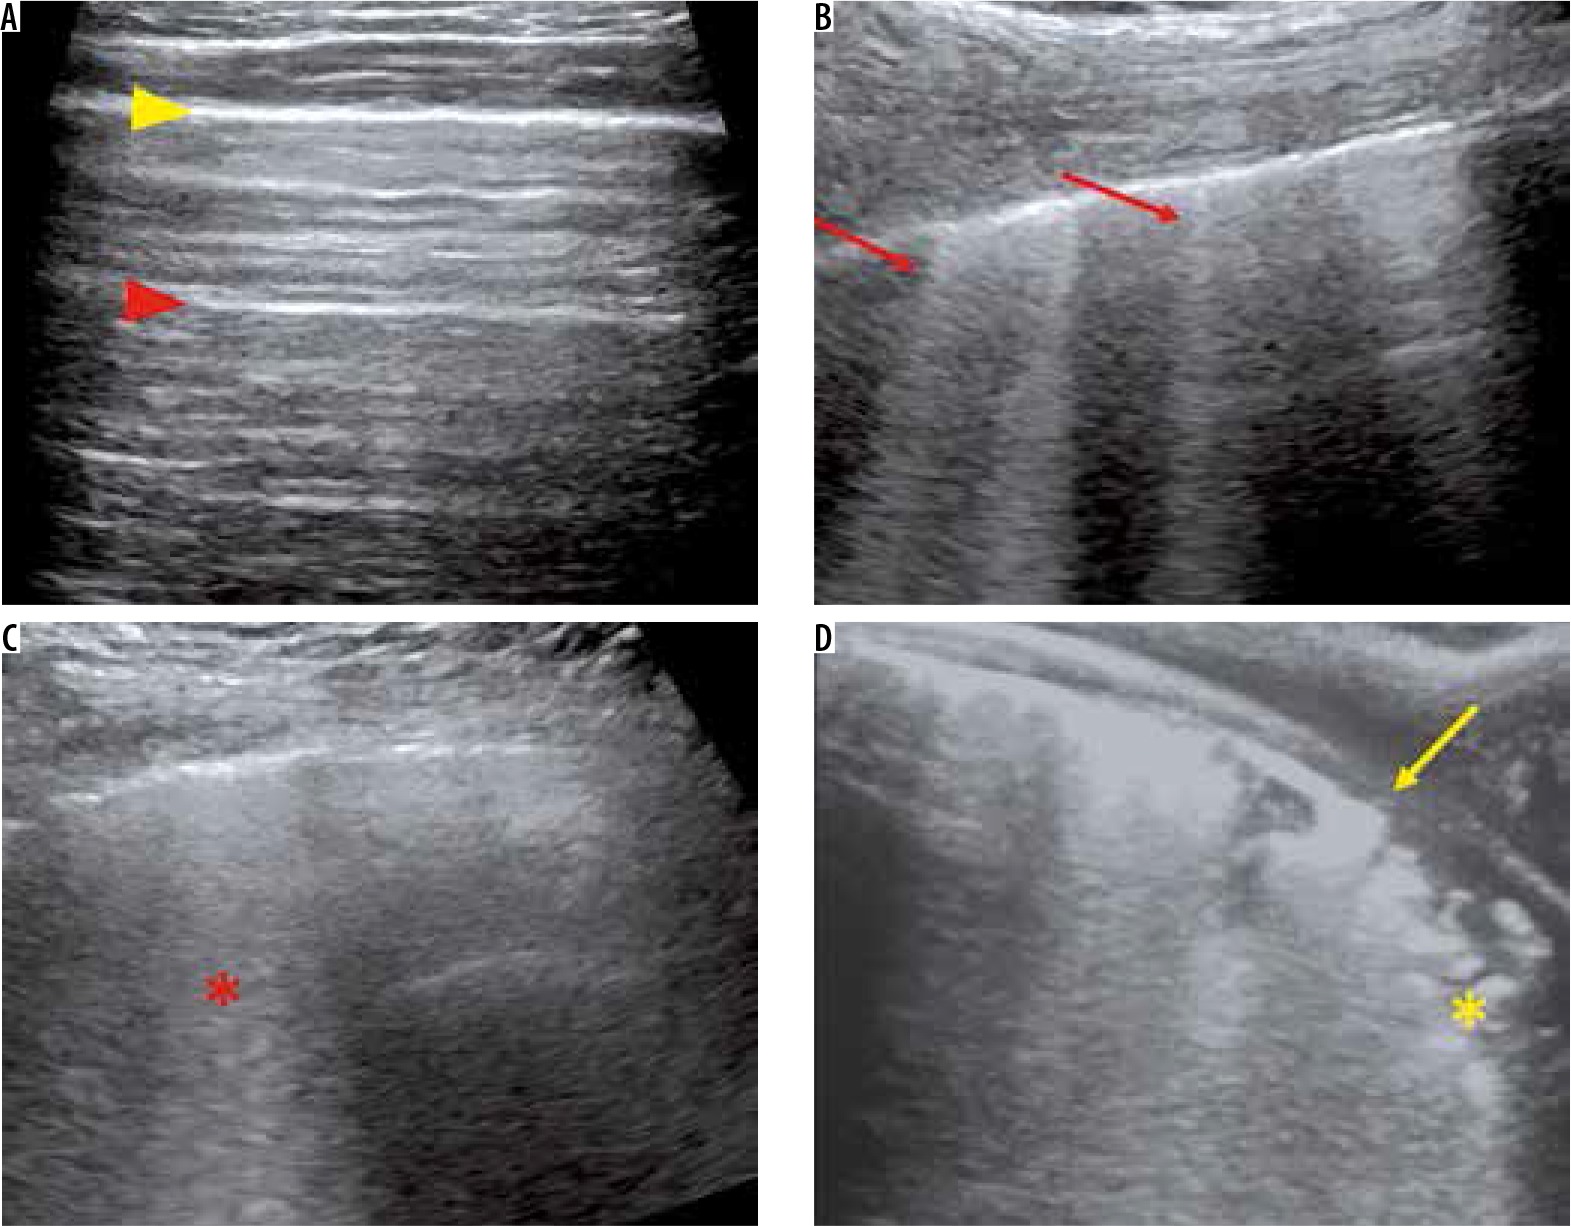
Figure 6
Ultrasound (US) findings in COVID-19 pneumonia. A) Grey-scale US image of the normal lung using a linear array transducer shows a continuous thin pleural line (yellow arrowhead) with multiple reverberation artefacts parallel to it – A lines (red arrowhead). B) A 54-year-old man with COVID-19 pneumonia. US performed using a curvilinear array transducer shows multiple laser-like hyperechoic lines erasing the A lines – B lines (red arrows). C) Confluent B-lines in the same patient as (B) – Waterfall sign (red asterisk). D) A 62-year-old woman with COVID-19 pneumonia. US performed using a linear array transducer showing thickening and interruption of the pleural line (yellow arrow) with subpleural consolidation (yellow asterisk)
Computed tomography
SARS CoV-2 utilises the angiotensin-converting enzyme-2 (ACE-2) receptors in humans and causes damage to the pulmonary interstitium and subsequently the parenchyma [12]. Although a pharyngeal swab test is the standard assessment for 2019-nCoV infection diagnosis, current tests are time-consuming and may not be easily available due to the high demand. Sampling errors or insufficient viral material in the specimen may also be responsible for a false negative test result.
The critical role of CT in the early detection of patients with COVID-19 infection has modified treatment protocols in many parts of the world. Non-contrast CT obtained in the supine position with breath-hold to minimise motion artifacts is the standard protocol in many institutes for diagnosis of COVID-19 infection [13]. At our institution, high-resolution computed tomography (HRCT) scans were performed with all patients in the supine position at end inspiration. Use of intravenous contrast was limited to patients with suspected pulmonary thromboembolism and raised D-dimer levels. All images were reconstructed at 1.0 mm slice thickness with 1 mm increment, 512 mm × 512 mm, and a sharp reconstruction kernel.
Various CT appearances of COVID-19 have been described in the literature, which will be illustrated in more detail. The “Expert Recommendations from the Chinese Medical Association Radiology Branch” divides the CT manifestations of COVID-19 into three stages: early, advanced, and severe, based on the extent of lung involvement with an additional dissipation stage [14].
Early stage (0-4 days)
Ground-glass opacity (GGO) (Figures 7 and 8) is defined as increased lung opacity that does not obscure the vascular margins. It is caused by partial filling of air spaces with fluid, pus, or blood and resultant displacement of air [15]. The occurrence of multifocal unilateral or bilateral rounded GGOs in the periphery of the lung fields with a subpleural predominance is a common finding in patients with COVID-19 pneumonia. Multiple studies have confirmed these findings with accompanying features of interlobular septal thickening, fibrosis, and consolidation [16,17].
Figure 7
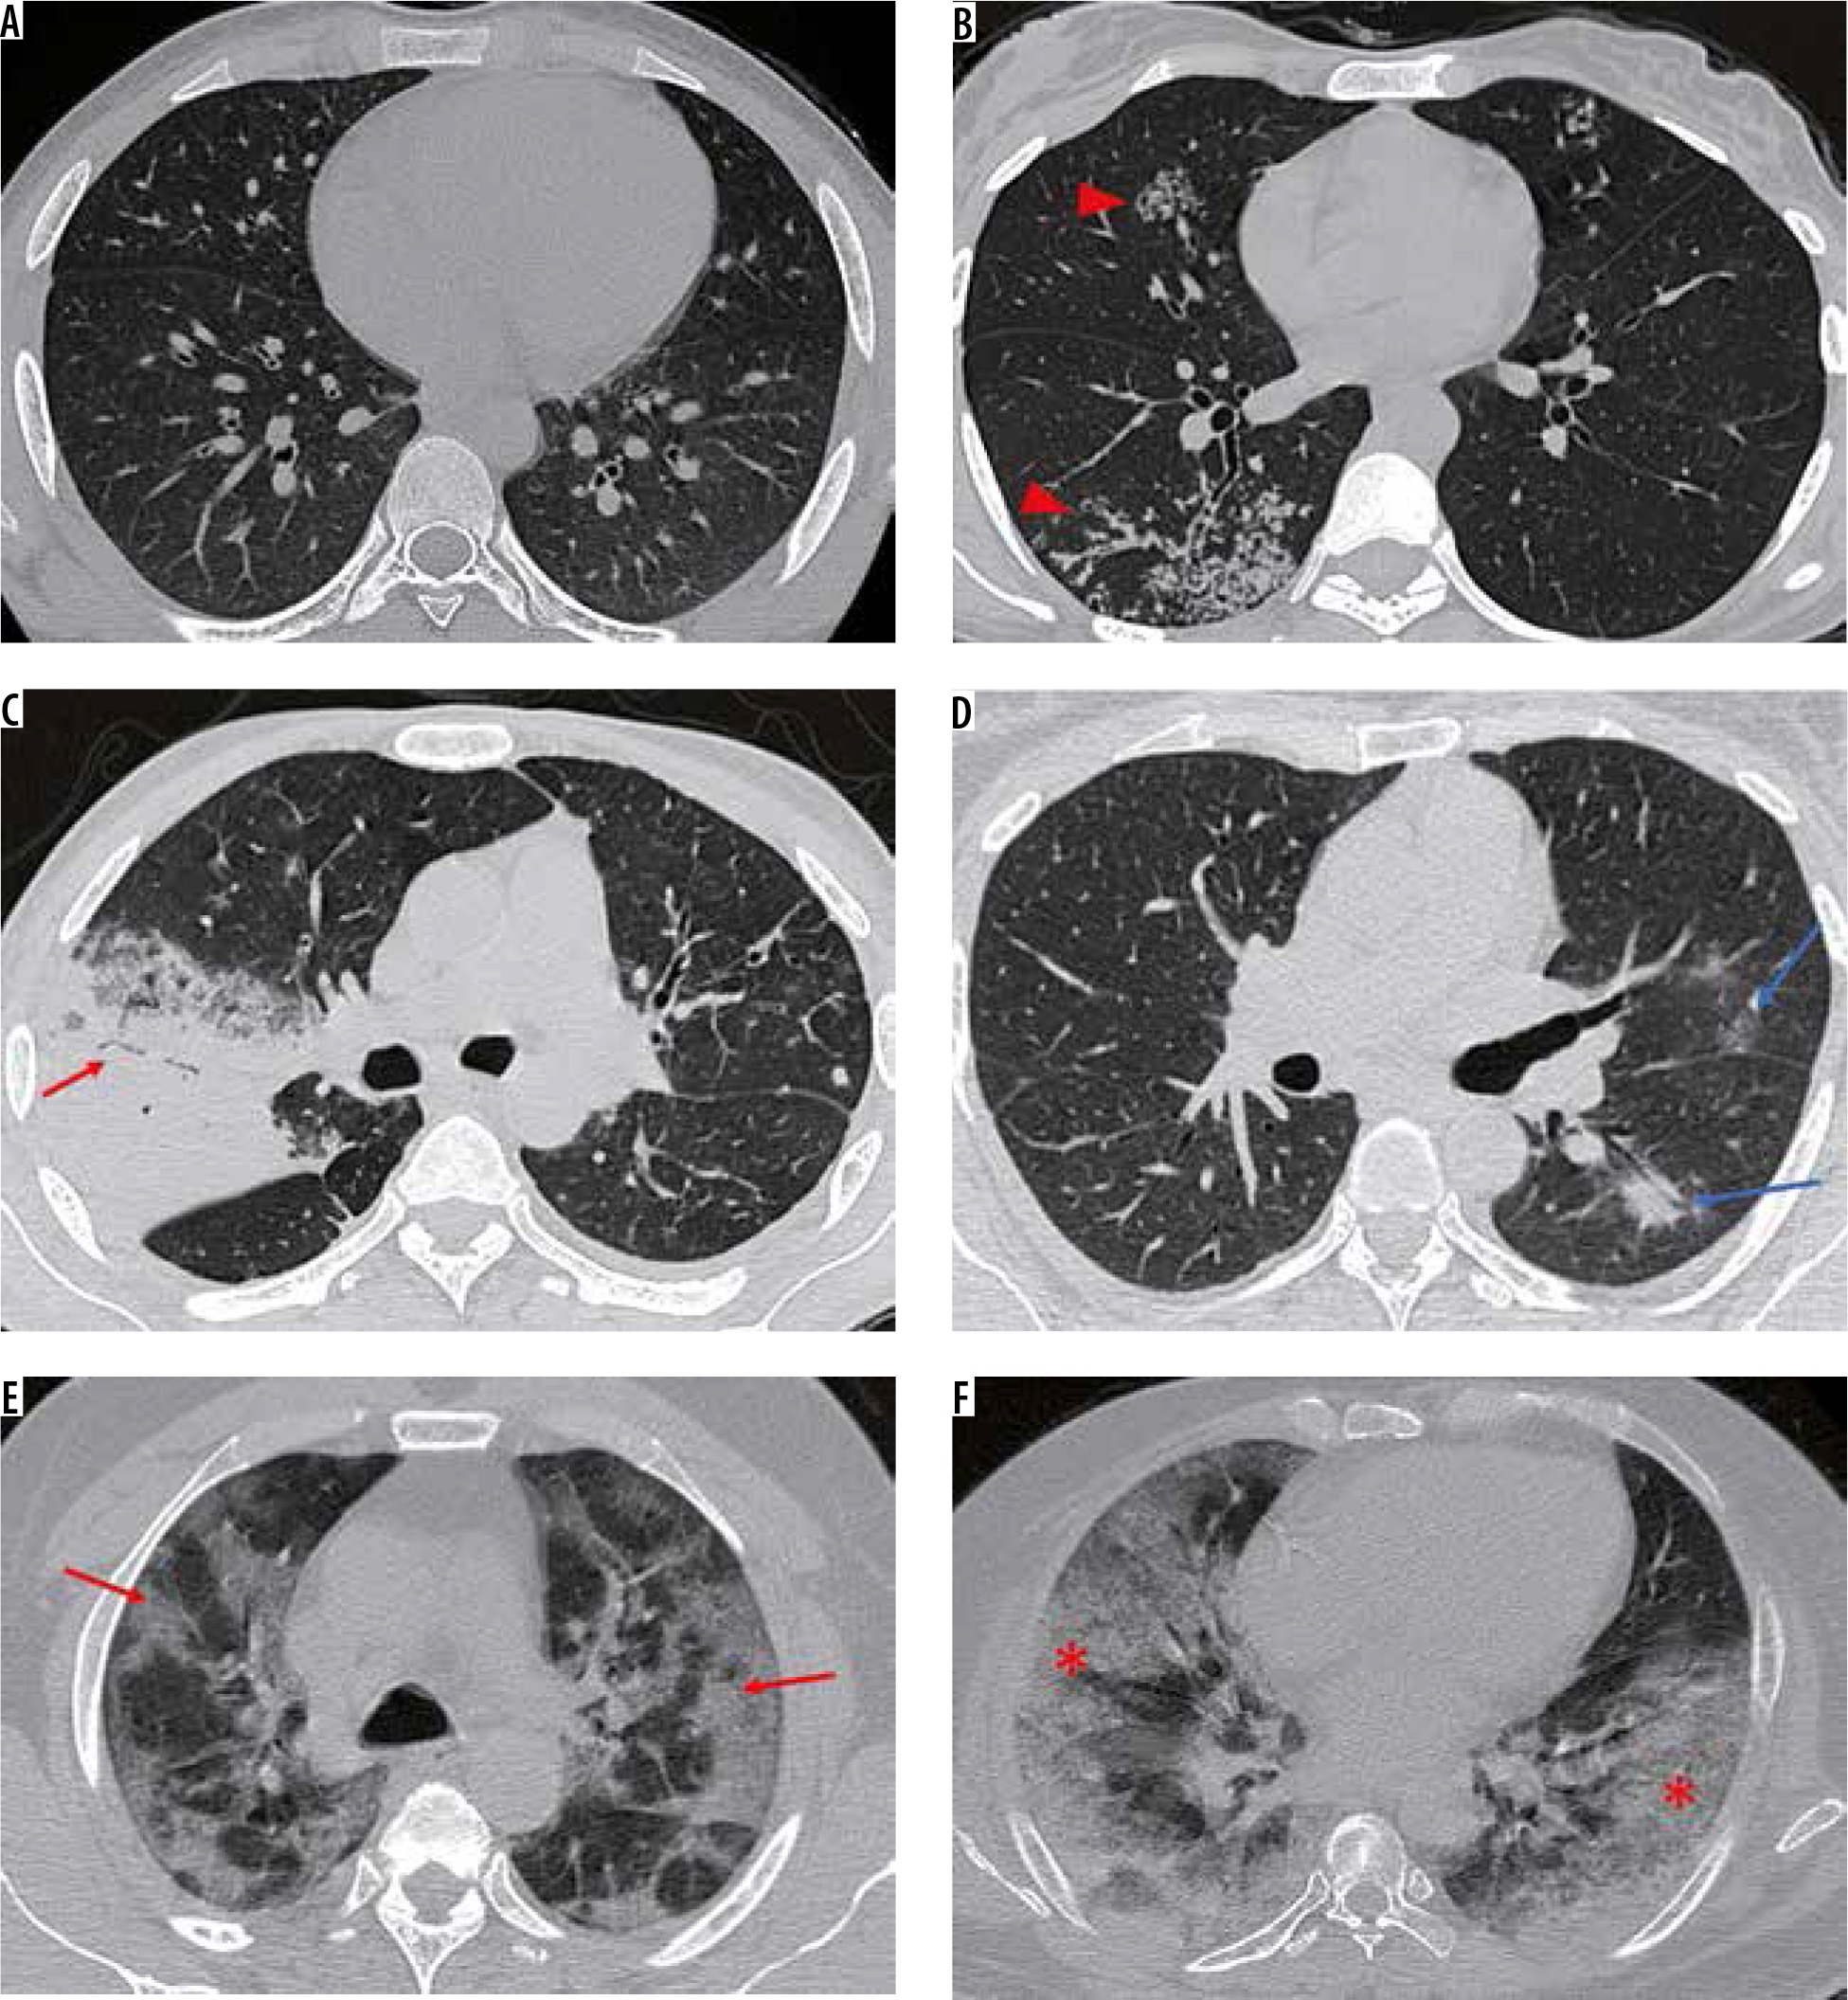
Distribution of ground-glass opacities on axial sections of high-resolution computed tomography chest in 2 different patients with COVID-19 pneumonia. A) A 37-year-old man, 3 days after symptom onset – subtle GGOs in the periphery of both lung fields (red arrows). B) A 49-year-old man, 5 days after symptom onset – multifocal GGOs (red arrows) with vascular thickening (yellow arrowhead) in both lung fields

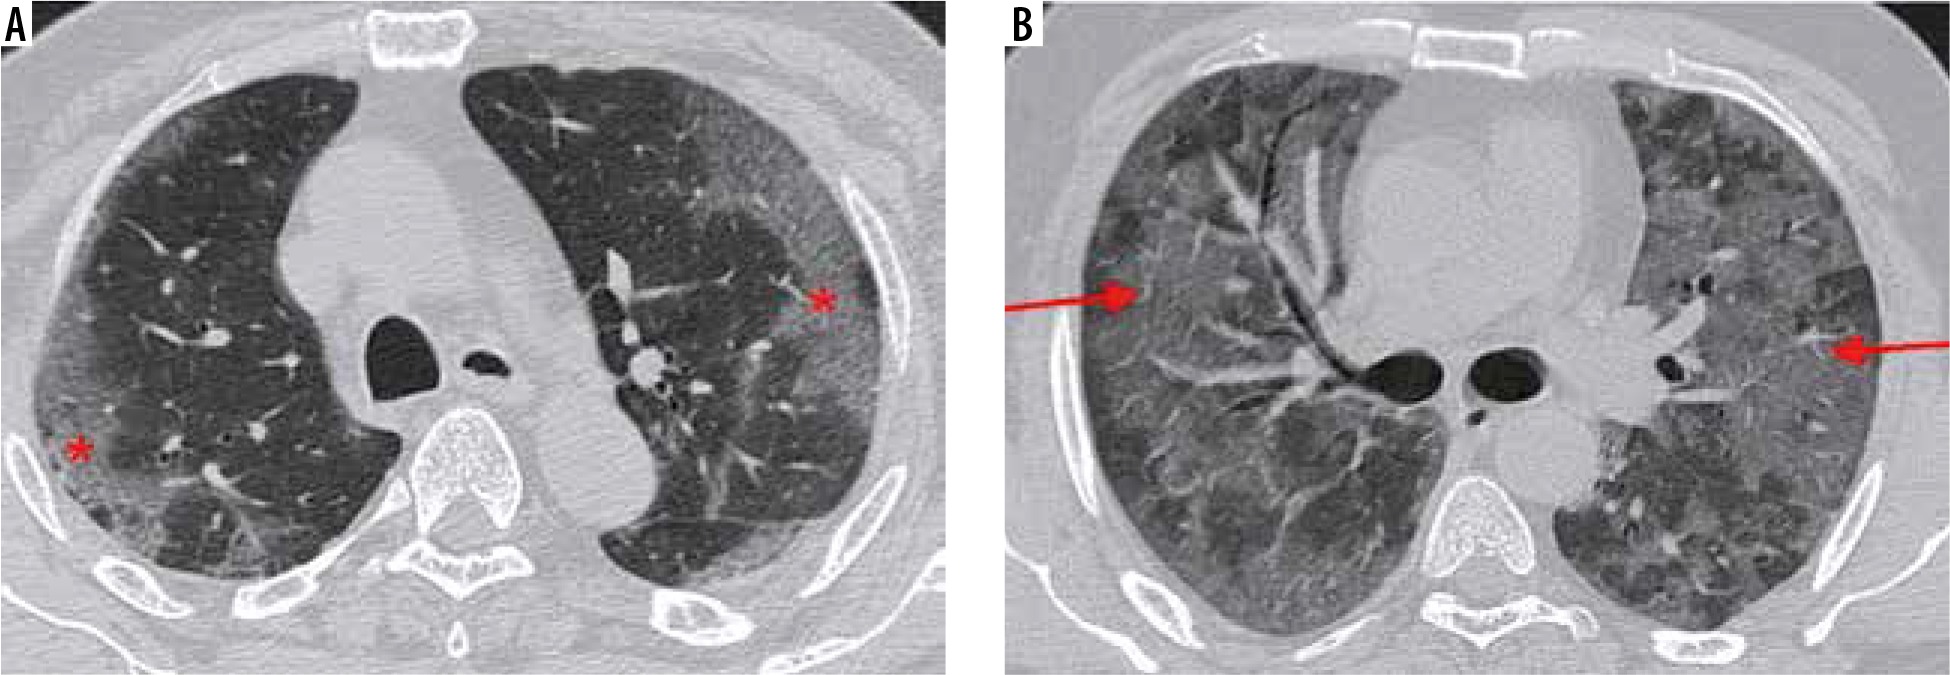
Figure 8
Axial high-resolution computed tomography (HRCT) chest images. A) Confluent ground-glass opacities with a peripheral and subpleural distribution in both lung fields (red asterisks) in a 47-year-old woman with significant hypoxia. B) A 52-year-old man presented to the emergency room with breathlessness and poor oxygen saturation for three days. Axial HRCT image shows extensive, diffuse GGOs in both lung fields (red arrows) with few areas of spared lung parenchyma. Nasopharyngeal swabs in both patients confirmed COVID-19 pneumonia
Vascular enlargement (Figure 9) is the dilatation of the pulmonary vasculature within or around the lesions seen on CT. This manifestation may be due to endothelial damage to the capillary walls resulting from inflammatory mediator release.
Figure 9
A) Coned down axial high-resolution computed tomography chest image of a patient with COVID-19 shows rounded ground-glass opacity (GGO) in the right upper lobe (red arrow). B) Coned down axial computed tomography image in a different patient shows vascular thickening (red arrow), in a background of interlobular septal thickening with GGOs (crazy paving appearance). The normal calibre of a peripheral vessel is shown for comparison (yellow arrow)
Advanced stage (5-8 days) (Figure 10)
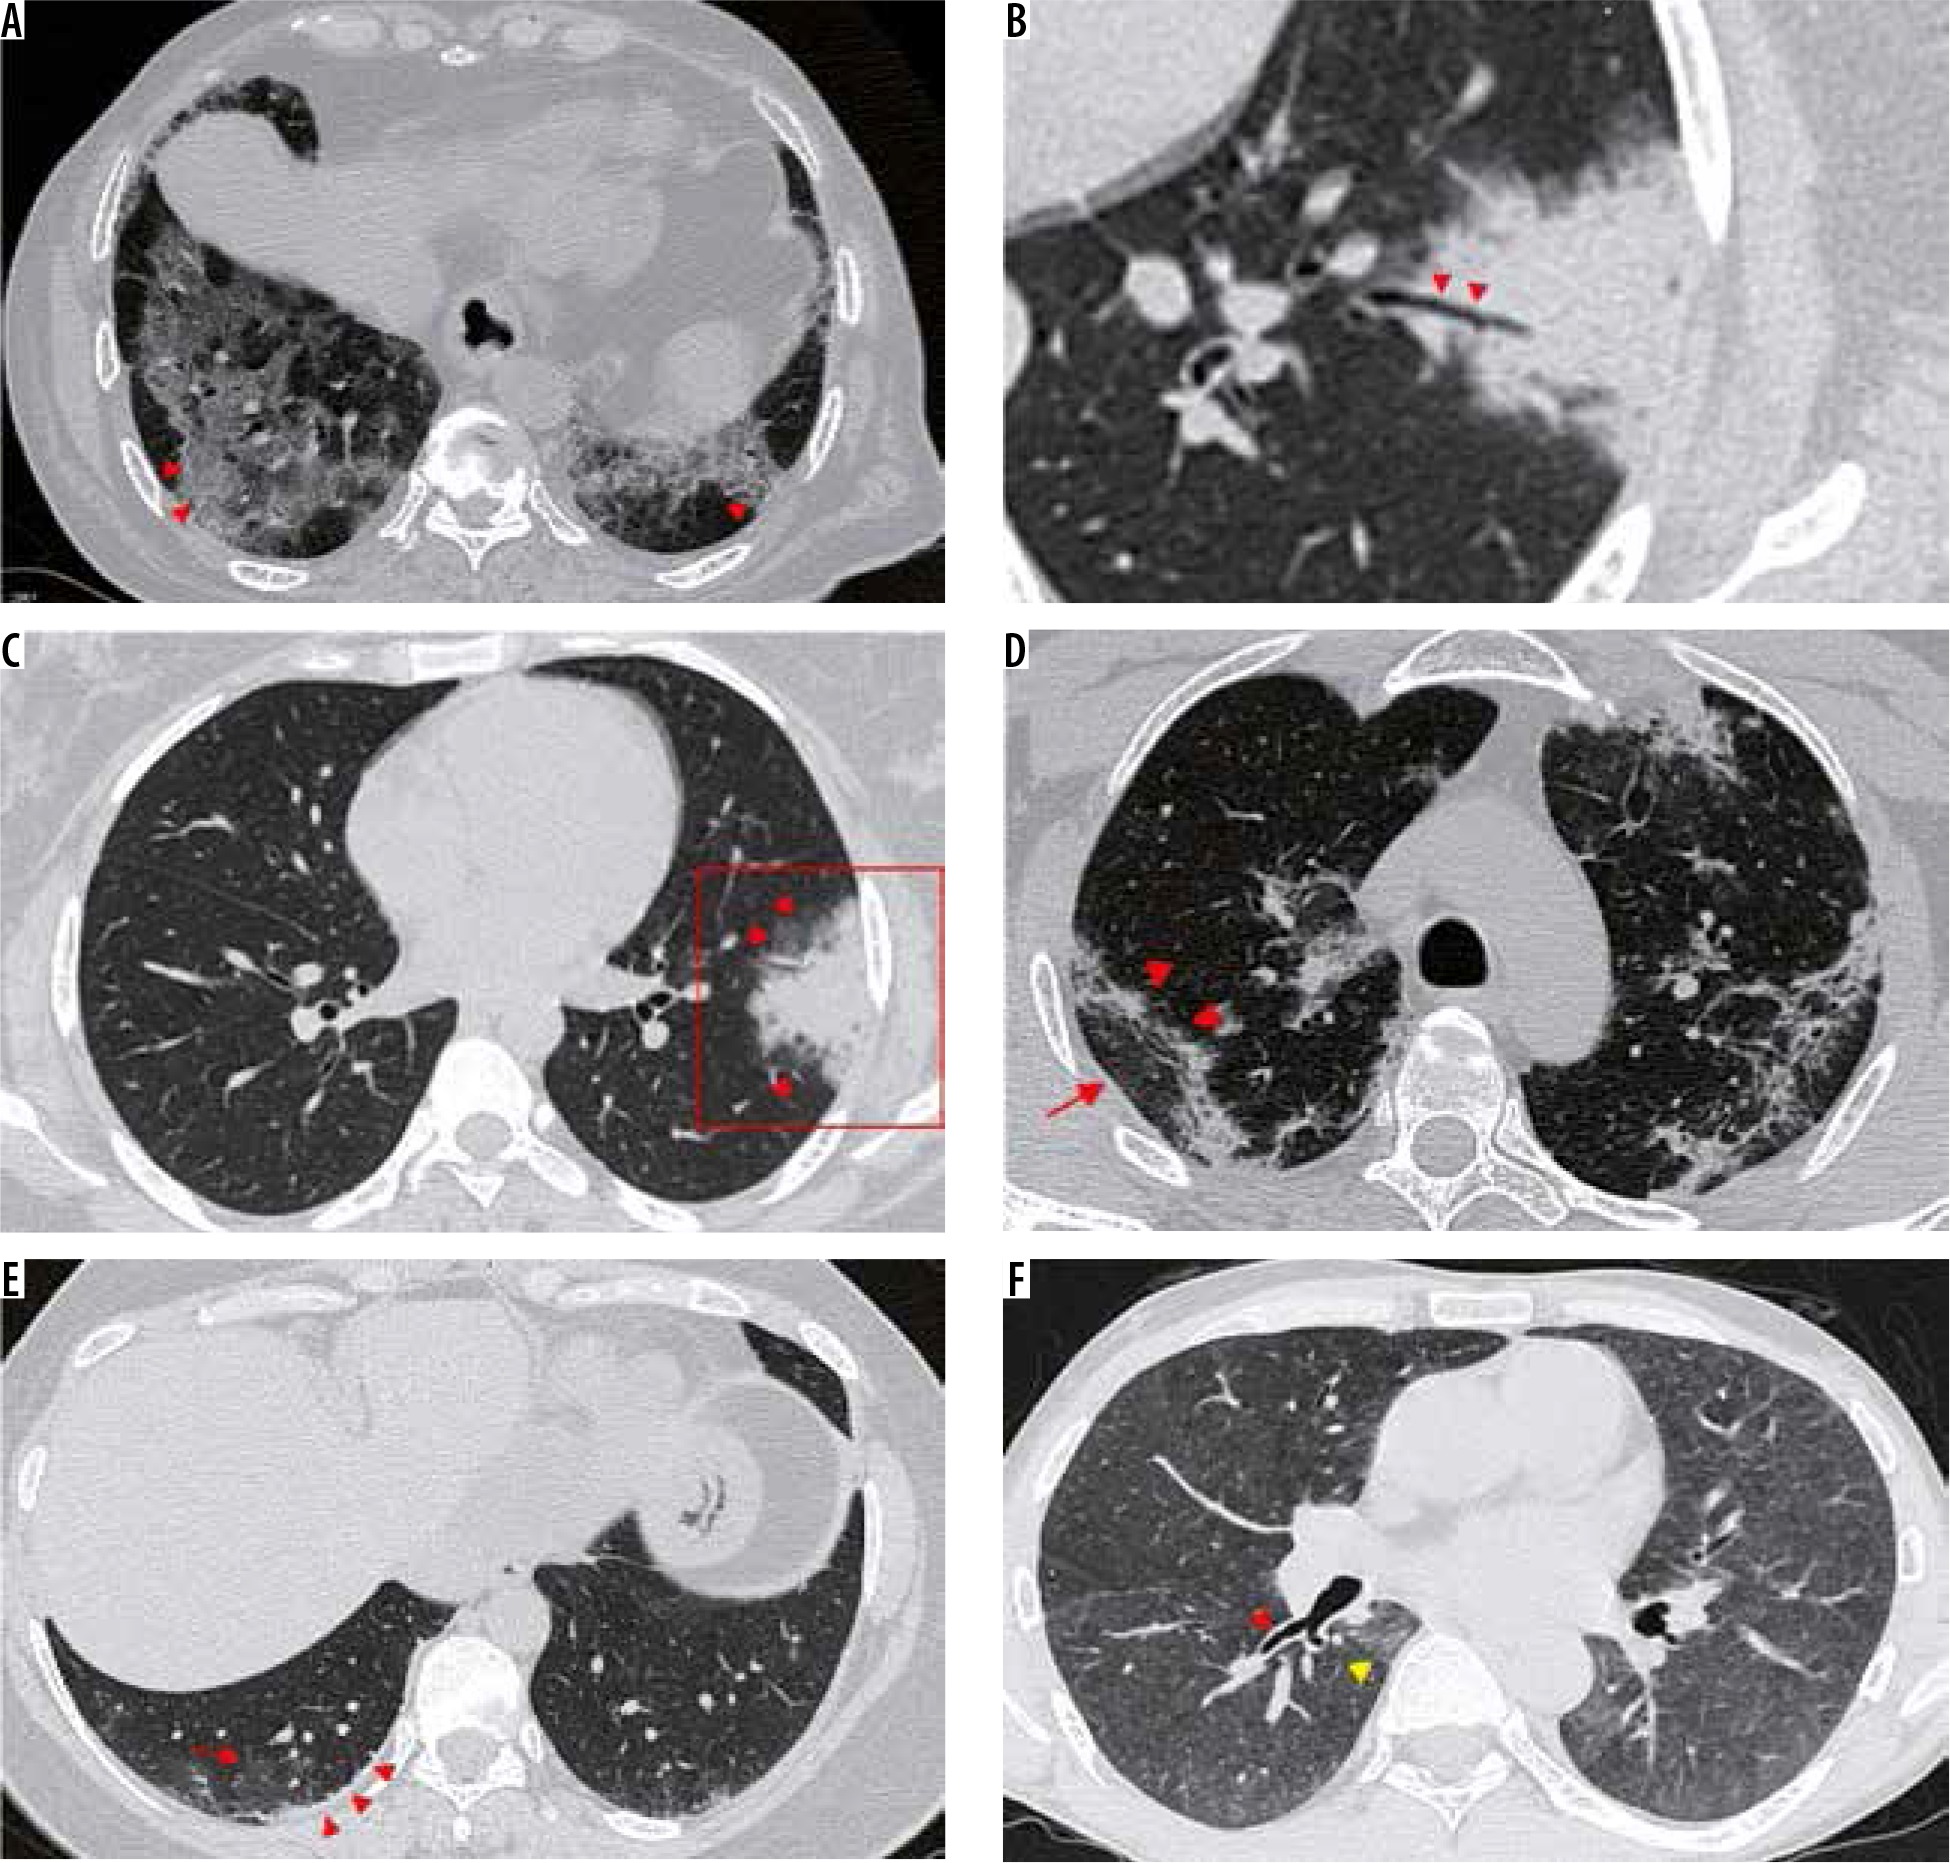
Figure 10
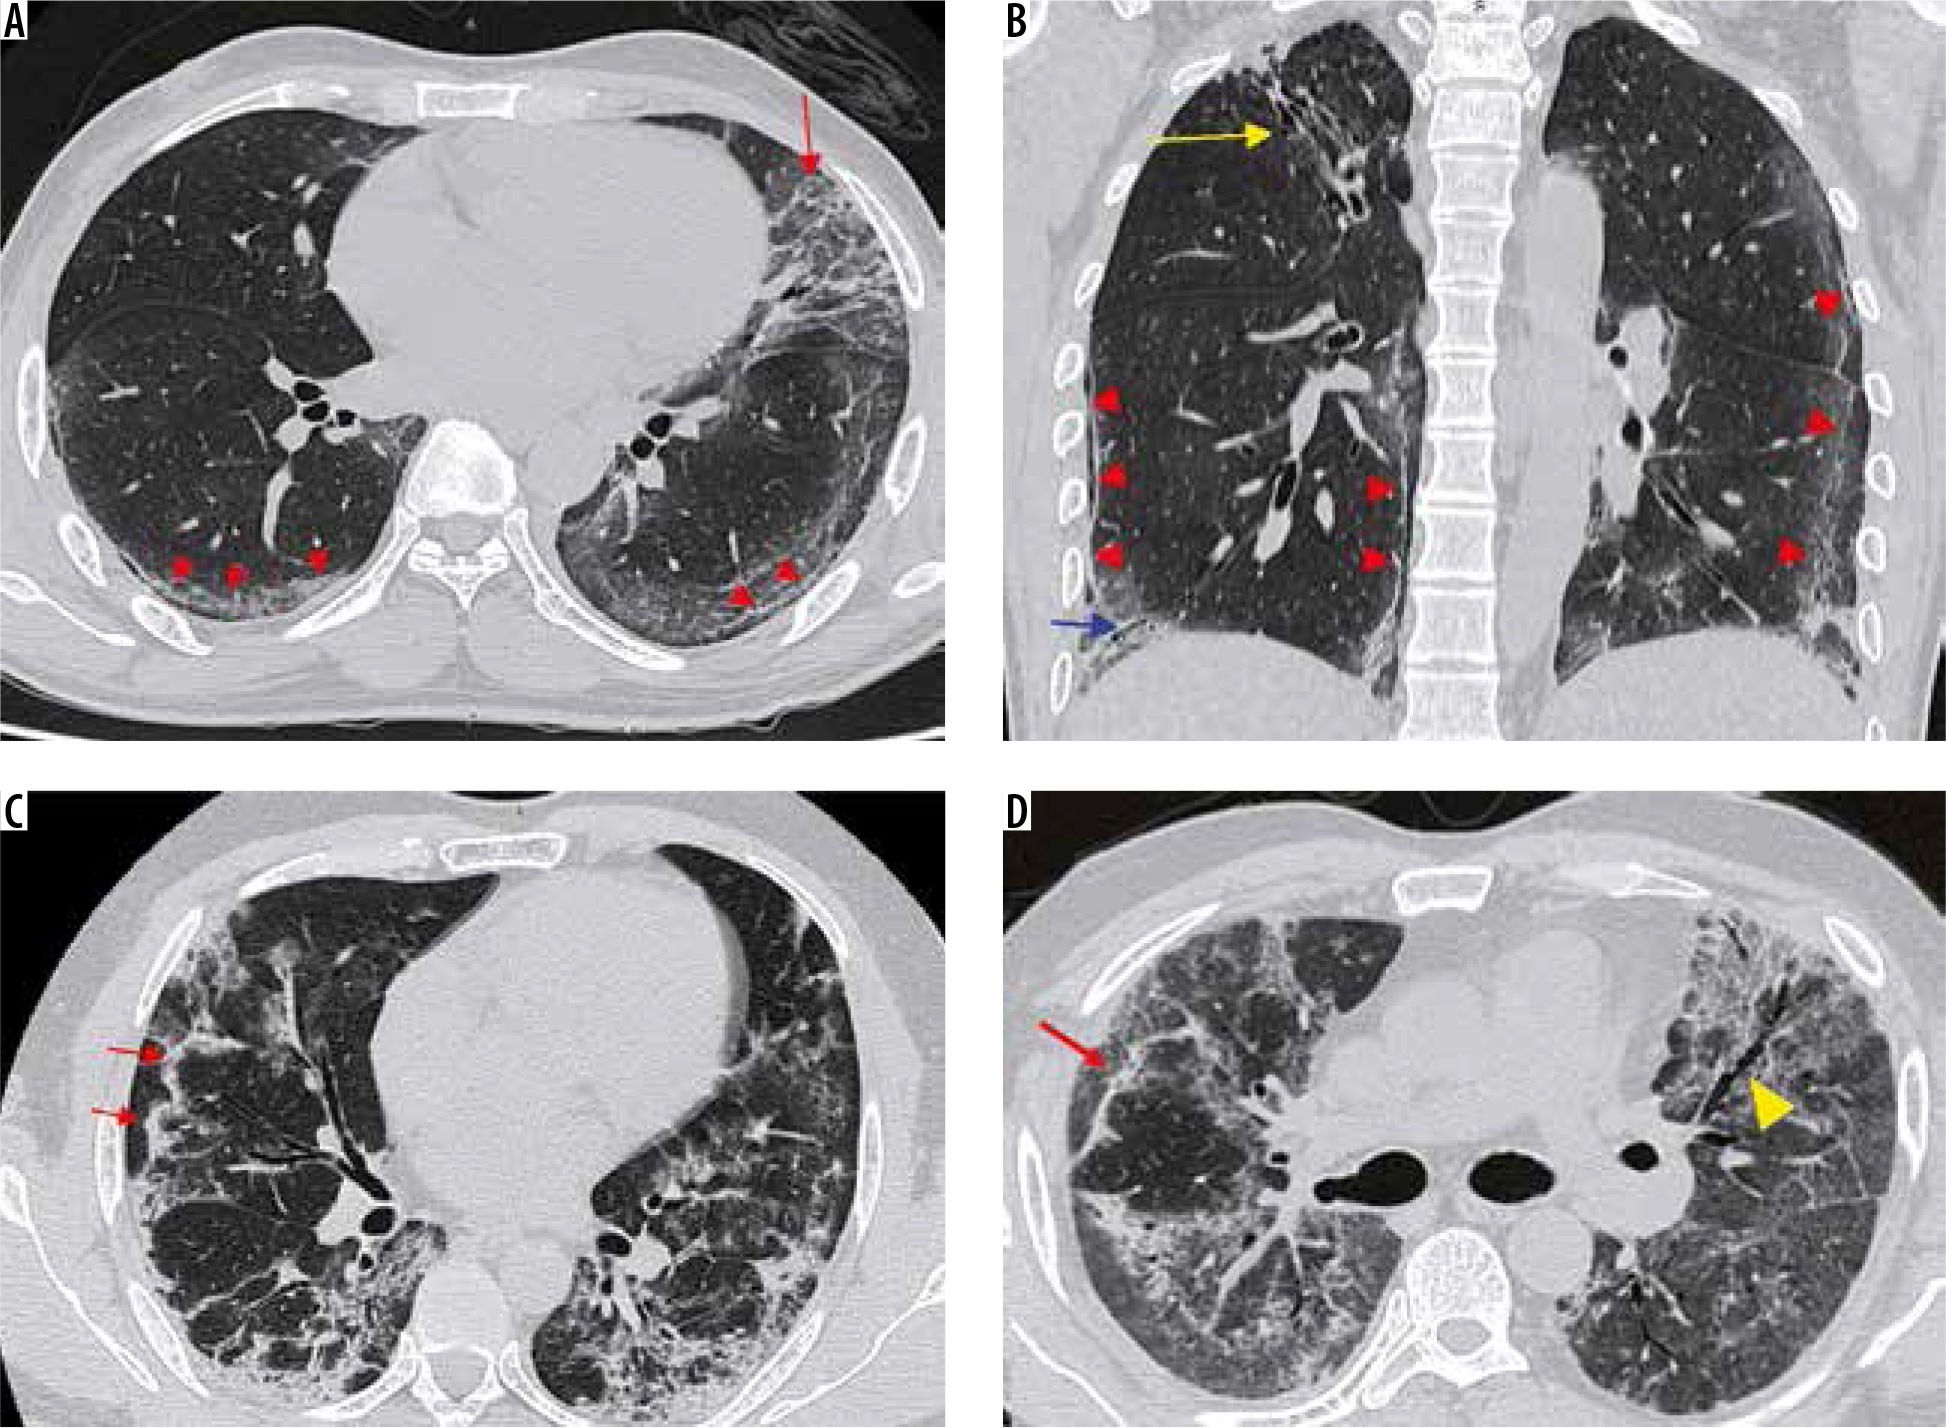
Axial thin sections of chest high-resolution computed tomography (HRCT) of patients with COVID-19 pneumonia in first and the second week of symptoms. A) A 50-year-old man with ground-glass opacities (GGOs) and interlobular septal thickening giving a crazy paving appearance in the superior segment of the right lower lobe (red arrowheads). B) Coned down axial HRCT chest image shows patchy consolidation with a traversing patent bronchus – air bronchogram (red arrowheads) in the left lower lobe of a 26-year-old female presenting with high-grade fever. The surrounding GGO gives the appearance of a halo (halo sign). This is better depicted in (C) obtained at another level (red arrowheads). D) A 37-year-old female with COVID-19 pneumonia. HRCT chest obtained 9 days after symptom onset, shows perilobular consolidation (red arrowheads) with reticular densities in both upper lobes giving rise to a reverse halo – atoll sign (red arrow). E) Lower sections of the chest in the same patient as (D) shows ill-defined GGOs in the posterobasal segment of the right lower lobe (red arrow) with adjacent pleural thickening (red arrowheads). F) Bronchial wall thickening (red arrowhead) in a 40-year-old male. Note the subtle GGO in the medial basal segment of the right lower lobe (yellow arrowhead)
Chest CT in this stage shows new focal lesions with an increase in the density of the previous GGOs, resulting in consolidations with air bronchograms.
Crazy paving pattern (Figure 10A): Thickening of the interlobular septa with superimposed GGOs is known as crazy paving appearance, similar to the irregular pavement stones. This finding is relatively rare in COVID-19 pneumonia and results from alveolar oedema with superimposed interstitial inflammation [15]. The appearance of crazy paving on CT along with diffuse GGOs and consolidations may be an indication of the disease entering the progressive stage [18].
Consolidation (Figure 10B): When the alveolar air is replaced by blood, fluid, or tissue, the result is an increase in the parenchymal opacity that obscures the vascular margins and the airway walls [15]. Multifocal bilateral patchy consolidations with a peripheral and subpleural predominance in a peribronchovascular distribution is another common presentation of COVID-19 pneumonia. It is thought to occur due to cellular and fibro-myxoid exudates within the alveoli [19]. The role of positron emission tomography/ computed tomography (PET/CT) in COVID-19 pneumonia has been sparsely documented in the published literature with few reports of 18-fluoro-deoxy-glucose (FDG) avidity within the consolidations and associated mediastinal lymph nodes, similar to Middle East respiratory syndrome (MERS) or H1N1 influenza virus [20,21].
Halo and reverse halo signs (Figure 10C-D): Halo sign refers to nodules surrounded by GGO [15]. This sign is seen in hyper-vascular metastasis and angio-invasive fungal infections due to perilesional haemorrhage. It has also been described in atypical infections and organising pneumonia [22], the pathophysiology of which is unclear.
The reverse halo or atoll sign is defined as a focal rounded GGO or normal lung parenchyma surrounded by a ring of consolidation [15].
Pleural changes (Figure 10E): Pleural thickening and pleural effusion have rarely been reported in the disease, with pleural thickening being relatively more common [23]. The appearance of pleural effusion may suggest a poorer prognosis in COVID-19, similar to the findings in the Middle East respiratory syndrome corona virus (MERS-CoV) [23].
Airway changes (Figure 10F): Bronchiectasis and bronchial wall thickening have been reported in multiple cases; these findings are likely to be due to inflammatory damage to the bronchial walls followed by fibrosis, scarring, and resultant traction bronchiectasis [17,24].
Air bubble sign (Figure 11): A section through an area of bronchiolectasis or partial resorption of consolidation may give rise to central lucencies, which are referred to as air bubble sign [23].
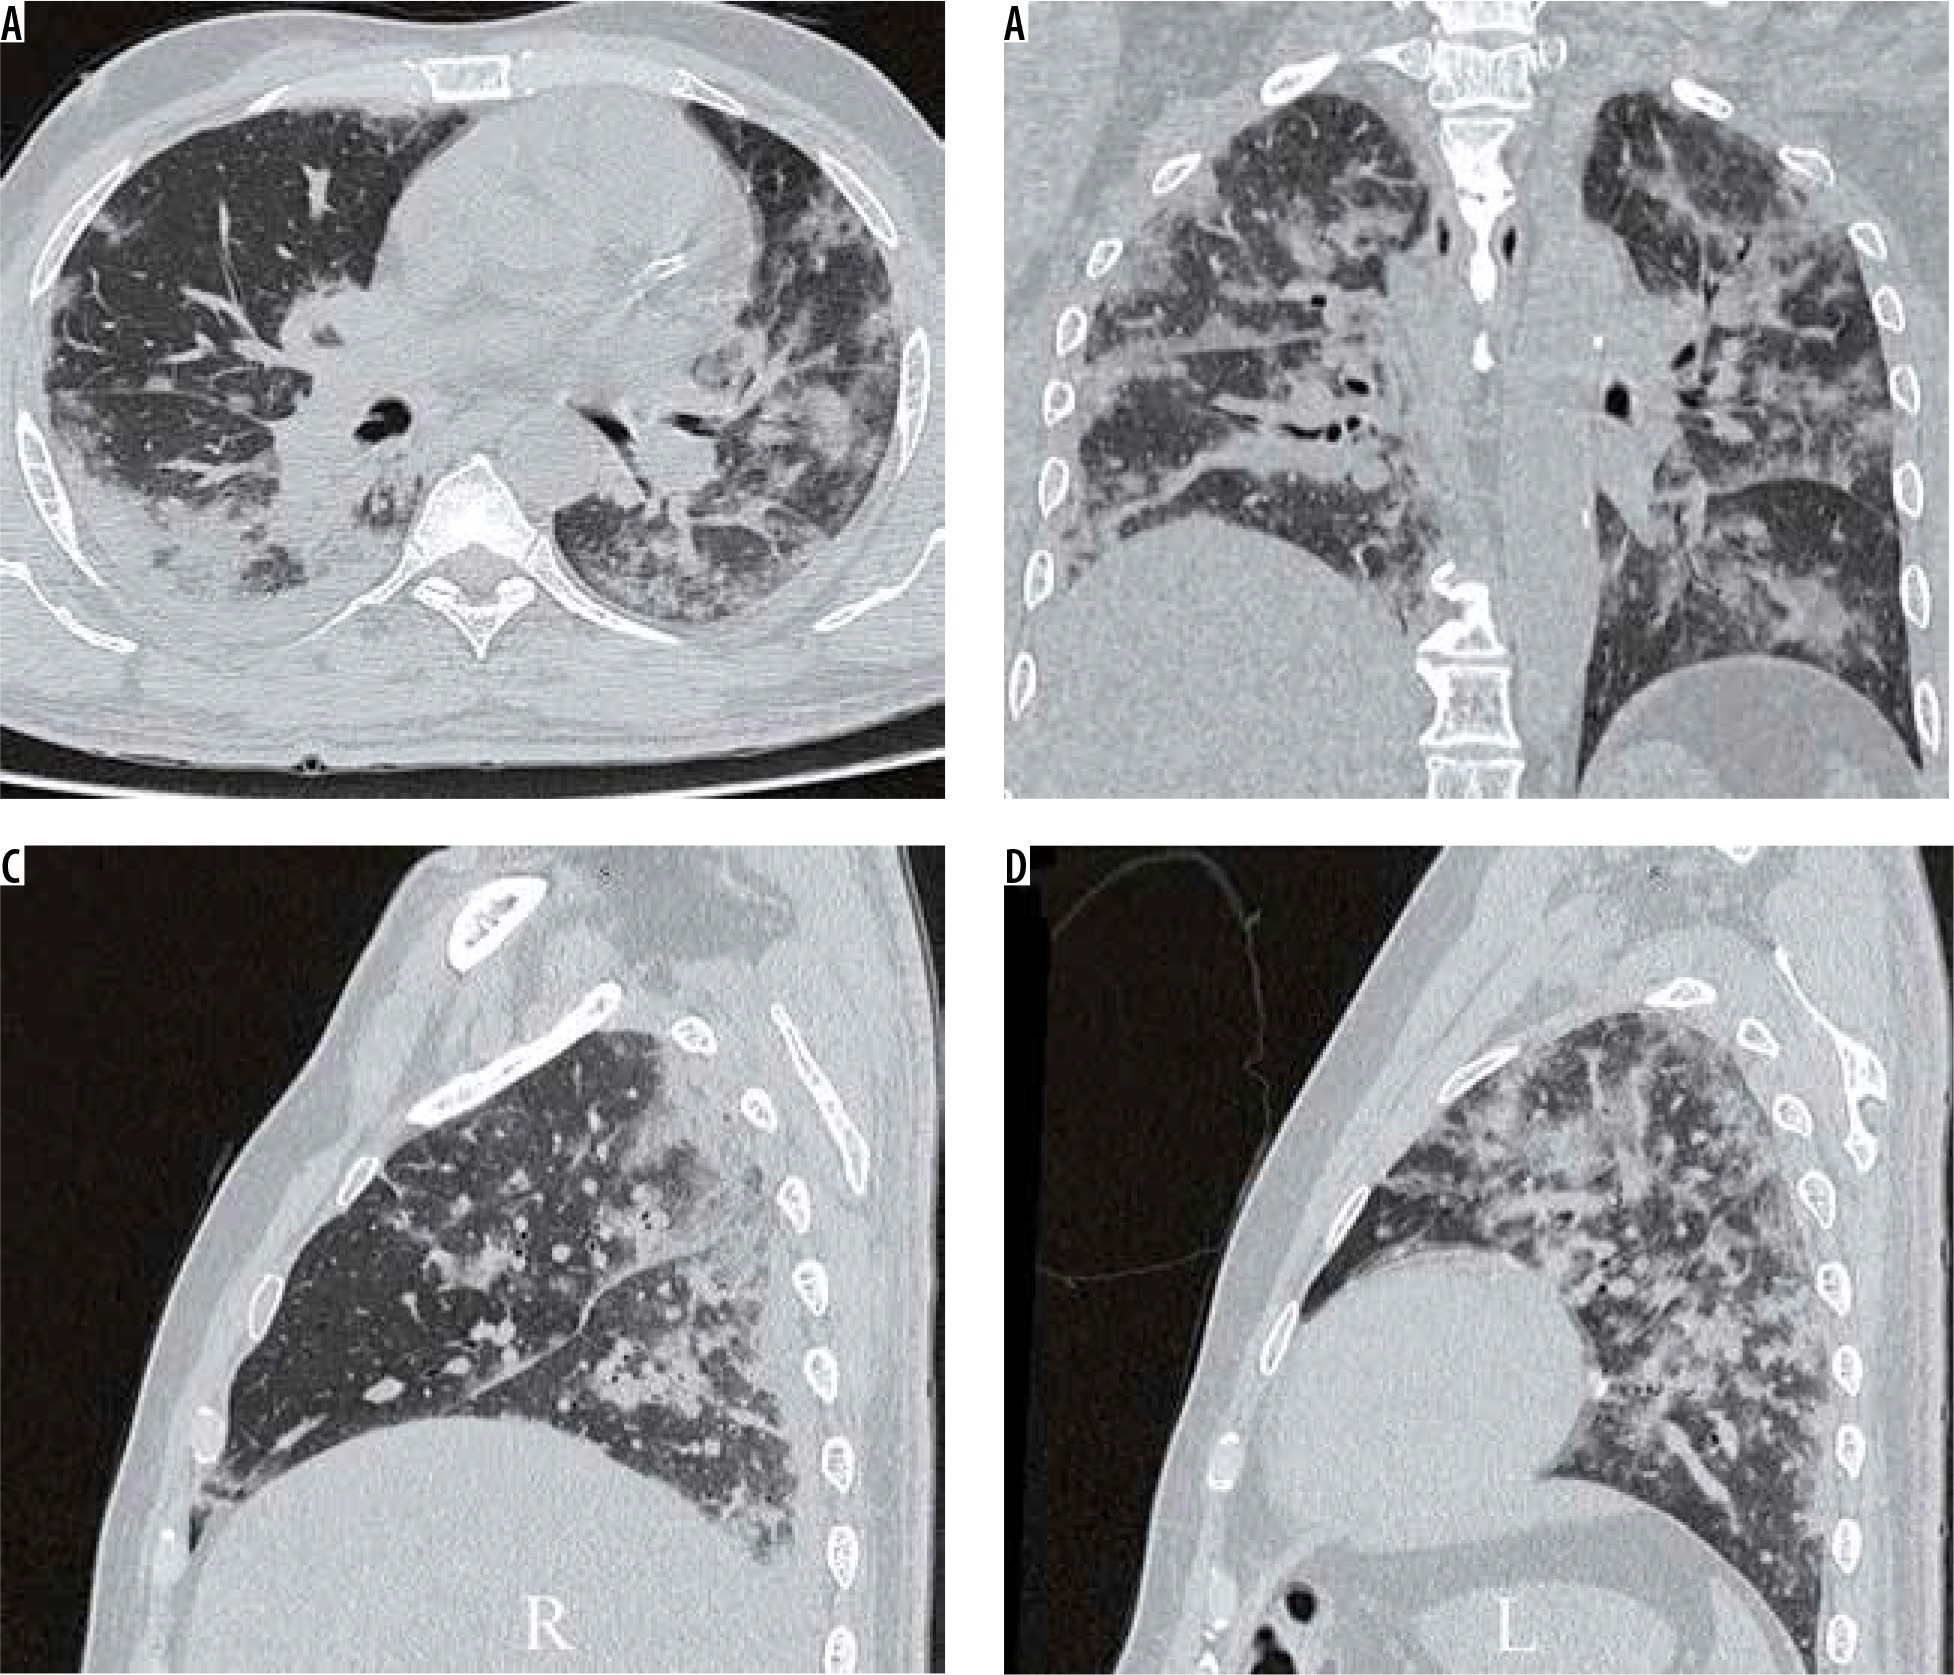
Severe stage (9-13 days) (Figure 12B)
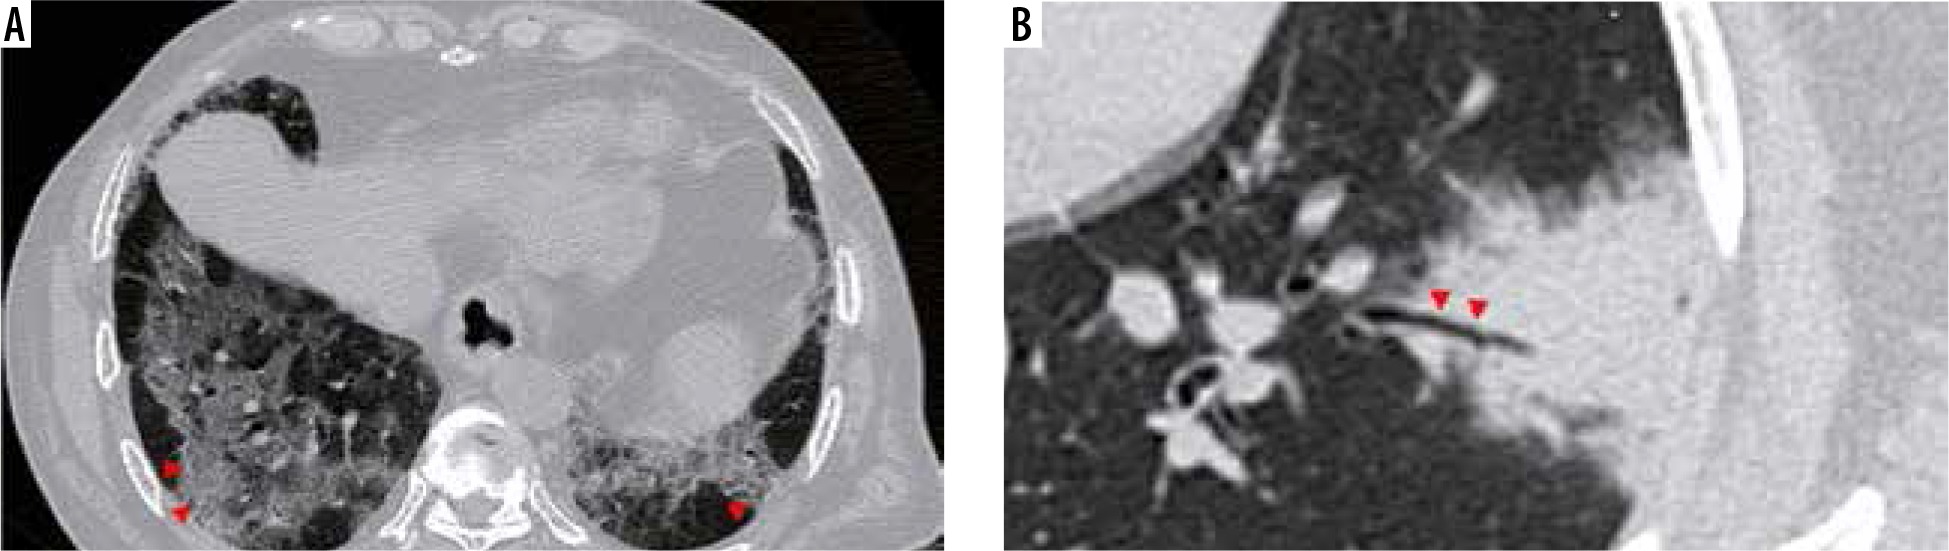
Figure 12
A 38-year-old diabetic female presented with two days of cough, fever, and breathlessness. A) Initial high-resolution computed tomography chest shows subtle ground-glass opacities (GGOs) in both lower lobes (red arrows). However, her condition in the ward worsened over the next 10 days. A repeat scan (B) shows multifocal dense GGOs with forming consolidations in both lung fields suggestive of severe stage of COVID-19 pneumonia
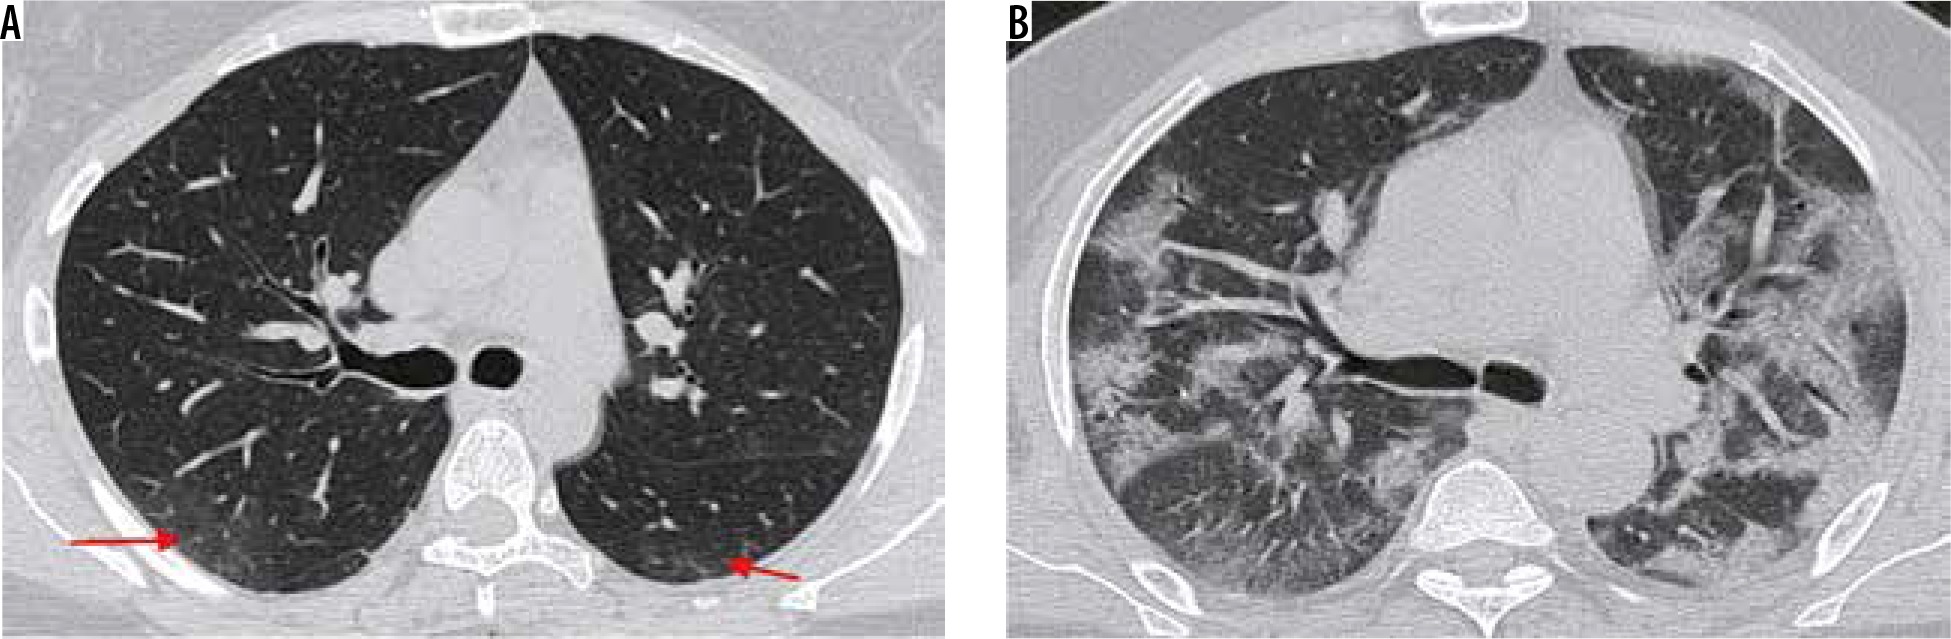
This stage shows diffuse multifocal consolidations with air bronchograms and bronchial dilatation.
Dissipation stage (≥ 14 days) (Figure 13)
Figure 13
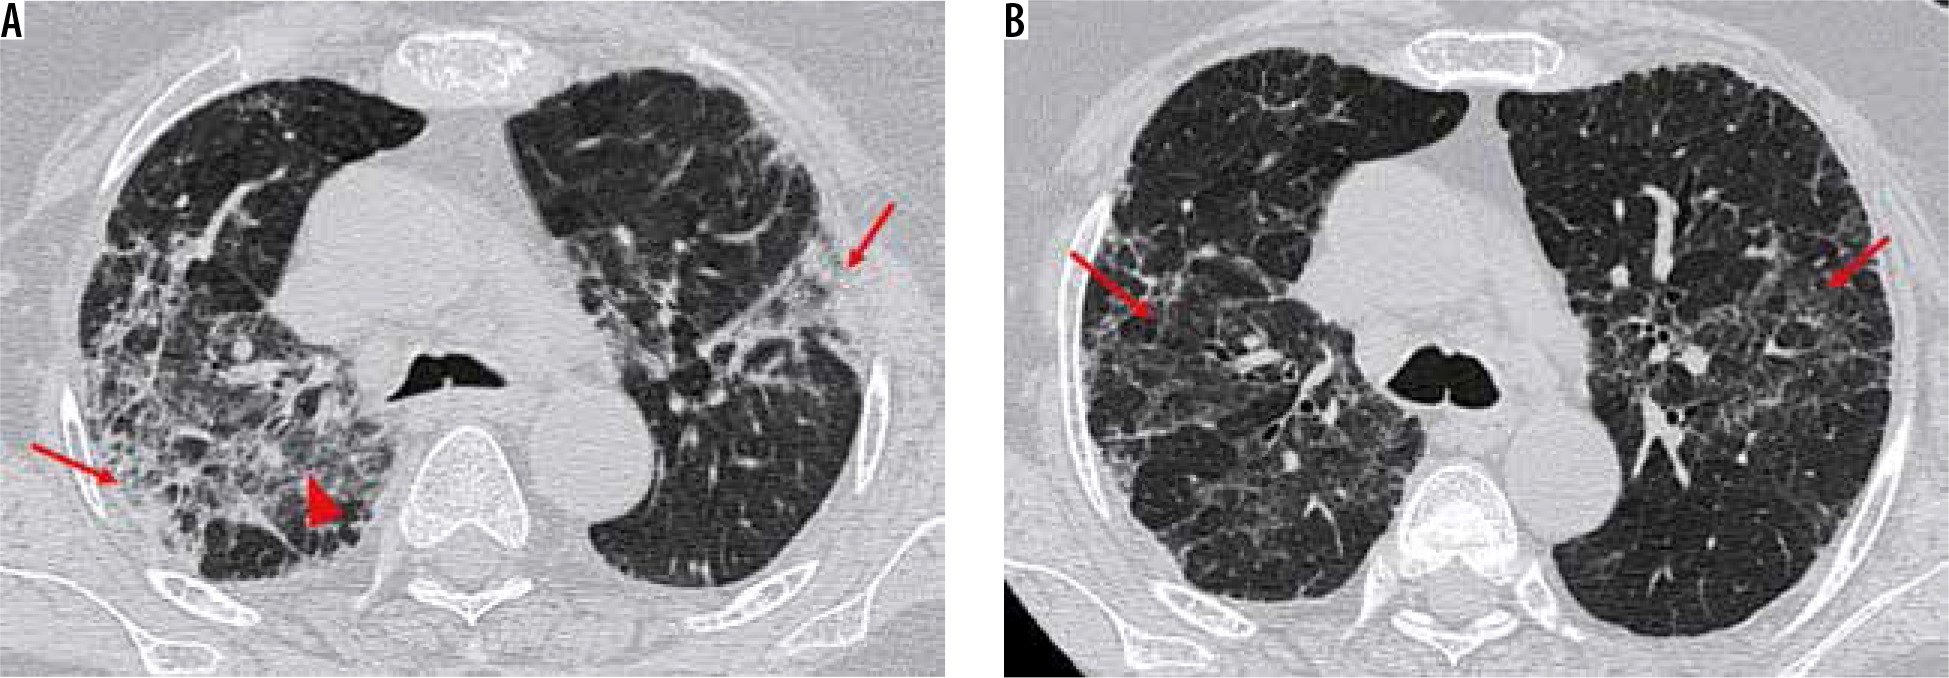
Typical findings of dissipative stage of COVID-19 pneumonia on high-resolution computed tomography chest. A-B) A 47-year-old man with symptoms for 12 days. Axial (A) and coronal (B) chest computed tomography (CT) images show curvilinear fibrotic lines parallel to the chest wall in both lung fields (red arrowheads) with extensive reticulations in the upper lingula (red arrow) and traction bronchiectasis (blue arrow). Also note fibrotic strands with adjacent pleural thickening and bronchiectasis in the right upper lobe (yellow arrow) as a sequalae to prior tubercular infection. C) Axial CT chest image in a 42-year-old female shows curvilinear opacities parallel to the chest wall (red arrows) with adjacent reticulations. D) Similar findings are also seen in another patient in dissipative stage of the disease (red arrow). Also note associated traction bronchiectasis in the left upper lobe (yellow arrowhead)
This stage is seen most commonly after two weeks and is characterised by gradual resolution of the GGOs and consolidations with residual fibrosis and curvilinear lines.
Subpleural curvilinear lines and fibrosis: Fine curvilinear opacities paralleling the pleural surfaces are seen in COVID-19 pneumonia which is related to fibrosis. Other fibrotic stripes may result due to scarring from chronic inflammation. Some authors believe the appearance of fibrosis is a good prognostic sign in the disease, indicating stabilisation of the disease status [18,25]. However, it may progress to interstitial lung disease subsequently.
Patients in advanced or severe stages of the disease can progress to dissipation stage with residual fibrosis [25]. This temporal evolution is best evaluated on chest HRCT (Figure 14).
Figure 14
Temporal changes in a 55-year-old man with COVID-19 pneumonia on chest high-resolution computed tomography. A) Axial computed tomography (CT) chest images shows ground-glass opacities (GGOs) (red arrowhead) with interlobular septal thickening and formation of consolidations in both lung fields (red arrow). B) Follow-up chest CT performed after 1 month shows reduction in GGOs as compared to (A) with residual fibrosis (red arrows), suggesting progression to dissipation stage
COVID-19 Reporting and Data System (CO-RADS)
The “COVID-19 Standardised Reporting” working group of the Dutch Radiological Society has introduced CO-RADS as a standardised HRCT chest-based assessment scheme for suspected COVID-19 patients in similar lines to the systems used for breast and lung malignancies [26]. CO-RADS measures the suspicion for COVID-19 pneumonia using chest HRCT on a scale from 1 (very low probability) to 5 (very high probability) as well as CO-RADS 0 for technically inappropriate studies and CO-RADS 6 for RT-PCR-proven SARS CoV-2 infection. The CO-RADS categories with associated findings are summarised in Table 1, examples of which have been depicted in Figure 15.
Table 1
CO-RADS score
Figure 15
Representative axial high-resolution computed tomography (HRCT) chest images depicting CO-RADS. A) Normal HRCT chest: CO-RADS 1. B) Centrilobular nodules with tree-in-bud configuration in the right lung (red arrowheads) – bronchiolitis, later diagnosed as active pulmonary tuberculosis. CO-RADS 2. C) Dense consolidation with air bronchogram (red arrow) and surrounding ground-glass opacity (GGO) in a patient with Klebsiella pneumonia: CO-RADS 3. D) Peribronchovascular GGOs in the left lung (blue arrows): CO-RADS 4. Nasopharyngeal swab was positive for SARS-CoV-2. E) Peripheral and subpleural predominant multifocal GGOs with interlobular septal thickening – crazy-paving appearance (red arrows) in both lungs: CO-RADS 5. This was later proven to be COVID-19 pneumonia. F) Extensive, peripheral confluent bilateral GGOs with septal thickening in a patient with acute respiratory distress syndrome secondary to COVID-19 pneumonia
Total Severity Score
Visual quantification of lung inflammation and correlation with clinical severity of the disease were performed by Li et al. [27]. In their study, patients were classified into 3 subgroups based on the clinical severity: mild (minimally symptomatic patients with normal CT), common, and severe-critical (patients with CT findings of COVID-19 and varying clinical manifestations). A CT visual quantitative score was devised by evaluating lung inflammation involving each lobe and summing up the scores of all five lobes. Each lobe was assessed for the percentage of lobar involvement: none (0%), minimal (1-25%), mild (26-50%), moderate (51-75%), and severe (76-100%), which corresponded to scores of 0, 1, 2, 3, and 4, respectively. The score called the Total Severity Score (TSS) was obtained by adding up the severity scores of all the 5 lobes (ranging from 0 to 20). TSS showed a significant difference between the common type and severe-critical type patients with a cut-off of 7.5 having a high sensitivity and specificity [27]. Calculation of TSS score in a prototype case are shown in Figure 16.
Figure 16
Total Severity Score (TSS) calculation in COVID-19 pneumonia using high-resolution computed tomography chest. Axial (A) and coronal (B) chest computed tomography (CT) images in a 42-year-old man with clinically severe COVID-19 pneumonia shows multifocal peripheral ground-glass opacities and consolidations in both lungs. Sagittal reformatted images of the right lung (C) and left lung (D) show less than 25% involvement of right middle lobe (score 1); right upper and both lower lobes have a score of 2 each, and left upper lobe has a score of 3. The TSS in this patient was 10, correlating with the clinical severity
Association with pulmonary thromboembolism (Figure 17)
Figure 17
A 25-year-old man with COVID-19 pneumonia presenting with sudden onset breathlessness. A) Computed tomography (CT) pulmonary angiogram image shows an eccentric partial thrombus in the right descending pulmonary artery extending into the right middle lobe branch (red arrows). B) Axial CT image with lung window at the same level shows multifocal ground-glass opacities in both lung fields
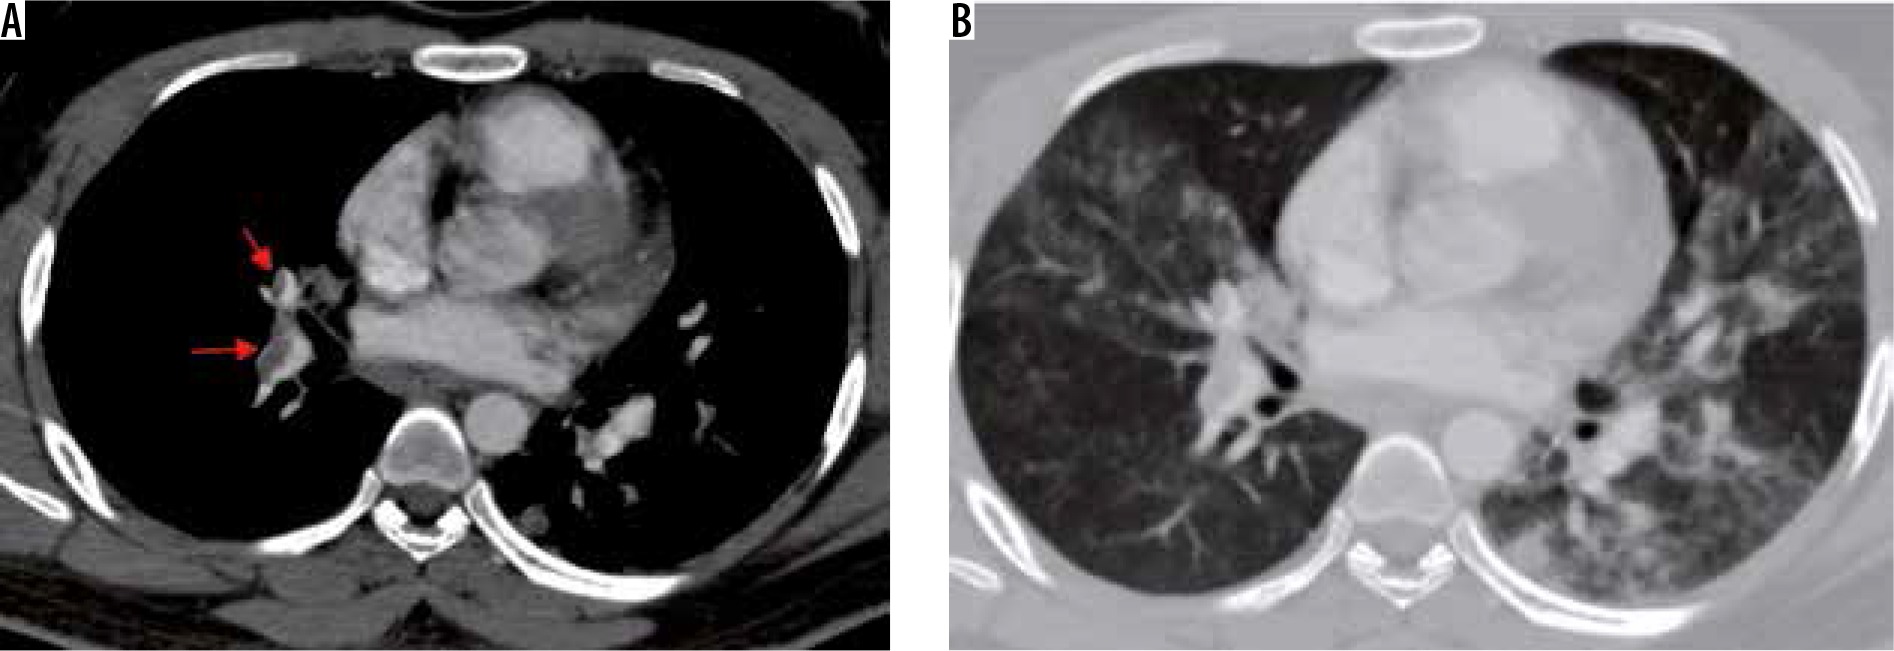
Thrombotic complications of COVID-19 infection causing significant morbidity and mortality have recently been recognised in published literature [28-30]. Various manifestations such as deep venous thrombosis, pulmonary embolism, ischaemic stroke, and acute myocardial infarction have been reported. The pathophysiology has been ascribed to endothelial injury, inflammation, and microvascular thrombosis [30].
Atypical imaging features (Figure 18)
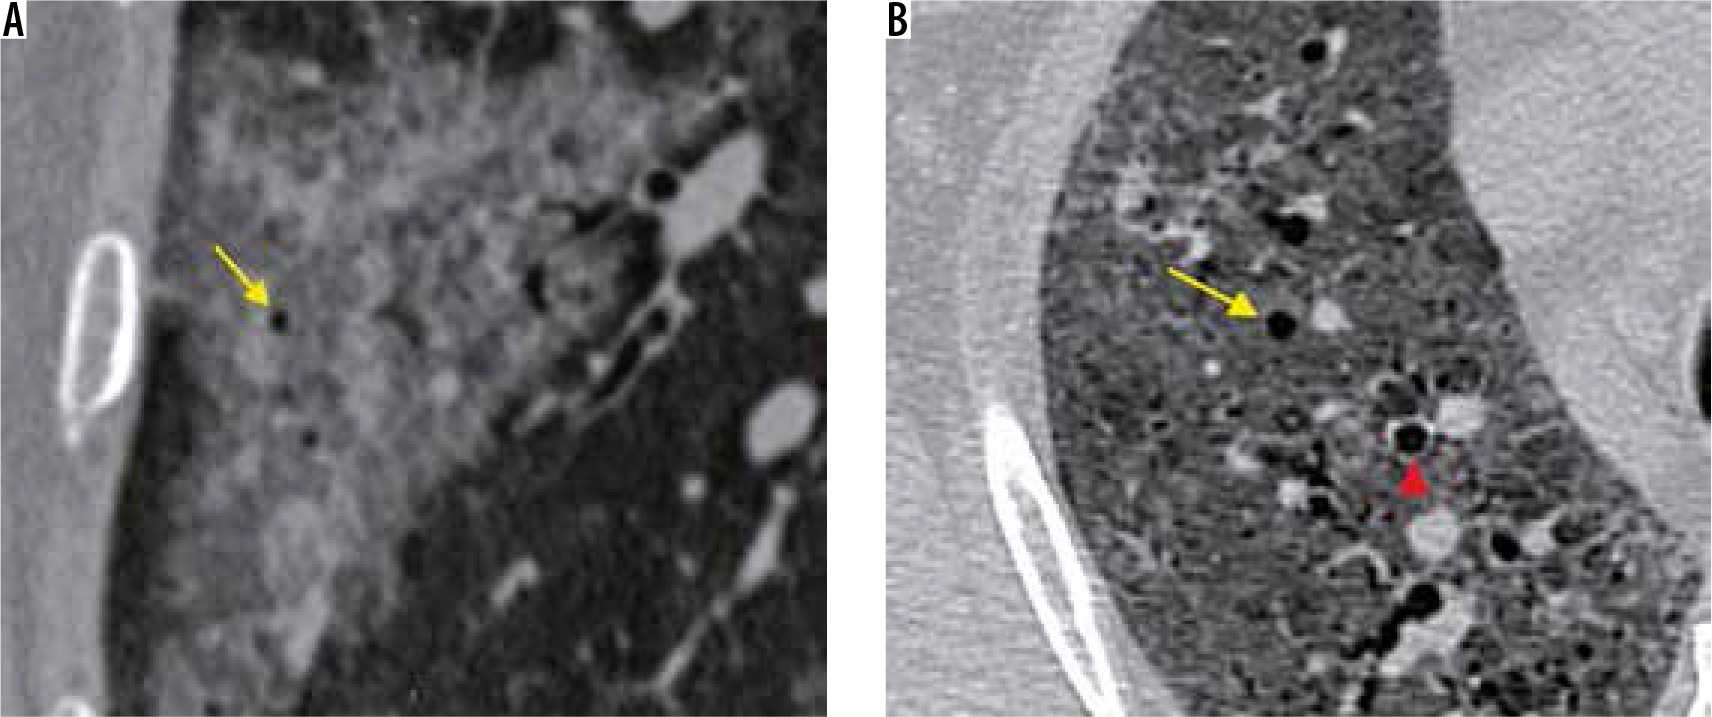
Figure 18
Atypical computed tomography (CT) chest findings in COVID-19 pneumonia. A) Axial chest CT image in a 32-year-old man in dissipative stage of disease shows an enlarged right paratracheal lymph node. B) Axial high-resolution computed tomography chest image in the same patient shows interlobular septal thickening with traction bronchiectasis and ground glass opacities suggestive of progression to interstitial lung disease. C-D) Axial chest CT images in 2 different patients with COVID-19 pneumonia show small subsolid nodules (red arrows)
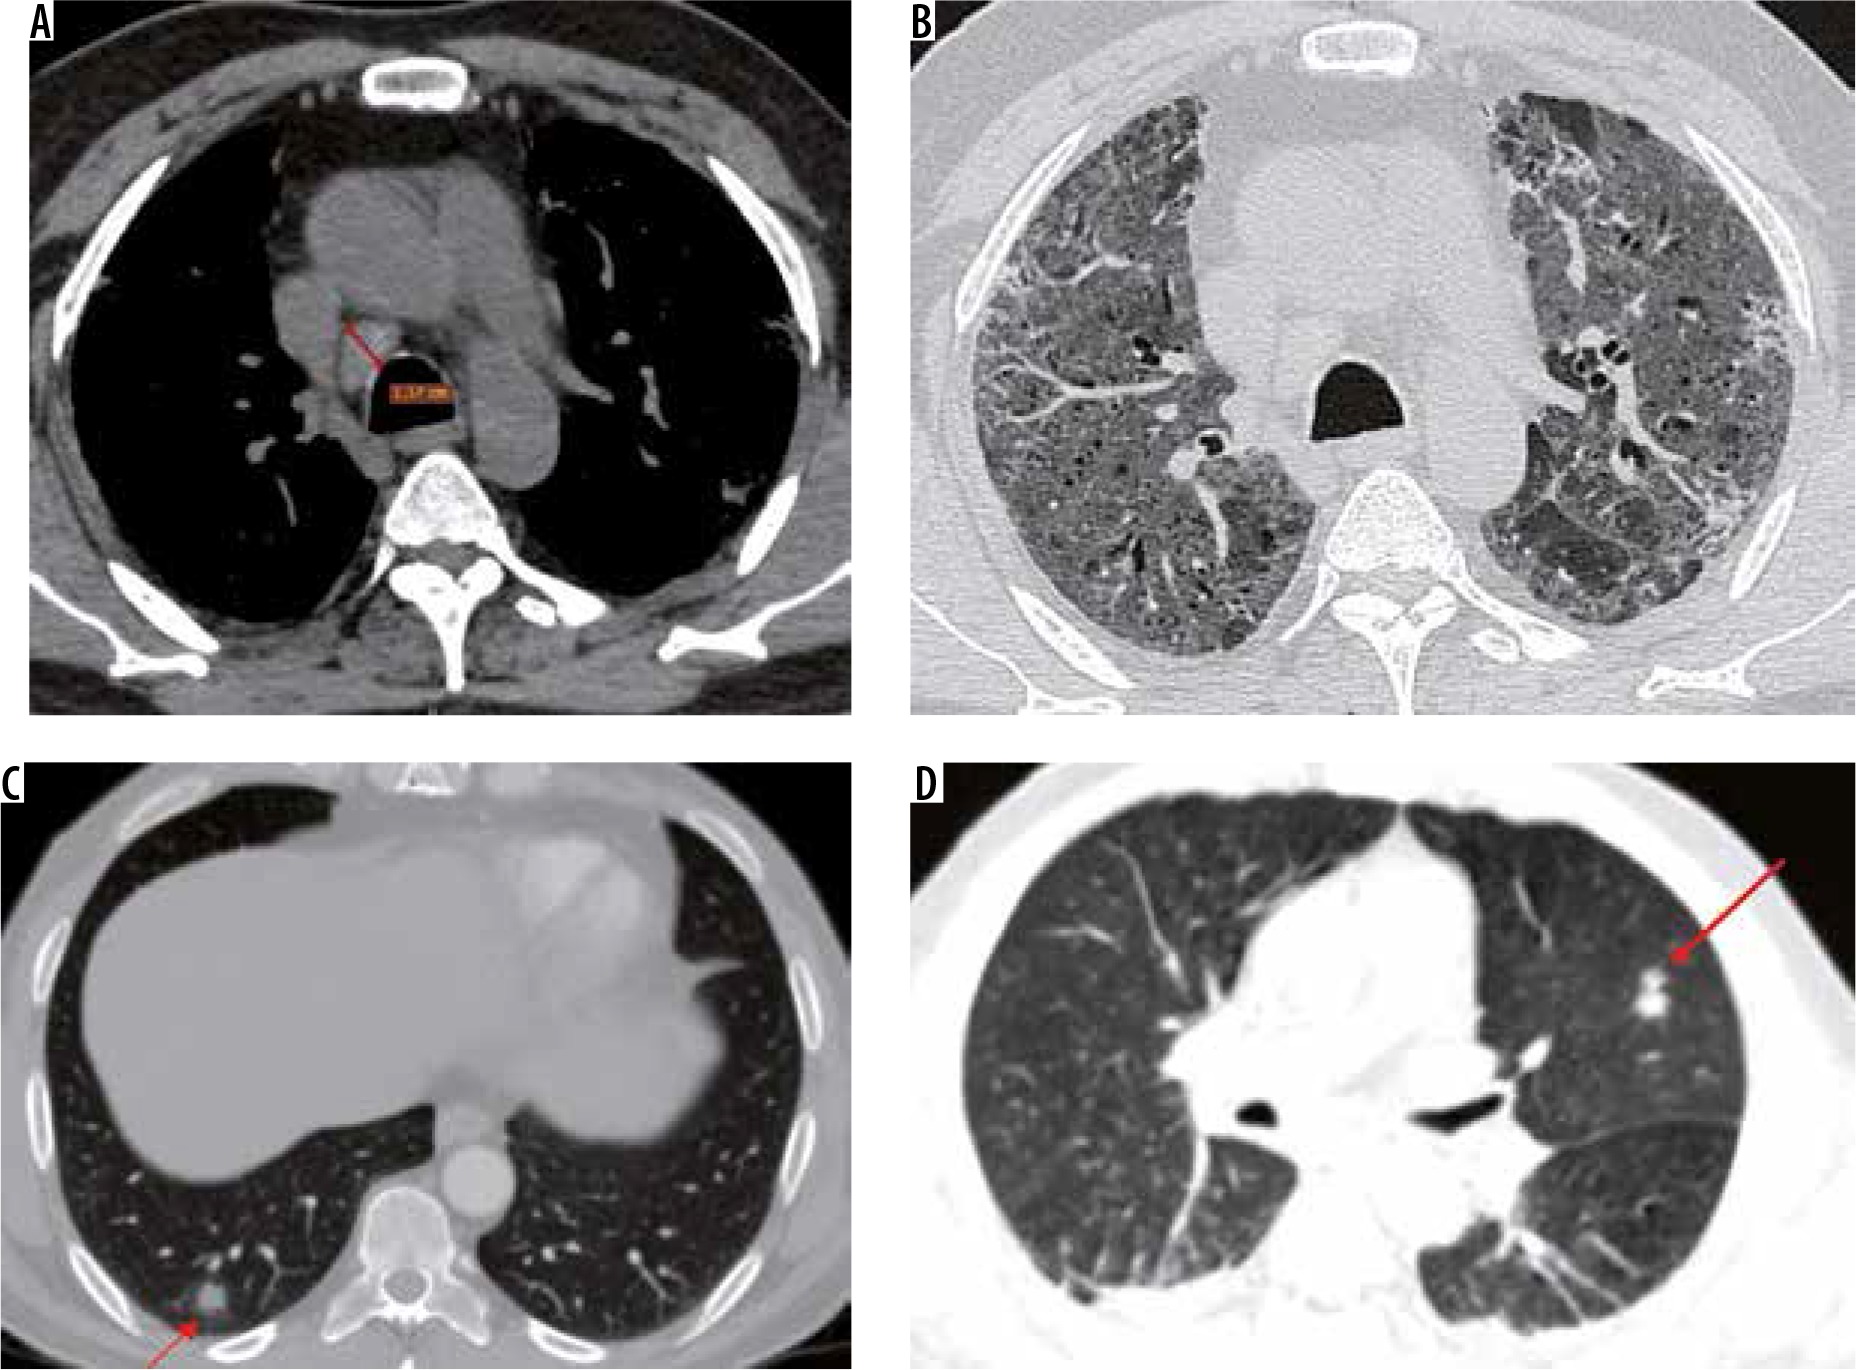
The presence of pulmonary nodules, mediastinal lym-phadenopathy, and pleural effusions is rare in patients with COVID-19 [31]. At our institution, we have occasionally come across COVID-19 patients with enlarged mediastinal lymph nodes that could not be attributed to any other pathology (Figure 18A). A lymph node is classified as enlarged if it measures more than 10 mm in the short axis. Rare cases of COVID-19-positive patients with subsolid pulmonary nodules have also been observed (Figure 18C-D).
The typical mild COVID-19 pneumonia usually starts as a small subpleural, unilateral, or bilateral GGO in the lower lobes. This then develops into the crazy-paving pattern and subsequent consolidation, with an ARDS-like imaging pattern in severe cases. The lesions gradually resolve with residual GGO and subpleural parenchymal bands over two weeks. This temporal evolution of the disease is illustrated in Figure 19.

Differential diagnosis
Viruses are an important cause of respiratory tract infections, with overlapping clinical features and imaging findings. Although the imaging appearance of COVID-19 is similar to that of other viruses like influenza, parainfluenza virus, and respiratory syncytial virus, significant differences do exist. Both human parainfluenza and influenza viruses show centrilobular nodules in addition to GGOs and consolidations [14]. Because severe acute respiratory syndrome (SARS) and MERS belong to the same coronavirus family, they share clinical features and imaging findings with COVID-19 pneumonia. Peripheral multifocal air space opacities are seen in all the 3 viral pneumonias; however, SARS has a greater incidence of focal unilateral involvement in the early course of disease, while both COVID-19 and MERS are predominantly bilateral. MERS pneumonia has a higher incidence of pleural effusions and upper-lobe involvement as compared to COVID-19 pneumonias [32]. A final diagnosis is often made with laboratory analysis and virus isolation.
Conclusions
COVID-19 has affected every country throughout the world due to its contagious nature. Even though a large segment of the population has been affected, the fatality rate is higher in people with comorbidities. In the fight against this pandemic, radiologists play a crucial role in the rapid identification and early diagnosis of suspected patients. Thorough knowledge of the imaging features of COVID-19 pneumonia can allow for early containment and prompt response to help overcome this pandemic.