


Introduction
Mucormycosis is an angio-invasive disease caused by the ubiquitous, saprophytic fungi of the order Mucorales of the phylum Zygomycota [1,2]. Rhino-orbital-cerebral (ROC) mucormycosis, which is caused by these saprophytic fungi, occurs in the paranasal sinuses and spreads to the orbit and brain [3,4].
An alarming surge has been seen in the cases of concurrent acute invasive fungal rhinosinusitis (AIFRS)/ROC mucormycosis and coronavirus disease 2019 (COVID-19) infection; especially during the second wave of the COVID-19 pandemic in India. Uncontrolled diabetes mellitus, iron overload, immune-compromised states (due to corticosteroid therapy and prolonged stay in an intensive-care unit), along with systemic immune alterations due to Coronavirus infection; have been considered as risk factors responsible for the emergence of this notifiable epidemic of COVID-19-related opportunistic mucormycosis infection [5-9].
Recent IRIA-ICRI guidelines and recommendations on imaging in AIFRS/mucormycosis have highlighted the vital role played by imaging not only in the early diagnosis and assessment of extent of the disease, but also in the pre-surgical planning as well as follow-up evaluation of patients with mucormycosis [9,10].
This pictorial review proposes to illustrate the imaging spectrum of COVID-19-associated ROC mucormycosis in the head-neck-face region. It also aims to provide an imaging checklist while assessing such cases.
Imaging in COVID-19-related rhino-orbital-cerebral mucormycosis
Patients with a history of COVID-19 infection and clinical suspicion of ROC mucormycosis, who had been referred to our tertiary care diagnostic imaging facilities between March 2021 and July 2021 underwent both computed tomography (CT) and magnetic resonance imaging (MRI) of the paranasal sinuses, orbits, and brain. The images presented in this manuscript have been sourced from these patients, after obtaining informed consent. The tissue dia-gnosis of mucormycosis was confirmed in almost all the patients, based either on histopathology/cytopathology/direct microscopic examination of biopsy specimen or on a positive culture result.
Computed tomography imaging technique
Unenhanced and contrast-enhanced high-resolution computed tomography (HRCT) of the paranasal sinuses (PNS), orbits, and brain was performed either on a Philips Ingenuity 128-slice MDCT or a GE Revolution 32-slice MDCT system. On the 128-slice scanner, the HRCT was obtained using kVp/mAs 120/100, field of view (FOV) 220-250 mm, section thickness 0.50-0.65 mm, and matrix 768 × 768 for PNS and 512 × 512 for brain imaging. Whereas, on the 32-slice system, the HRCT was performed with the following parameters: kVp/mAs 120/80 for PNS imaging, kVp/mAs 140/160 for brain imaging, FOV 250 mm, section thickness 0.65-1.25 mm, and matrix 512 × 512.
Contrast-enhanced CT scan was obtained after intravenous injection of 60 ml of non-ionic iodinated contrast (Iohexol, Omnipaque 350; GE Healthcare, New Jersey, USA), at the rate of 1.5 ml/s with imaging delay of 70 seconds after the injection of contrast. The CT images were viewed in the coronal, sagittal, and axial planes in soft tissue and bone windows.
Magnetic resonance imaging technique
MRI examinations of the paranasal sinuses, orbits, and brain were performed on a Philips Ingenia 3.0 Tesla MRI scanner with the patient in a supine position, using a 32-channel Head Coil. The MRI protocol is elaborated in Table 1. MR angiography using time-of-flight (TOF) technique was performed whenever indicated, in order to evaluate the internal carotid arteries (ICAs) and their branches. Contrast-enhanced fat-suppressed images were obtained after a bolus intravenous injection of MRI contrast agent gadobenate dimeglumine (MultiHance, Bracco Diagnostics, Milan, Italy) in a dose of 0.1 mmol/kg body weight. Seven millilitres of this contrast was injected via the antecubital vein, followed by a 10-ml saline flush.
Table 1
Magnetic resonance imaging protocol
Structured reporting checklist
Scientific literature to date has described the staging of ROC mucormycosis based on the site of involvement [10]. The present pictorial review advocates interpretation of the CT and MRI images based on the following checklist: nasal cavity, nasal septum, nasal turbinates, paranasal sinuses and peri-sinus soft tissues, nasopharyngeal soft tissues, hard palate, maxillary and mandibular alveolar ridge, orbits, skull-base, brain, and vascular channels. The relevant CT and MRI findings as per this imaging checklist are presented in a tabulated format in Tables 2-5.
Table 2
Imaging checklist for nasal cavity including nasal septum and nasal turbinate
Table 3
Imaging checklist for paranasal sinuses and peri-sinus soft tissues
Table 4
Imaging checklist for nasopharyngeal soft tissues, hard palate, and maxillary and mandibular alveolar ridge
Table 5
Imaging checklist for orbits, skull base, brain, and vascular manifestations
| Sr. No. | Site of involvement | CT findings | MRI findings |
|---|---|---|---|
| 7. | Orbits | Proptosis Pre-septal thickening and enhancement over the globe Thickening of the sclera/enhancement of posterior coats of the eyeball Soft tissue seen in the region of nasolacrimal duct/lacrimal sac Spread of disease along superior/inferior orbital fissures Involvement of orbital apex Optic nerve involvement Retro-orbital fat stranding Oedema, thickening of the extra-ocular muscles Walls of the orbits/lamina papyracea are dehiscent Sub-periosteal collection | Proptosis Pre-septal thickening and enhancement over the globe Distortion of globe which is shaped like a ‘guitar pick’ [10] Thickening of the sclera/enhancement of posterior coats of the eyeball Soft tissue in the region of nasolacrimal duct/lacrimal sac Spread of disease along superior/inferior orbital fissures Involvement of orbital apex Optic neuritis Retro-orbital fat stranding Involvement of extra-ocular muscles Sub-periosteal collection |
| 8. | Skull base | Bones of the skull base show irregular destruction Permeative osteolysis/air loculi/cortical erosion seen Prevertebral space is oedematous | Post-contrast hypo-enhancement is seen indicating likely under-perfused tissue Prevertebral soft tissues appear oedematous |
| 9. | Brain | Asymmetric appearance and enhancement of both superior ophthalmic veins/cavernous sinuses Cavernous sinus thrombosis Meningeal thickening/enhancement Cerebral parenchymal abnormality/abnormal enhancement | Asymmetric appearance and enhancement of both superior ophthalmic veins/cavernous sinuses Cavernous sinus thrombosis Meningeal thickening/enhancement Cerebral parenchymal abnormality/abnormal enhancement Intracerebral diffusion restriction suggesting acute infarct Cranial nerve involvement; trigeminal nerve involvement is commonly seen |
| 10. | Vascular manifestations: internal carotid artery and its intracranial branches are commonly affected | Mycotic pseudoaneurysms Partial thrombosis, narrowing and arteritis of intracranial arteries Pseudoaneurysm, arterial dissection, or venous congestion leading to intracranial haemorrhages | Mycotic pseudoaneurysms, arterial dissection Partial thrombosis, narrowing and arteritis of intracranial arteries Smooth, concentric thickening and enhancement of the wall of the carotid artery on serial MRI differentiates the nature of the arterial involvement by mucormycosis from that occurring in atherosclerosis |
Table 2 outlines the CT and MRI findings to be exa-mined while imaging the nasal cavity, nasal septum, and turbinates for mucormycosis (Figures 1-3).
Figure 1
Early imaging findings in a patient with COVID-19 and rhino-orbital-cerebral (ROC) mucormycosis. Axial (A, C) and coronal (B, D) computed tomography images of the paranasal sinuses in the soft tissue (A, B) and bone window settings (C, D) show irregular mucosal outlines with soft-tissue thickening along the nasal septum (white arrows) and the middle turbinate (red arrows) on the left side
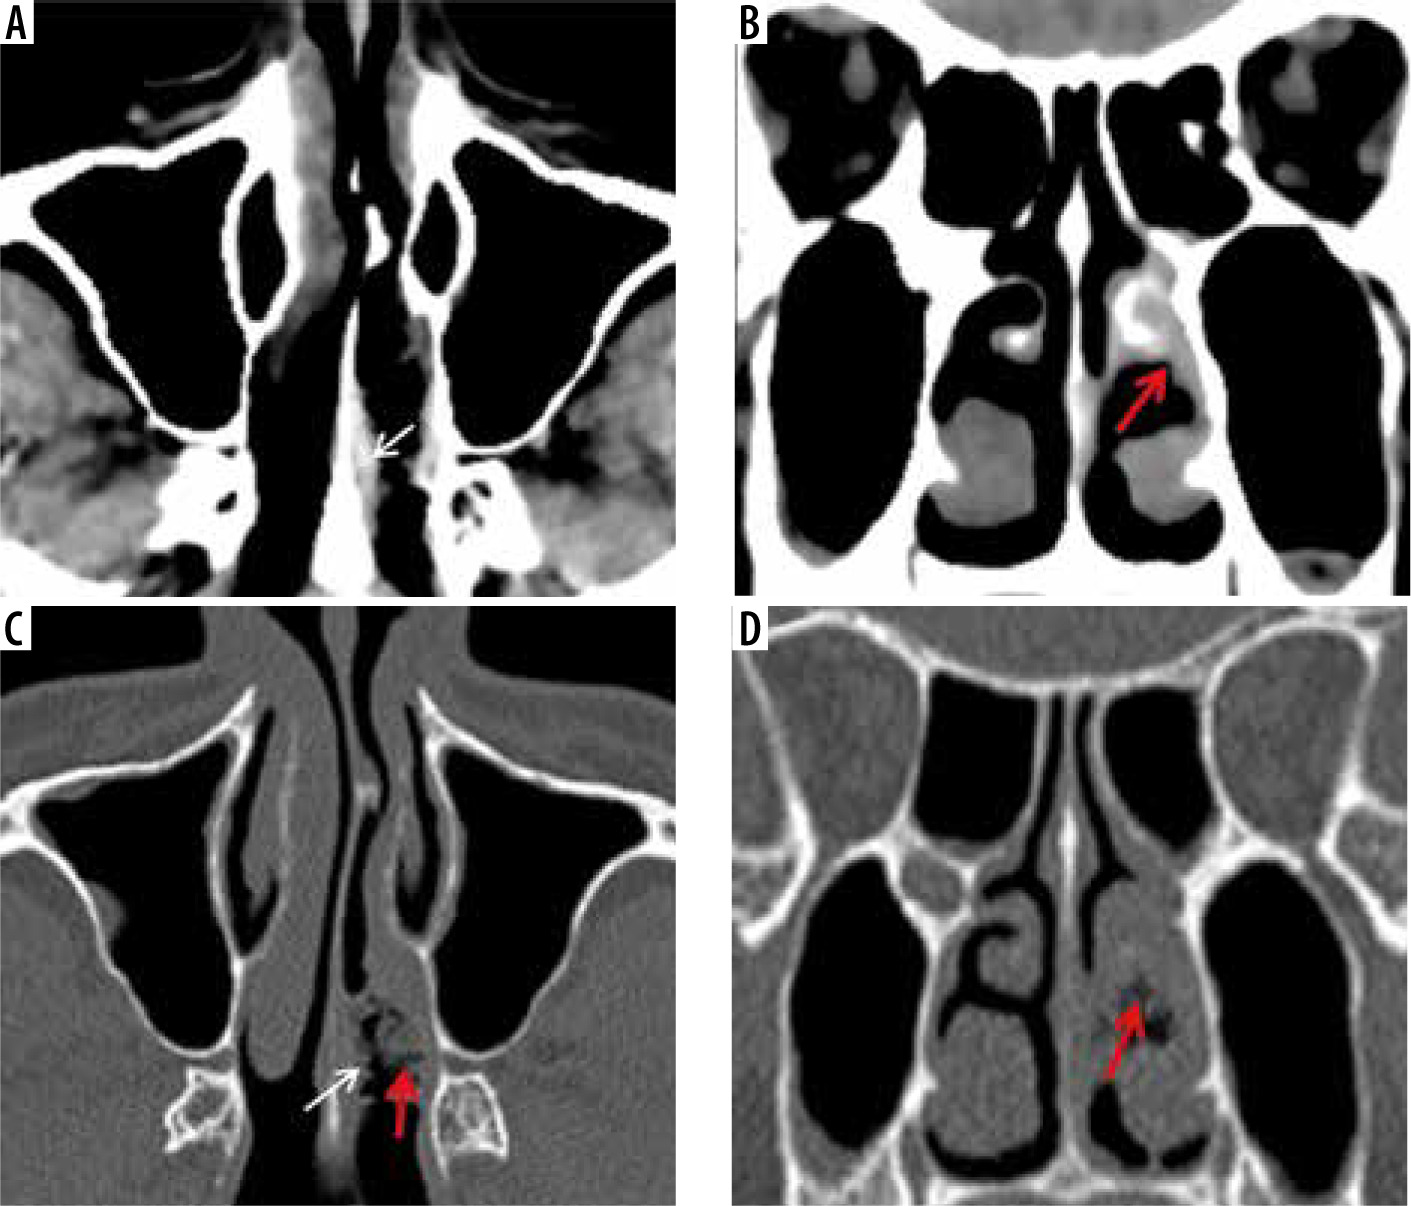
Figure 2
“Black-turbinate sign” on magnetic resonance imaging in a COVID-19-positive patient with rhino-orbital-cerebral (ROC) mucormycosis. A) Axial post-contrast fat-suppressed T1-weighted (T1W) image shows poorly enhancing mucosa along the nasal septum on the right side. B) Coronal short-tau inversion recovery (STIR) image of the nasal cavity shows low signal intensity of the affected left middle turbinate (red arrow), compared to the normal signal intensity on the right side. Axial (C) and coronal (D) post-contrast fat-suppressed T1W images in the same patient show non-enhancing mucosa over the left middle turbinate – “black-turbinate sign” (red arrows). This indicates necrotic eschar
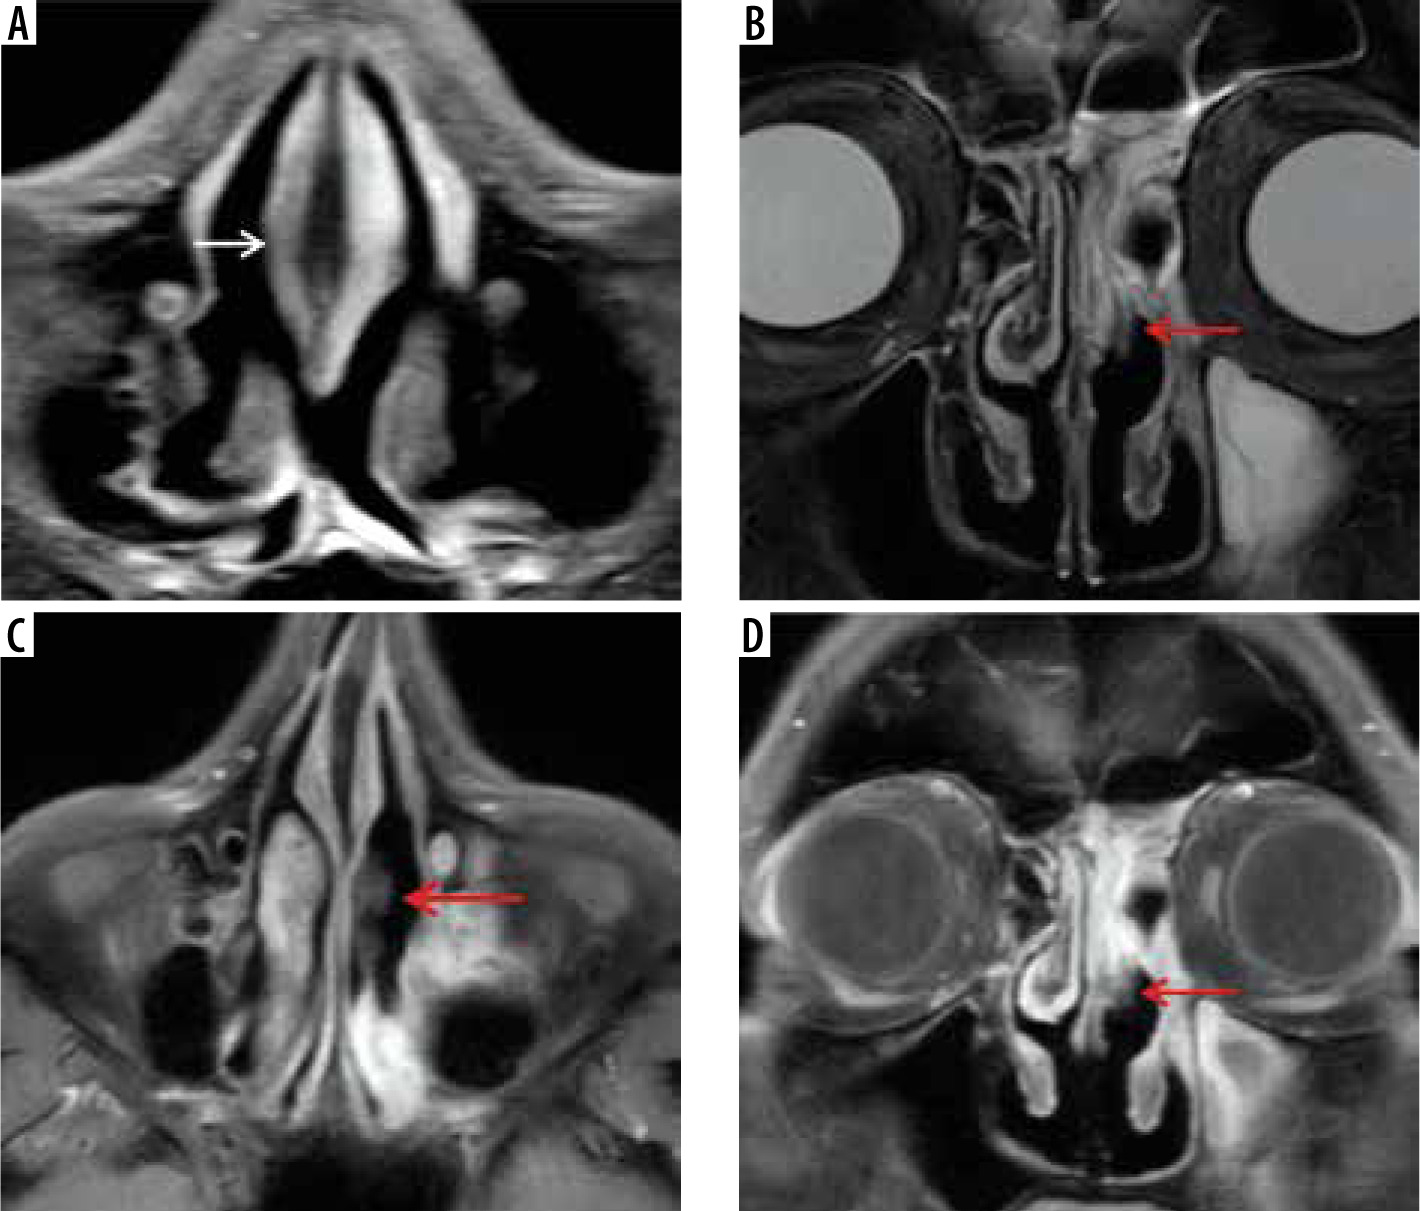
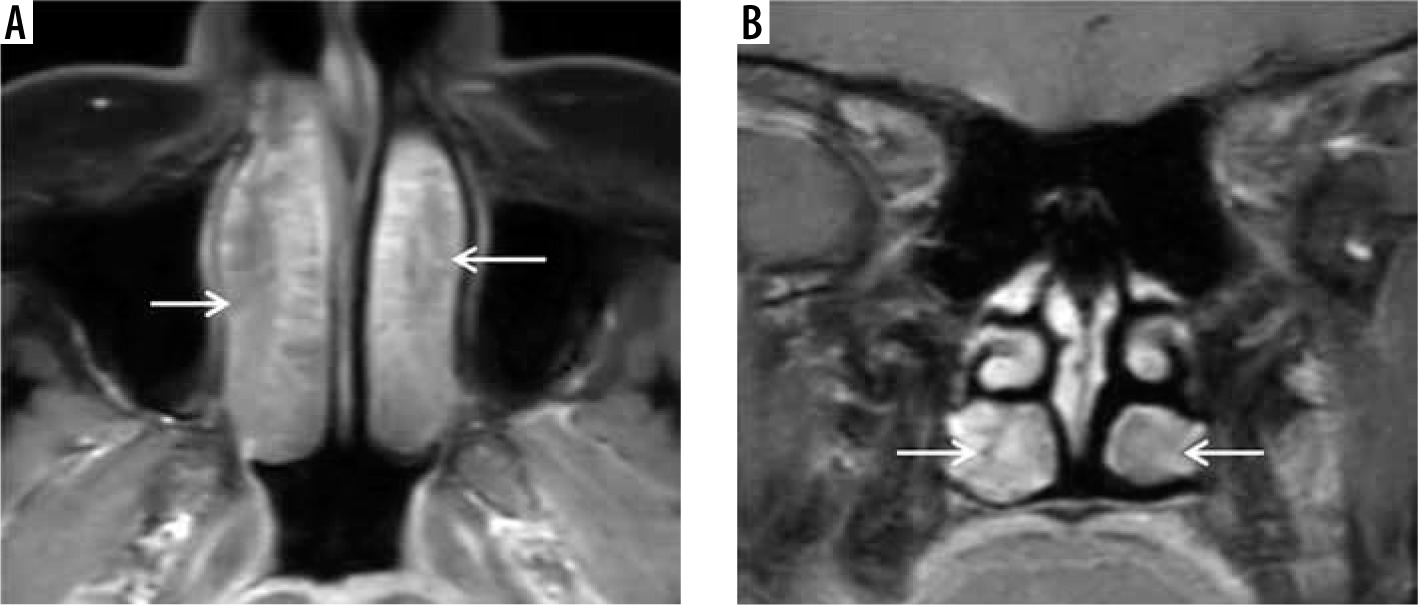
Figure 3
“Black turbinate sign” – a potential diagnostic pitfall magnetic resonance imaging in a normal immunocompetent patient – axial (A) and coronal (B) post-contrast fat-suppressed T1-weighted (T1W) images demonstrate benign non-enhancing inferior turbinates with non-enhancement most pronounced in the posterior aspects of both the inferior turbinates (white arrows). The turbinates show preserved thin peripheral rim enhancement along with thin enhancing internal septa. This potential diagnostic pitfall is to be considered while reporting the characteristic “black turbinate sign” seen in suspected acute invasive fungal rhinosinusitis (AIFRS)
Previous case studies have described unilateral involvement of the nasal cavity as one of the features favouring diagnosis of AIFRS [10,11]. However, Middlebrooks et al. in their model proposed for the diagnosis of AIFRS [12] have stated that unilateral nasal cavity affection has low specificity and cannot be considered as an individual predictor of AIFRS.
Lack of focal contrast enhancement of the sinonasal mucosa on post-contrast MR images along with restricted diffusion is highly suggestive of angio-invasion by the fungal hyphae. This results in tissue necrosis, eschar formation, and the characteristic “black turbinate sign” seen on MRI (Figure 2). This is considered to be an early sign of angio-invasive sino-nasal mucormycosis [13]. However, Han et al. demonstrated that a benign non-enhancing (NE) turbinate in an immunocompetent host needs to be differentiated from the “black turbinate” seen in AIFRS [14]. Figure 3 illu-strates benign NE inferior turbinate that is showing preserved peripheral enhancement along with thin enhancing internal septa. The benign turbinate enhancement increases with time on subsequent series of postcontrast images [14].
Table 3 presents the imaging features observed in mucormycosis involving the paranasal sinuses (Figures 4 and 5) and peri-sinus soft tissues (Figures 6-8). The imaging findings to be investigated while assessing suspected mucormycosis of the nasopharyngeal soft tissues, hard palate (Figure 9), and maxillary and mandibular alveolar ridge are listed in Table 4.
Figure 4
Right maxillary sinus mucormycosis and spread to peri-sinus tissues in a patient with COVID-19. Axial computed tomography (CT) images of the paranasal sinuses (PNS) in soft tissue window (A, B) show mild soft-tissue mucosal thickening along the walls of the right maxillary sinus (red arrows). Axial CT images in the bone window (C, D) demonstrate thinning, erosion, and dehiscence of the anterior and lateral walls of the right maxillary sinus (thick white arrows). Mild soft tissue thickening with loss of normal fat planes seen along the anterior and posterior walls of the right maxillary sinus (thin white arrows), indicating peri-sinus extension of infection through the bony dehiscence
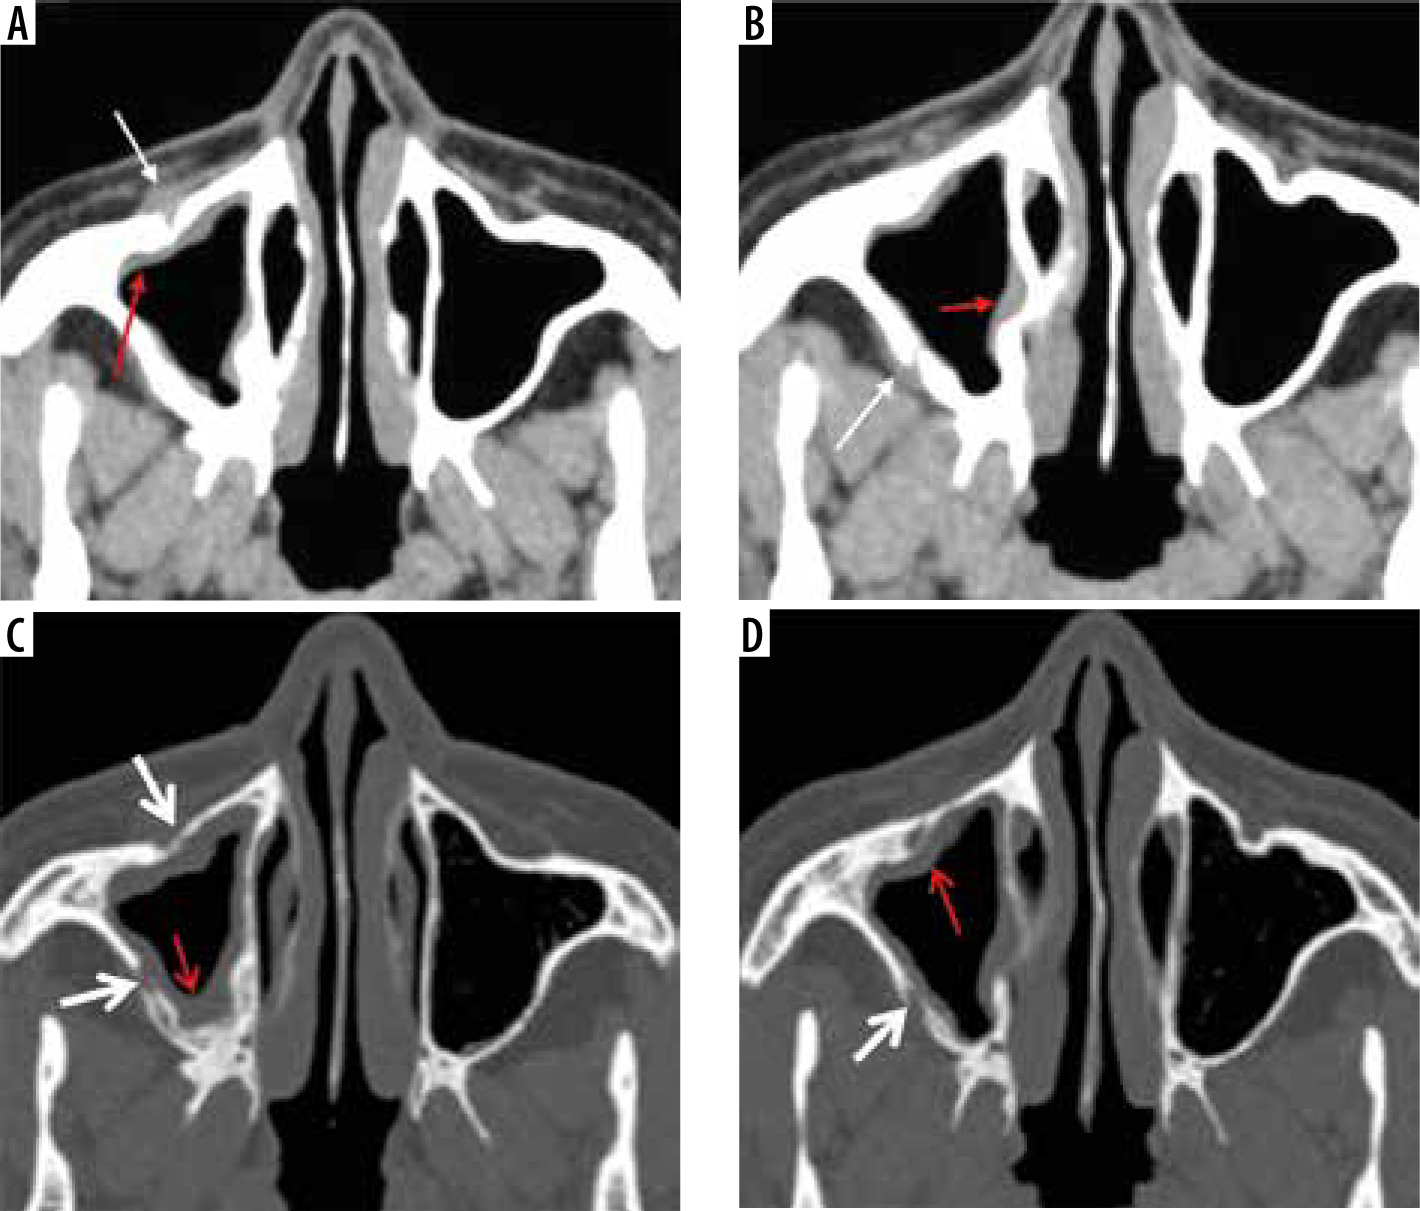
Figure 5
Magnetic resonance imaging (MRI) of maxillary sinus mucormycosis and peri-sinus spread of infection. Axial (A) and coronal (B) post-contrast fat-suppressed (FS) T1-weighted (T1W) MRI images in a COVID-19-positive patient, demonstrate soft tissue mucosal thickening along the walls of both the maxillary sinuses with focal areas of non-enhancement and focal areas of break in the enhancing mucosal lining (white arrows). Post-contrast FS T1W coronal image (C) in another patient shows focal discontinuity in the enhancing mucosal lining of the right maxillary sinus (thick white arrow) with spread of disease to the peri-sinus tissues. As a result, swelling and hyperintense signal abnormality of the right temporalis and masseter muscles (yellow arrows) is seen with loss of intervening fat planes
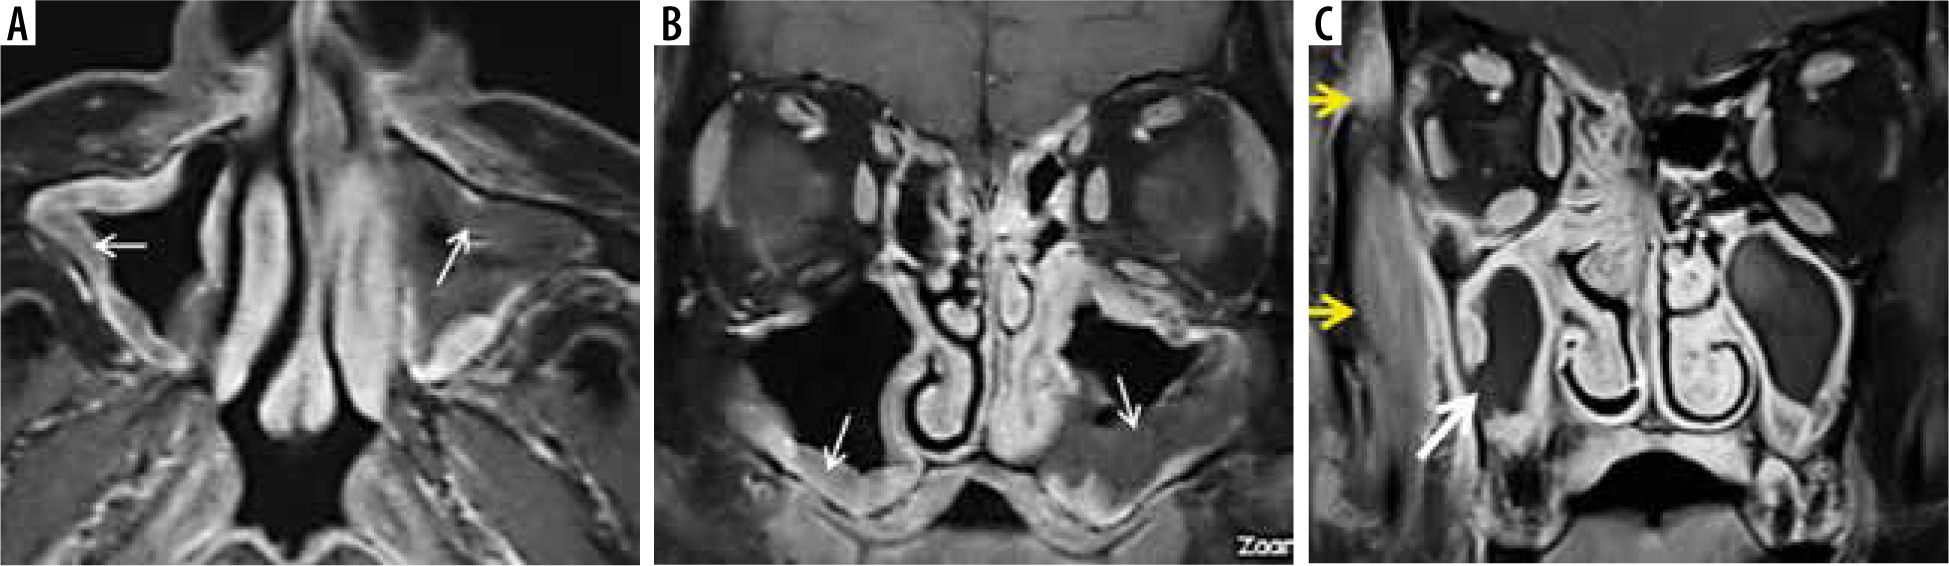
Figure 6
In a patient with COVID-19-related paranasal sinus mucormycosis, the coronal computed tomography image in bone window (A) shows thinning, erosion, and dehiscence of the roof, floor, and medial bony wall of the left maxillary sinus (white arrows). Soft tissue window images (B, C) reveal mucosal thickening of the maxillary and ethmoid sinuses on the left side. The fungal disease is infiltrating the left infra-orbital nerve canal and is extending into the left orbit to involve the left inferior rectus muscle that appears thickened (yellow arrows). Note the normal infra-orbital nerve canal on the right side (red arrow)
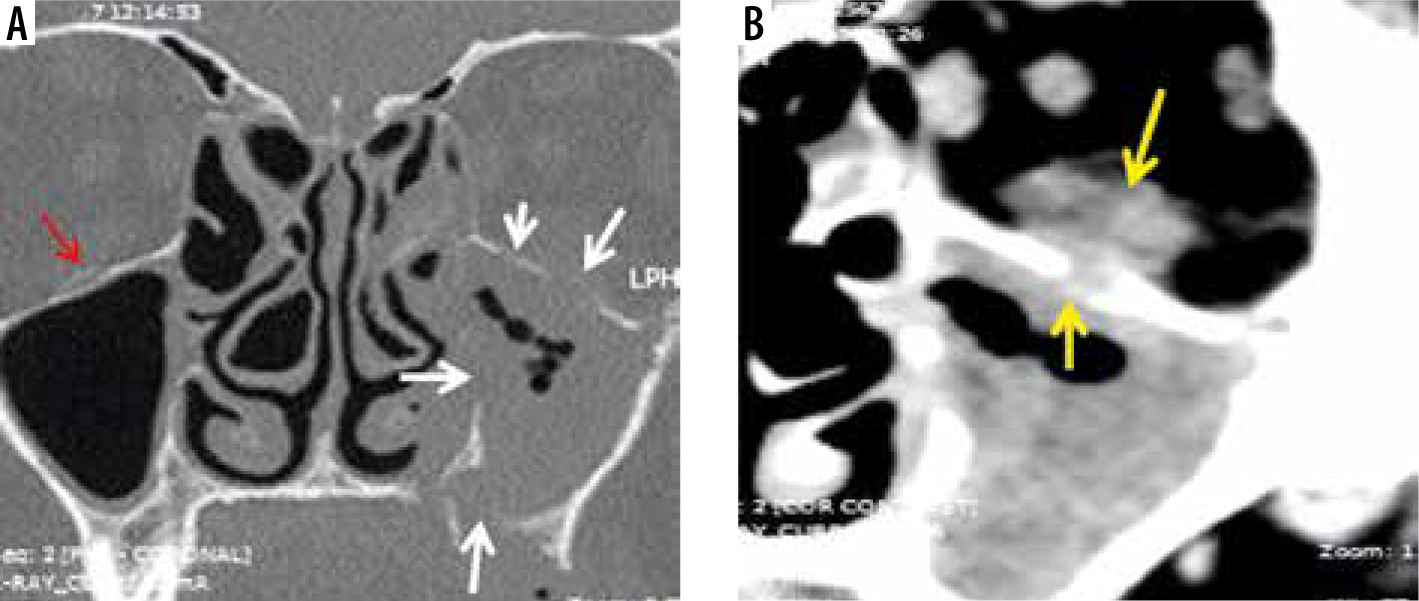
Figure 7
Axial soft-tissue window computed tomography images of the paranasal sinuses (PNS) (A, B) in a COVID-19-positive patient. Severe soft tissue mucosal thickening resulting in complete opacification of the right maxillary sinus (white star) with soft tissue infiltration and fat stranding involving the premaxillary and retro-maxillary spaces on the right side (white arrows). This peri-sinus extension of the fungal disease has occurred through an intact intervening bone. Note the normal premaxillary and retro-maxillary fat planes on the left side

Figure 8
Computed tomography (CT) and magnetic resonance imaging (MRI) of the paranasal sinuses in a patient with COVID-19-related mucormycosis. Axial CT images in soft tissue (A) and bone window (B) show complete opacification of the right maxillary sinus by soft tissue thickening with dehiscent medial and postero-medial walls of the sinus. Extension of the disease process seen into the right pterygopalatine fossa (yellow arrows). Post-contrast fat-suppressed T1-weighted (T1W) axial MR images (C, D) demonstrate hypointense, non-enhancing right maxillary sinus along with oedematous changes and abnormal enhancement along the right pterygopalatine fossa
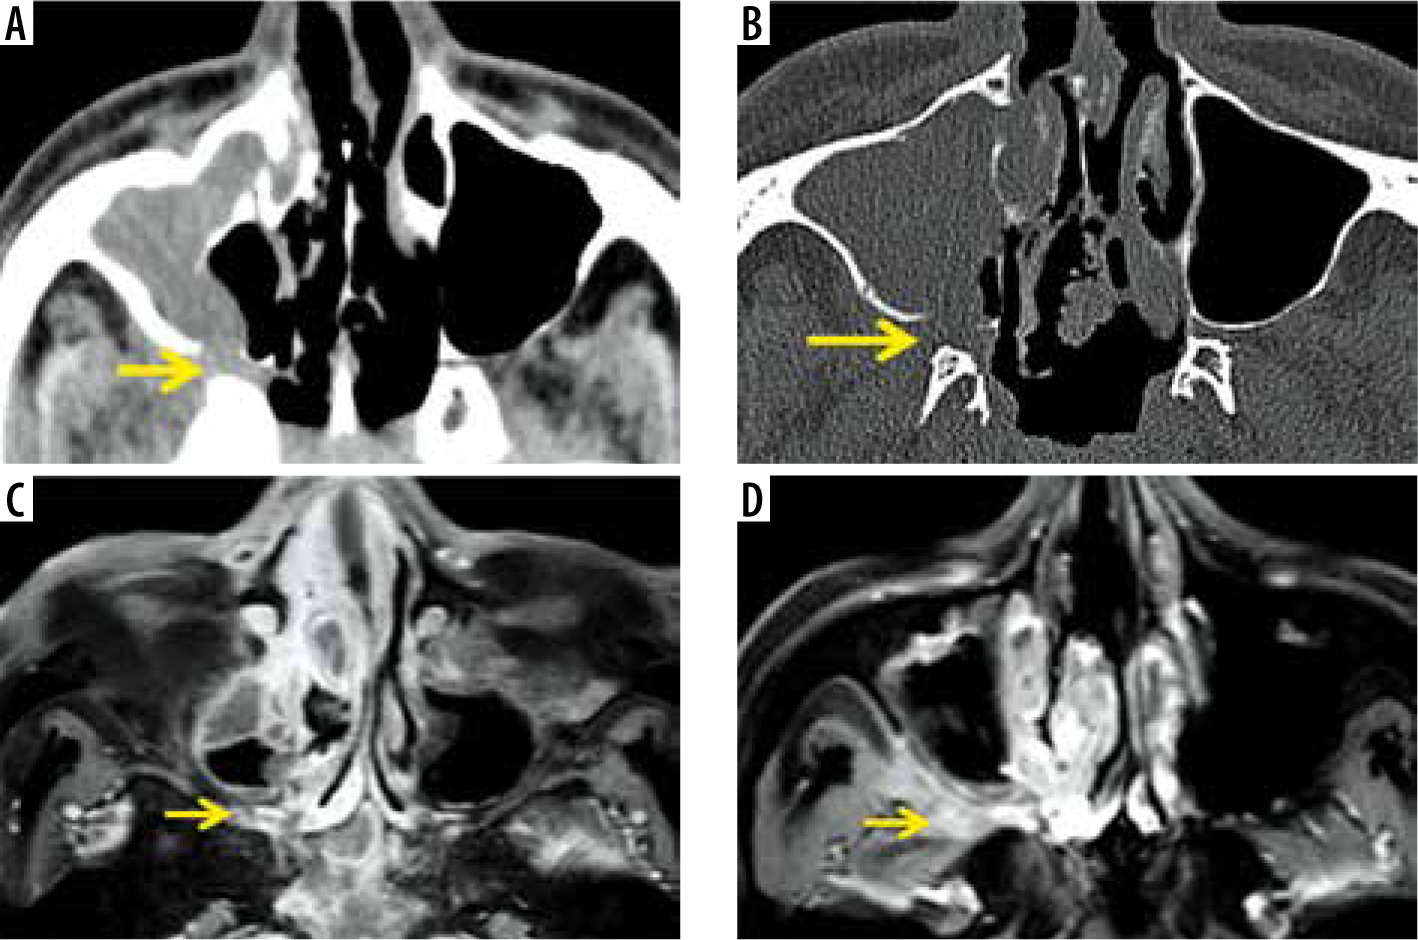
Figure 9
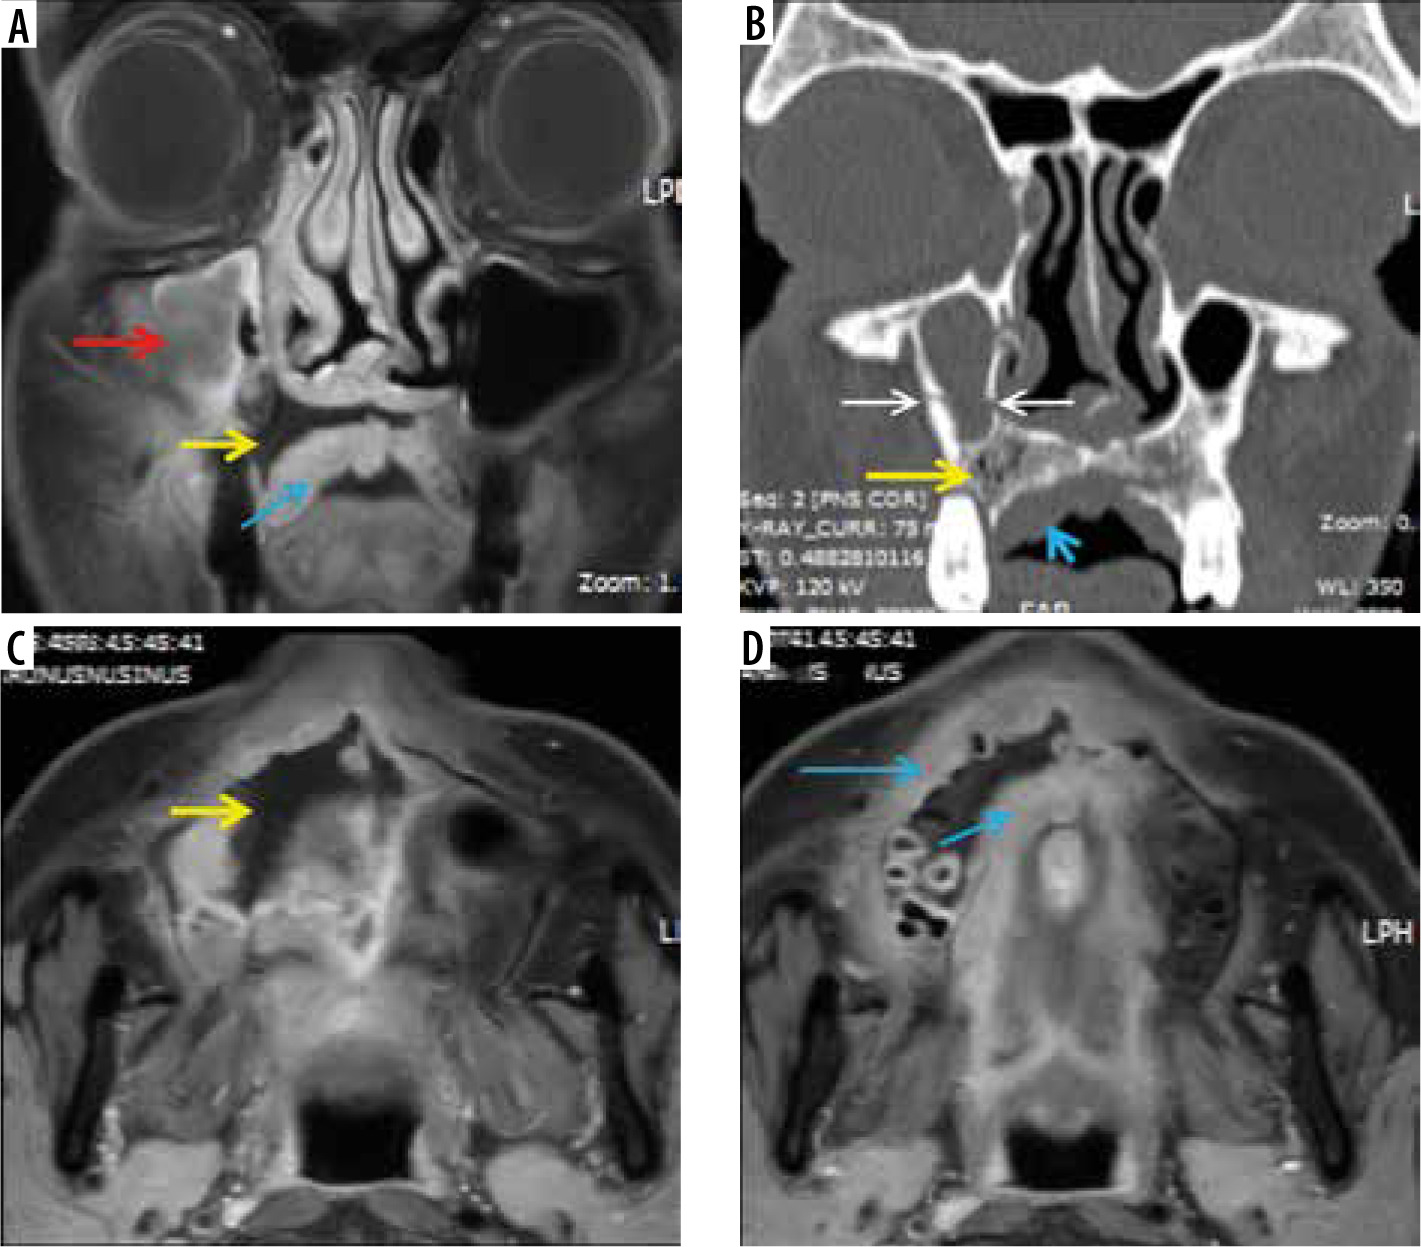
Permeative osteolysis of the hard palate and alveolar process of maxilla in a patient with COVD-19-related mucormycosis. Coronal post-contrast fat-suppressed T1-weighted (T1W) image (A) shows right maxillary sinus soft-tissue mucosal thickening. Areas of focal discontinuity seen along the enhancing mucosal lining of the sinus (red arrow). Coronal computed tomography (CT) (bone window) (B) shows dehiscence of the medial and lateral walls and erosion along the floor of the sinus (white arrows). Coronal CT as well as coronal (A) and axial (C, D) post-contrast, fat-suppressed T1W MRI images demonstrate peri-sinus extension of fungal disease, resulting in permeative osteolysis of the alveolar process of maxilla and hard palate on the right side (yellow arrows). They also demonstrate enhancing, inflammatory soft tissue thickening along the undersurface of the hard palate on the right side (blue arrows)
The signal hypo-intensity of the sinus mucosa seen on the unenhanced T2-weighted/STIR MR images is attributed to deposition of manganese and iron concentrated by fungal organisms [11]. Air-locules appear as signal voids on MR images. Sinusitis usually presents as enhancement of the peripheral sino-nasal mucosa on T1-weighted post-contrast MR images. Contrary to this, non-enhancing sino-nasal mucosa is seen in sino-nasal mucormycosis (Figure 5), due to necrosis and devitalization of the affected tissue by mycotic angio-invasion [13].
Spread of sino-nasal disease
The progression of mucormycosis from the nose and para-nasal sinuses occurs either directly or through vascular channels. Extension of the disease process from ethmoid sinus or maxillary sinus into the orbital space can occur directly through the dehiscent lamina papyracea or the dehiscent orbital floor, respectively (Figure 4).
However, the intervening bony walls may remain intact as the angio-invasive fungal disease extends into the peri-sinus soft-tissues, through perivascular channels [10-12]. Posterior peri-antral/retro-antral fat may be involved due to extension of the disease process from the maxillary sinuses along vascular channels (Figure 7) [12]. Obliteration of peri-antral fat (Figures 4 and 7) is an important early indicator of peri-sinus extension of the disease process [10,11,15].
Mucormycosis of the ethmoid sinuses may involve all structures along its invasive path, including the orbit, eye, bone, and brain tissue. As the venous drainage of the ethmoid sinuses extends into the cavernous sinuses, ethmoidal mucormycosis carries a high risk of cavernous sinus thrombosis [16]. The fungal disease can also extend from the nasal cavity along posterior superior nasal nerves or sphenopalatine artery to involve the sphenopalatine foramen and ipsilateral pterygopalatine fossa.
Therefore, the absence of bone destruction cannot be considered as a lone indicator for ruling out AIFRS [12].
Table 5 depicts the imaging manifestations of mucormycosis of the orbits (Figures 10-13), skull base (Figure 14), brain, and vascular channels (Figures 15-19).
Figure 10
In a patient with COVID-related mucormycosis, bilateral ethmoid sinus soft-tissue mucosal thickening seen on the axial short-tau inversion recovery (STIR) (B) and axial unenhanced, fat-suppressed T1-weighted (T1W) (D) images (blue asterisk). Intra-orbital extension of the disease into the extra-conal and intra-conal compartments seen on the left side (B, D – blue arrows). Proptosis of the left eyeball with pre-septal thickening and fat stranding is evident (A, B, D – white arrows). Retro-orbital fat stranding with involvement of medial and lateral rectus (extra-ocular) muscles seen on the left (B, D – yellow arrows). Oedema and fat stranding noted in the left pre-maxillary space (C – thick white arrow). Disease extension seen into the left pterygomaxillary fissure (C – red arrow)
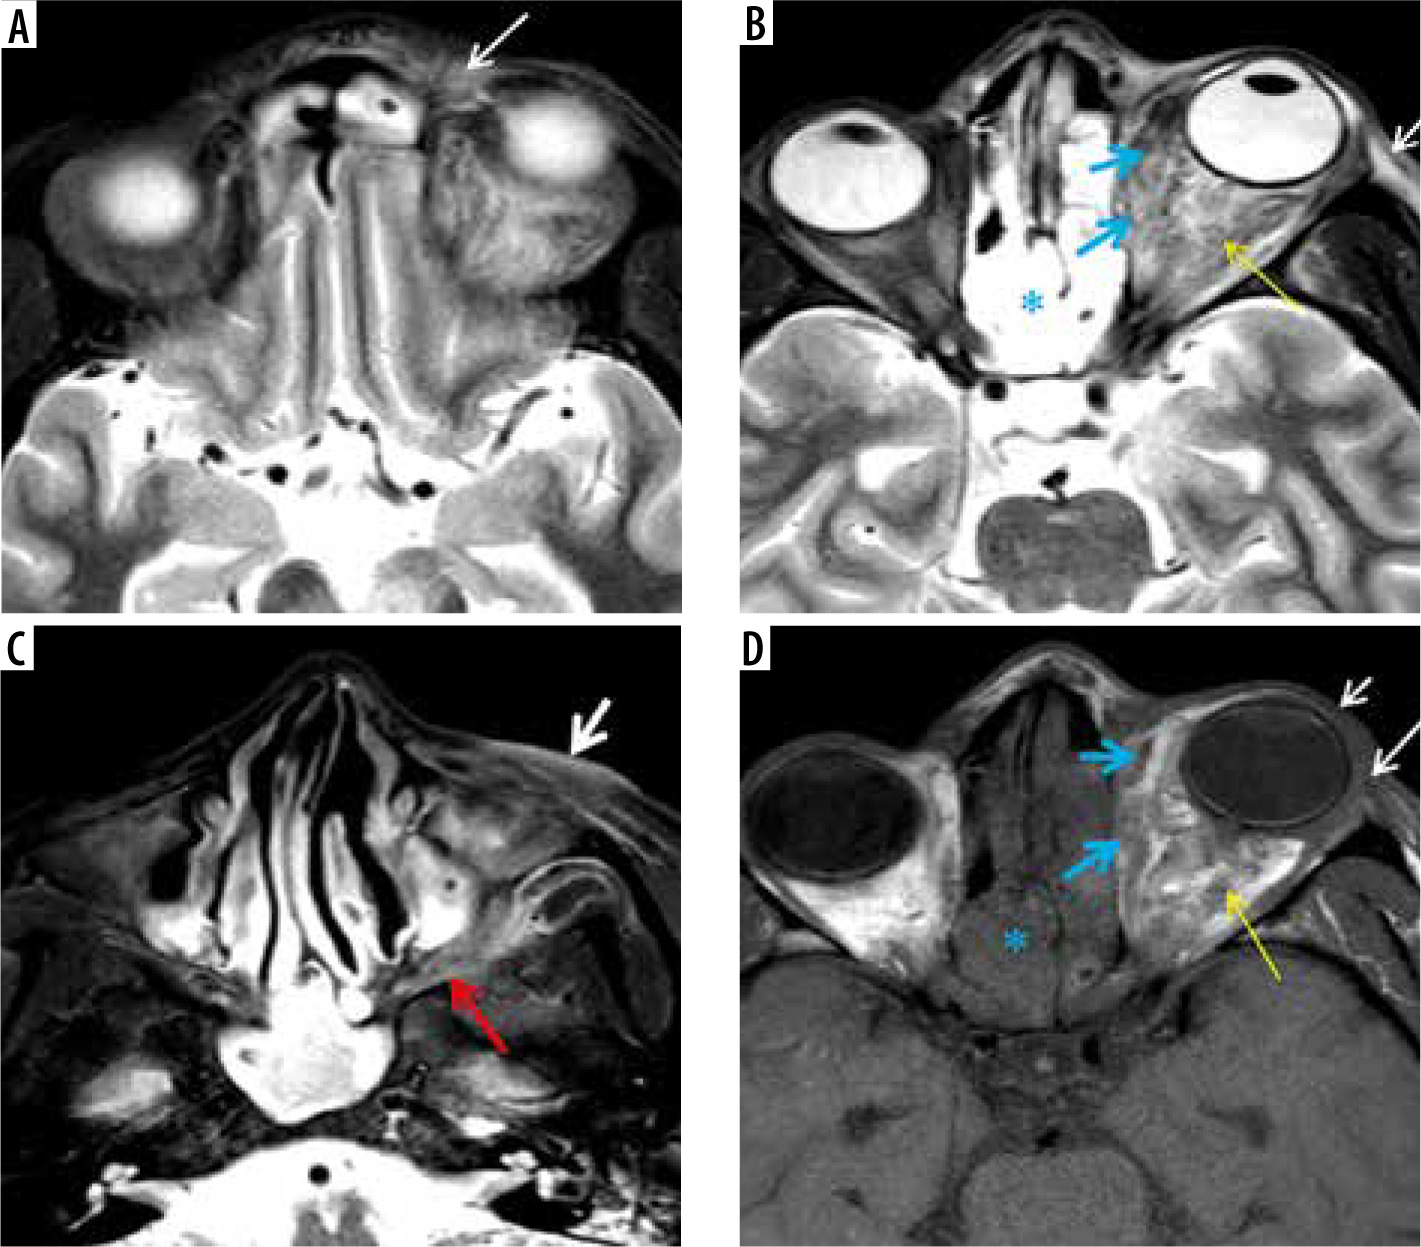
Figure 11
Lacrimal sac and nasolacrimal duct involvement in a COVID-19-positive patient with right maxillary sinus mucormycosis. Coronal computed tomography (CT) image (A) shows soft tissue thickening resulting in opacification of the right lacrimal sac (thin white arrow); note the fully aerated left lacrimal sac (blue arrow). This soft tissue thickening is seen extending into the nasolacrimal canal and is involving the nasolacrimal duct on the right side (red arrows) on the coronal (B) and axial (C) CT images. Soft tissue thickening and infiltration seen in the right premaxillary subcutaneous region (D – thick white arrow). Severe mucosal thickening causing opacification of the right maxillary sinus (asterisk) is noted (C, D)

Figure 12
Orbital apex syndrome in a patient with COVID-19-related mucormycosis. Post-contrast fat-suppressed T1-weighted (T1W) axial (A, B) and coronal (C, D) magnetic resonance (MR) images show enhancing mucosal thickening of both the ethmoid sinuses, more on the left side. Soft tissue thickening with post-contrast enhancement is seen at the left orbital apex (A – white arrows) and the left superior orbital fissure (B, C – yellow arrows). Thickening and enhancement is seen along the posterior intra-orbital (B) and intracanalicular portions of left optic nerve (white arrows). These imaging features depict orbital apex syndrome related to posterior ethmoid and onodi cell sinusitis (C, D – thick white arrow)
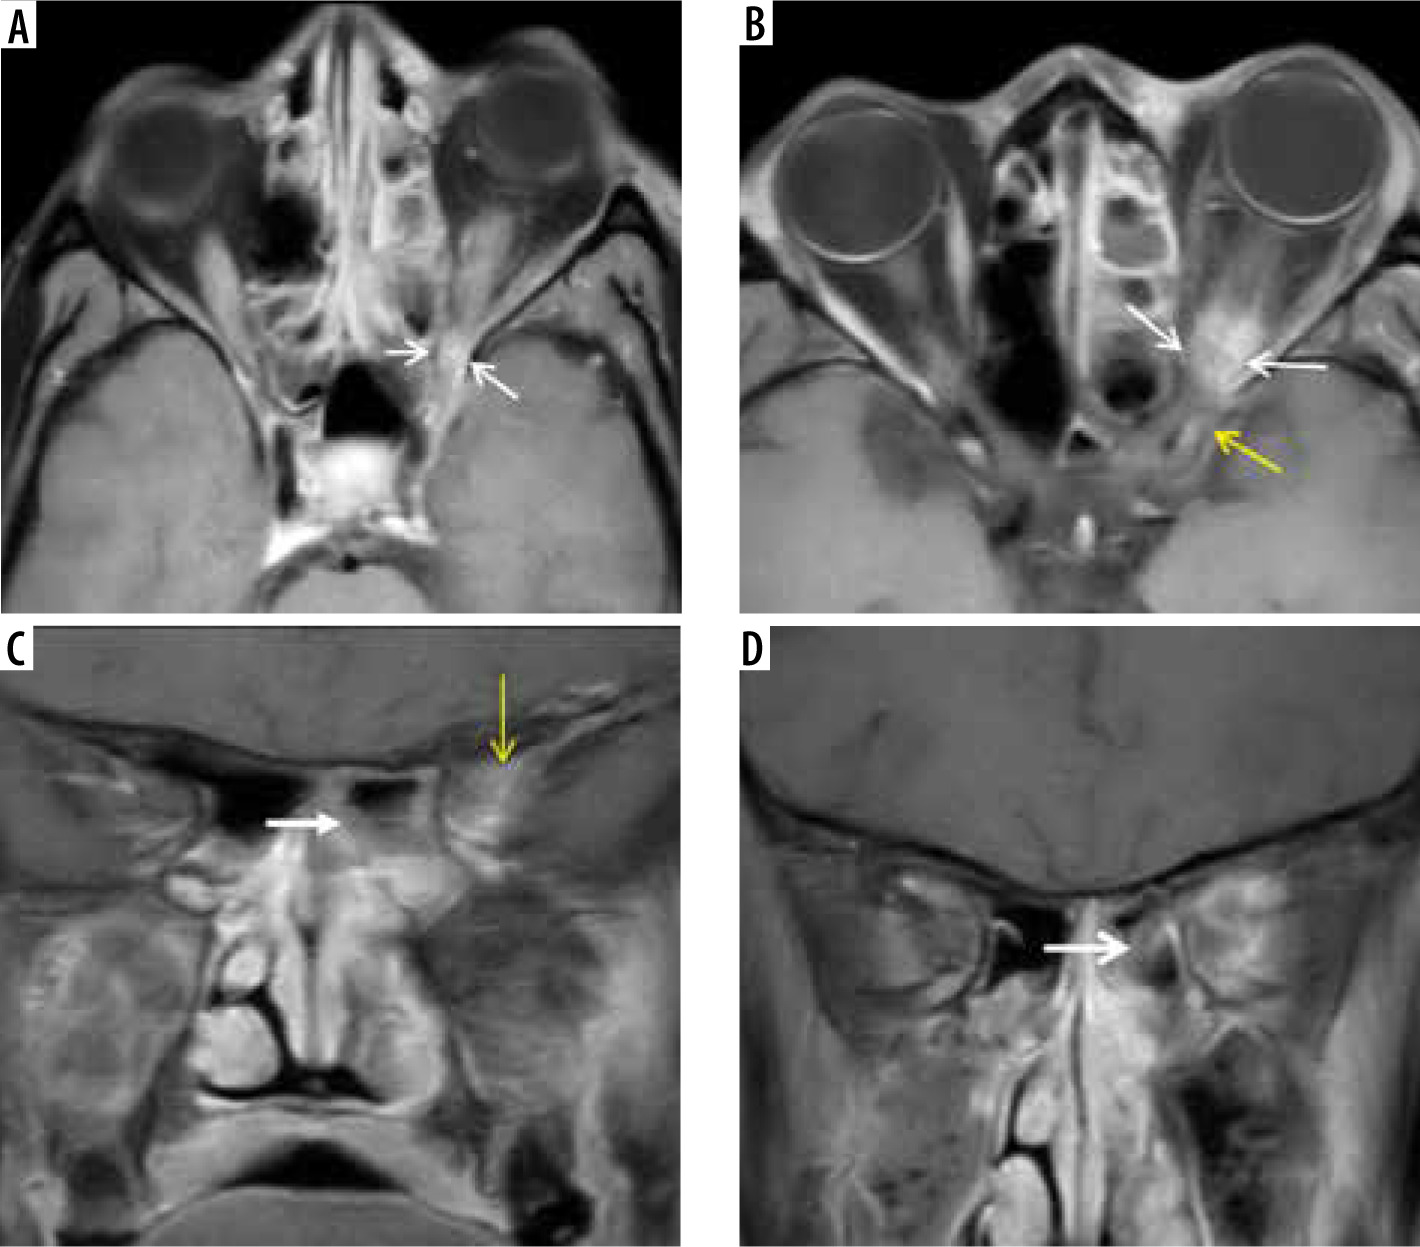
Figure 13
Magnetic resonance imaging of the orbits in a patient with COVID-19 related mucormycosis. Axial (A) and coronal (B) FLAIR images show mild focal swelling with hyperintense signal abnormality of intra-orbital segment of the right optic nerve (white arrows), suggesting right optic neuritis. Pre-septal thickening and oedema is also seen on the right side (yellow arrow). Soft-tissue mucosal thickening is seen involving the anterior and posterior ethmoid air-cells, bilaterally (black asterisk)
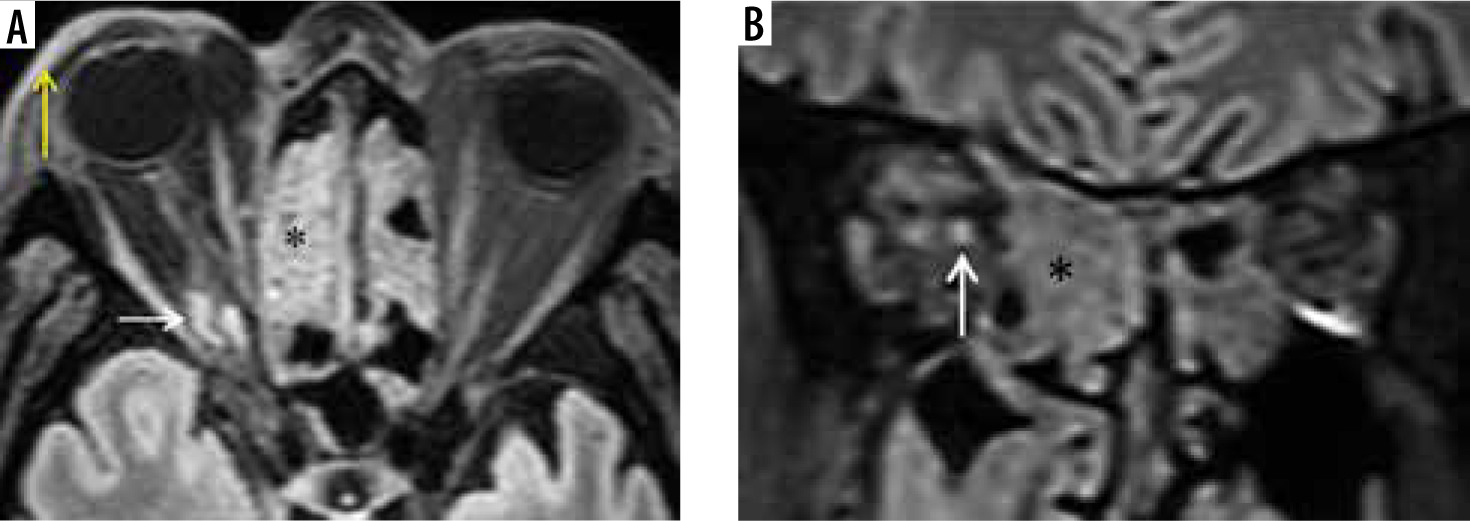
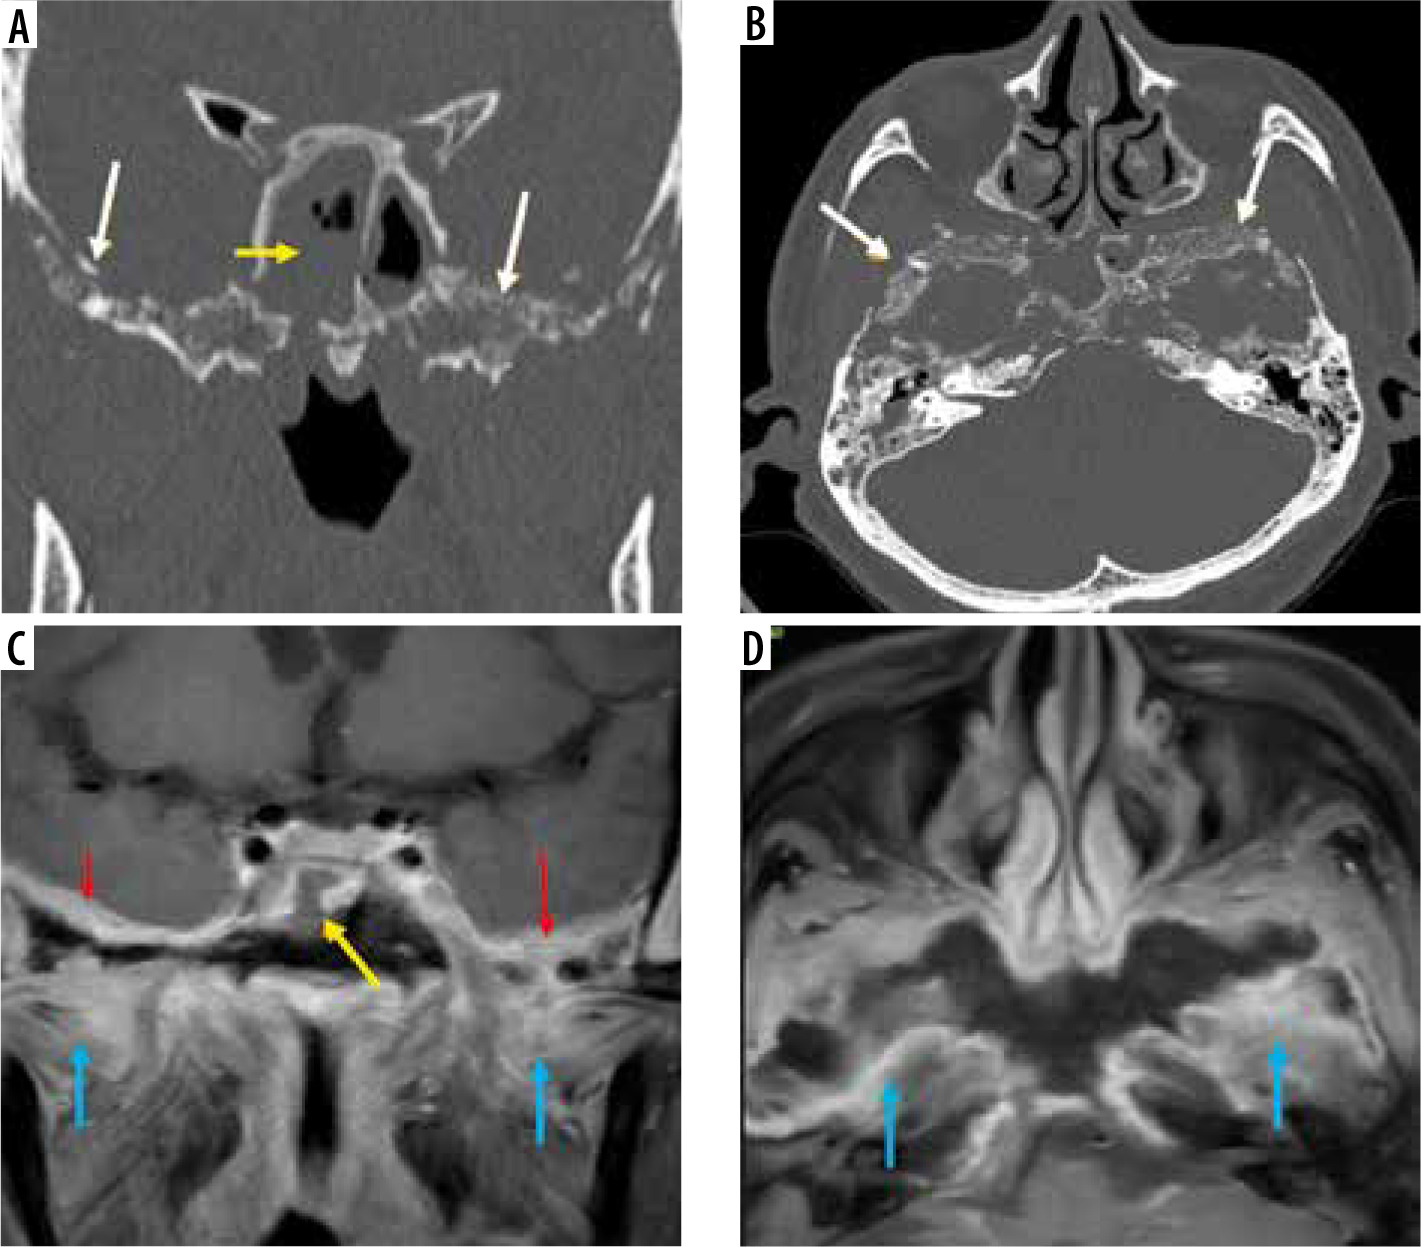
Figure 14
Known case of post-COVID mucormycosis treated with surgical debridement. Secondary osteomyelitis seen involving the central skull base. Coronal computed tomography images (A, B) in bone window demonstrate permeative osteolysis and bone destruction of the basi-sphenoid, sphenoid sinus, greater wing of sphenoid, pterygoid process on the left side (white arrows). Soft tissue mucosal thickening in the sphenoid sinus (B – yellow arrow). Axial (C) and coronal (D) post-contrast fat-suppressed T1-weighted images show marked enhancement involving the structures in the left infra-temporal fossa and masticator space (red arrows). Dural enhancement is seen along the middle cranial fossa (blue arrow)
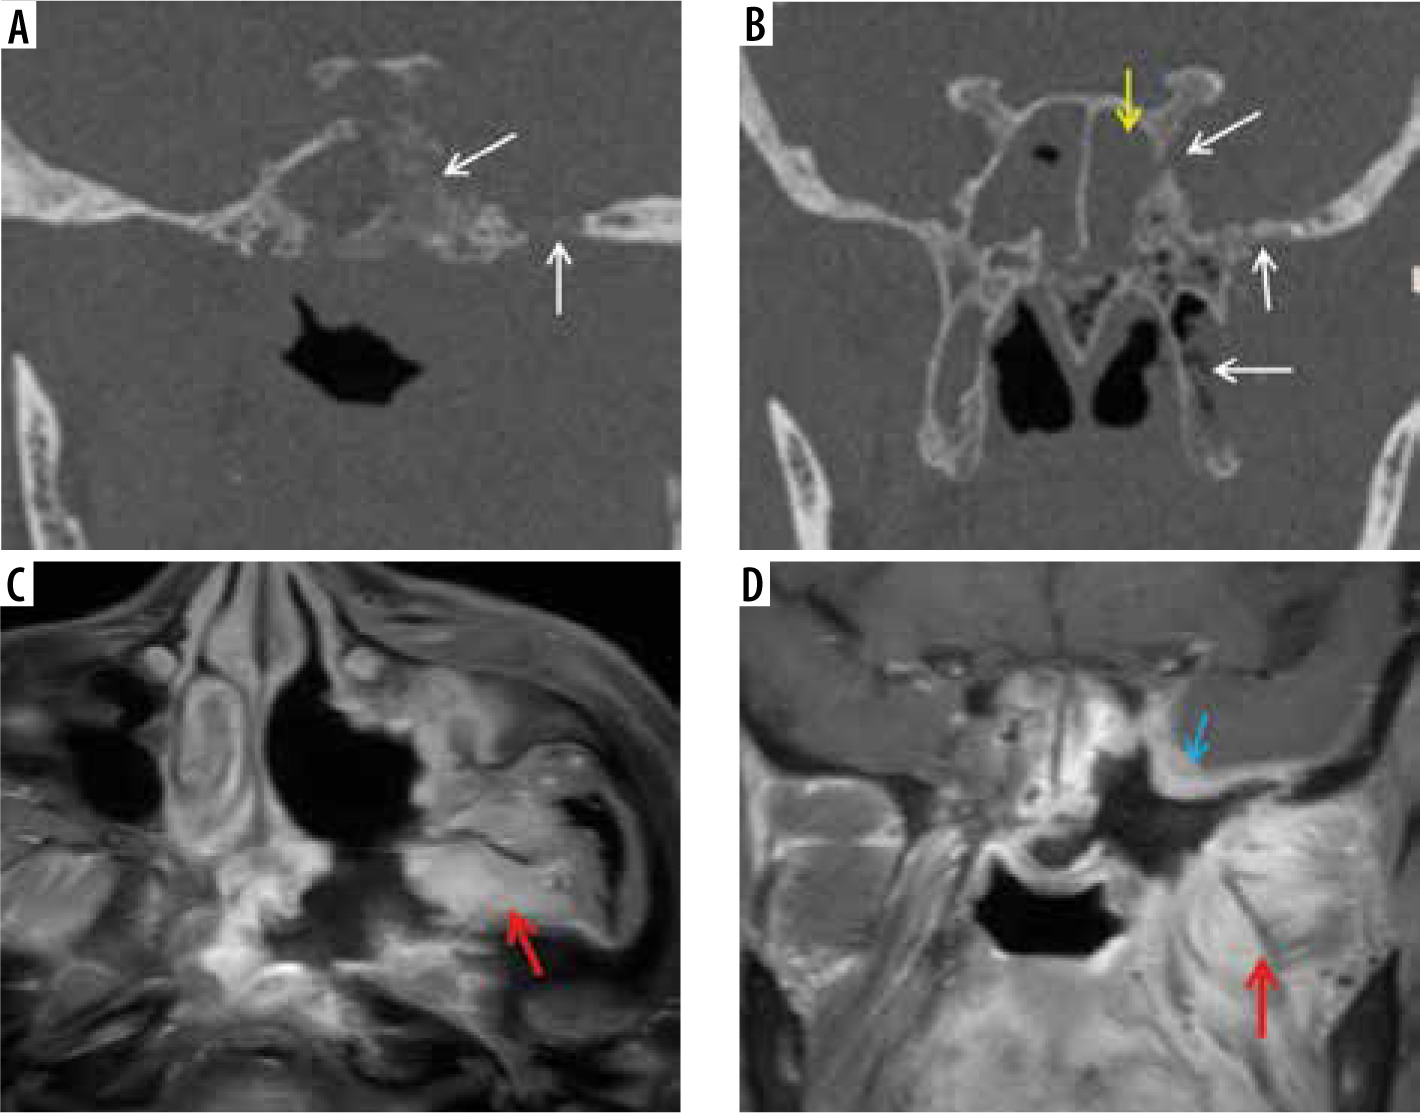
Figure 15
In a COVID-positive patient with sphenoid sinus mucormycosis, short-tau inversion recovery (STIR) coronal magnetic resonance images (A-C) and post-contrast fat-suppressed T1-weighted (T1W) coronal image (D) demonstrate asymmetric soft tissue thickening and enhancement of the left cavernous sinus (yellow arrows) and Meckel’s cave (white arrows), indicating extension of the fungal disease to these sites. Asymmetric thickening and enhancement of the cisternal segment of the left trigeminal nerve (red arrows), suggest peri-neural spread of the disease
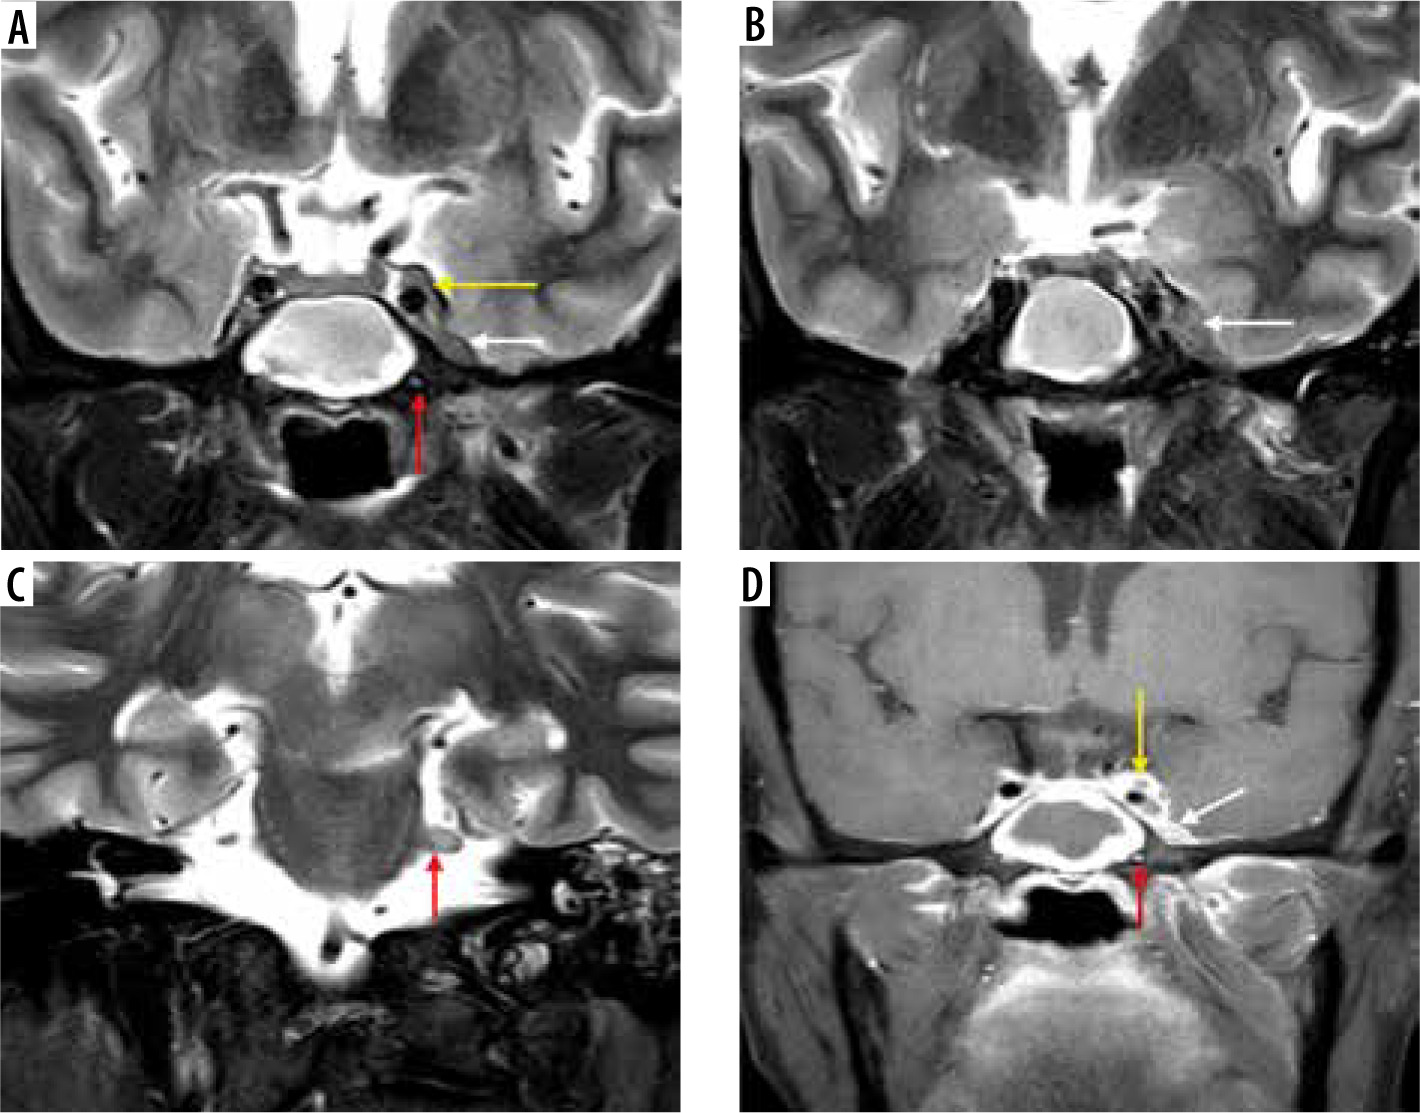
Figure 16
COVID-positive patient with sphenoid sinus disease (asterisk). Post-contrast fat-suppressed (FS) T1-weighted (T1W) axial (A) image demonstrates extension of the fungal infection into left cavernous sinus and Meckel’s cave (white arrows). On the coronal post-contrast FS T1W image (B), the left trigeminal nerve appears thickened and shows post-contrast enhancement in its cisternal portion, close to the root exit zone (black arrows). Cisternal and cavernous segments of the left trigeminal nerve are infiltrated by the disease and show restricted diffusion (black arrows) on the DWI (C) and corresponding ADC images (D). Sphenoid sinus fungal infection also shows restricted diffusion (C, D – black asterisk)

Figure 17
Frontal bone osteomyelitis in a patient with COVID-related right frontal mucormycosis. Axial (A-C) and coronal (D) post-contrast fat-suppressed (FS) T1-weighted (T1W) images demonstrate right frontal sinusitis (yellow arrows). The anterior and lateral aspects of the frontal bone demonstrate signal abnormality (thick white arrow) with an overlying enhancing subperiosteal collection on the right side (thin white arrows). Adjacent pachy-meningeal thickening, enhancement in the right frontal region (red arrows). Intra-orbital, extra-conal extension of the disease process noted along the supero-lateral aspect of the right orbit (blue arrow)
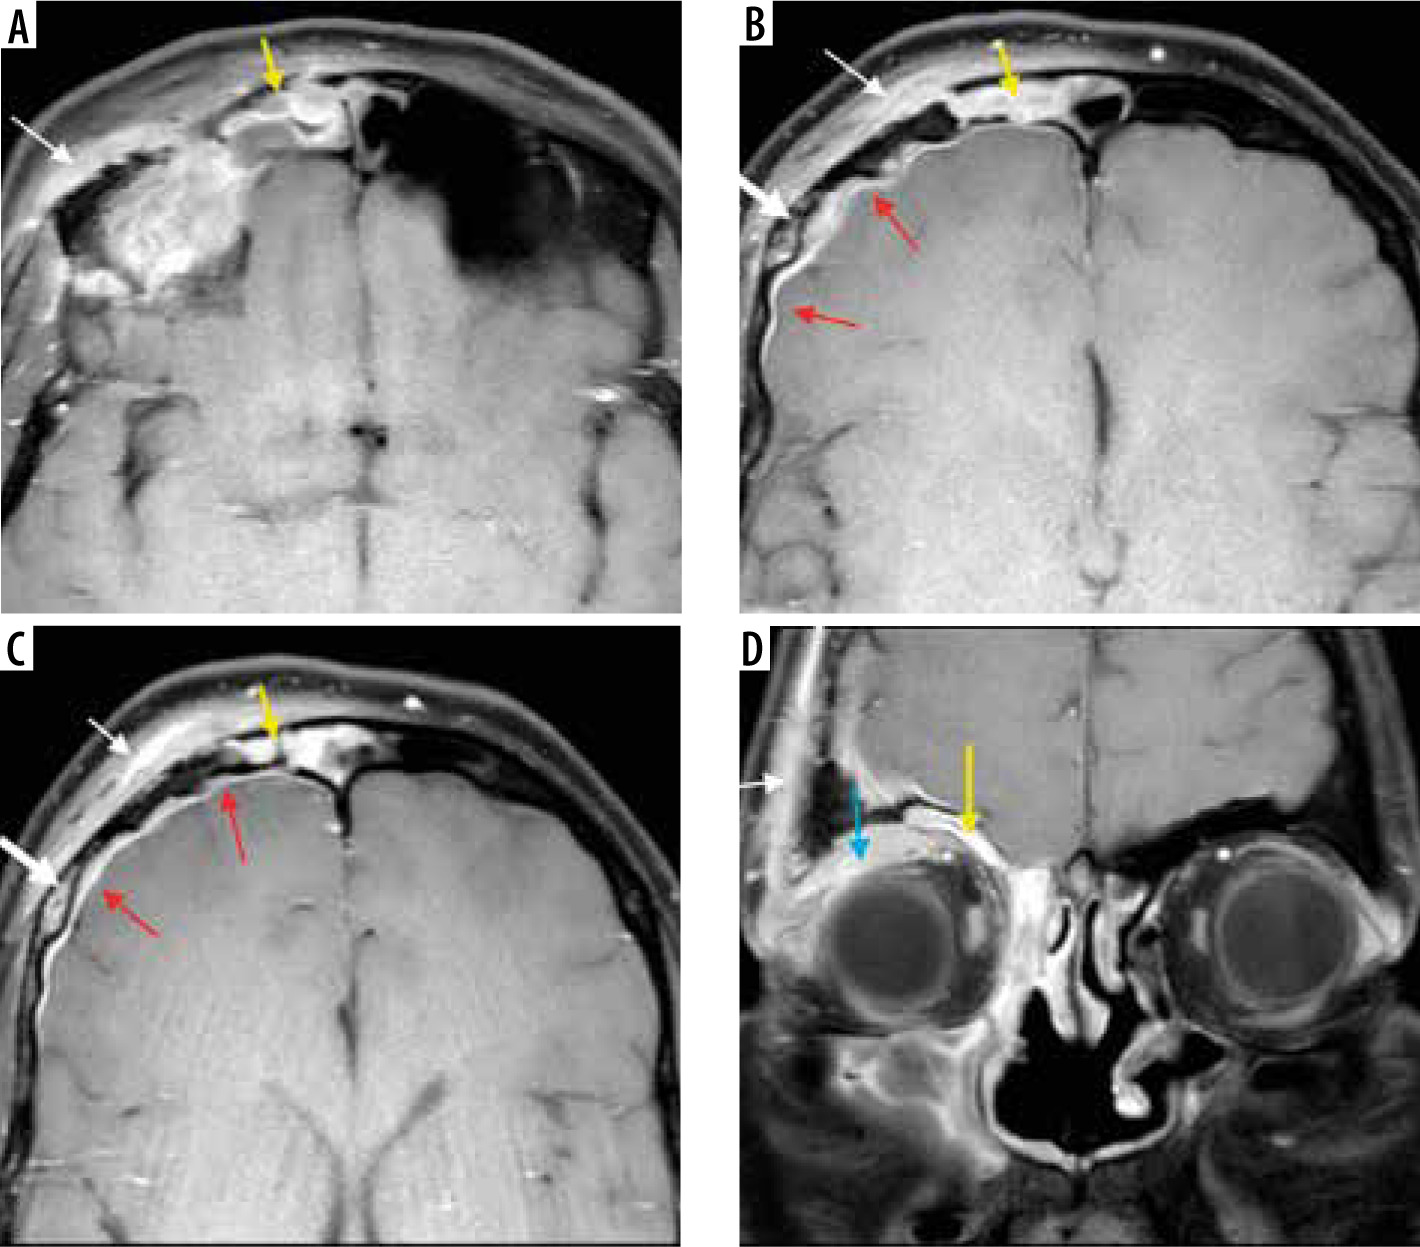
Figure 18
Intracerebral fungal abscesses in a patient with COVID-related mucormycosis. Short-tau inversion recovery (STIR) coronal (A) and post-contrast fat-suppressed (FS) T1-weighted (T1W) axial (B) images show multiple focal fungal abscesses with surrounding perilesional oedema, in the frontal and parietal brain parenchyma, bilaterally. Their walls appear hypointense on STIR (white arrow) and show thin peripheral enhancement (yellow arrow) on the post-contrast images. The walls appear hyperintense on DWI image (C) and dark on corresponding ADC image (D), suggesting restricted diffusion (white arrows). They appear hypointense on SWI (black arrow) due to susceptibility artifacts (E)
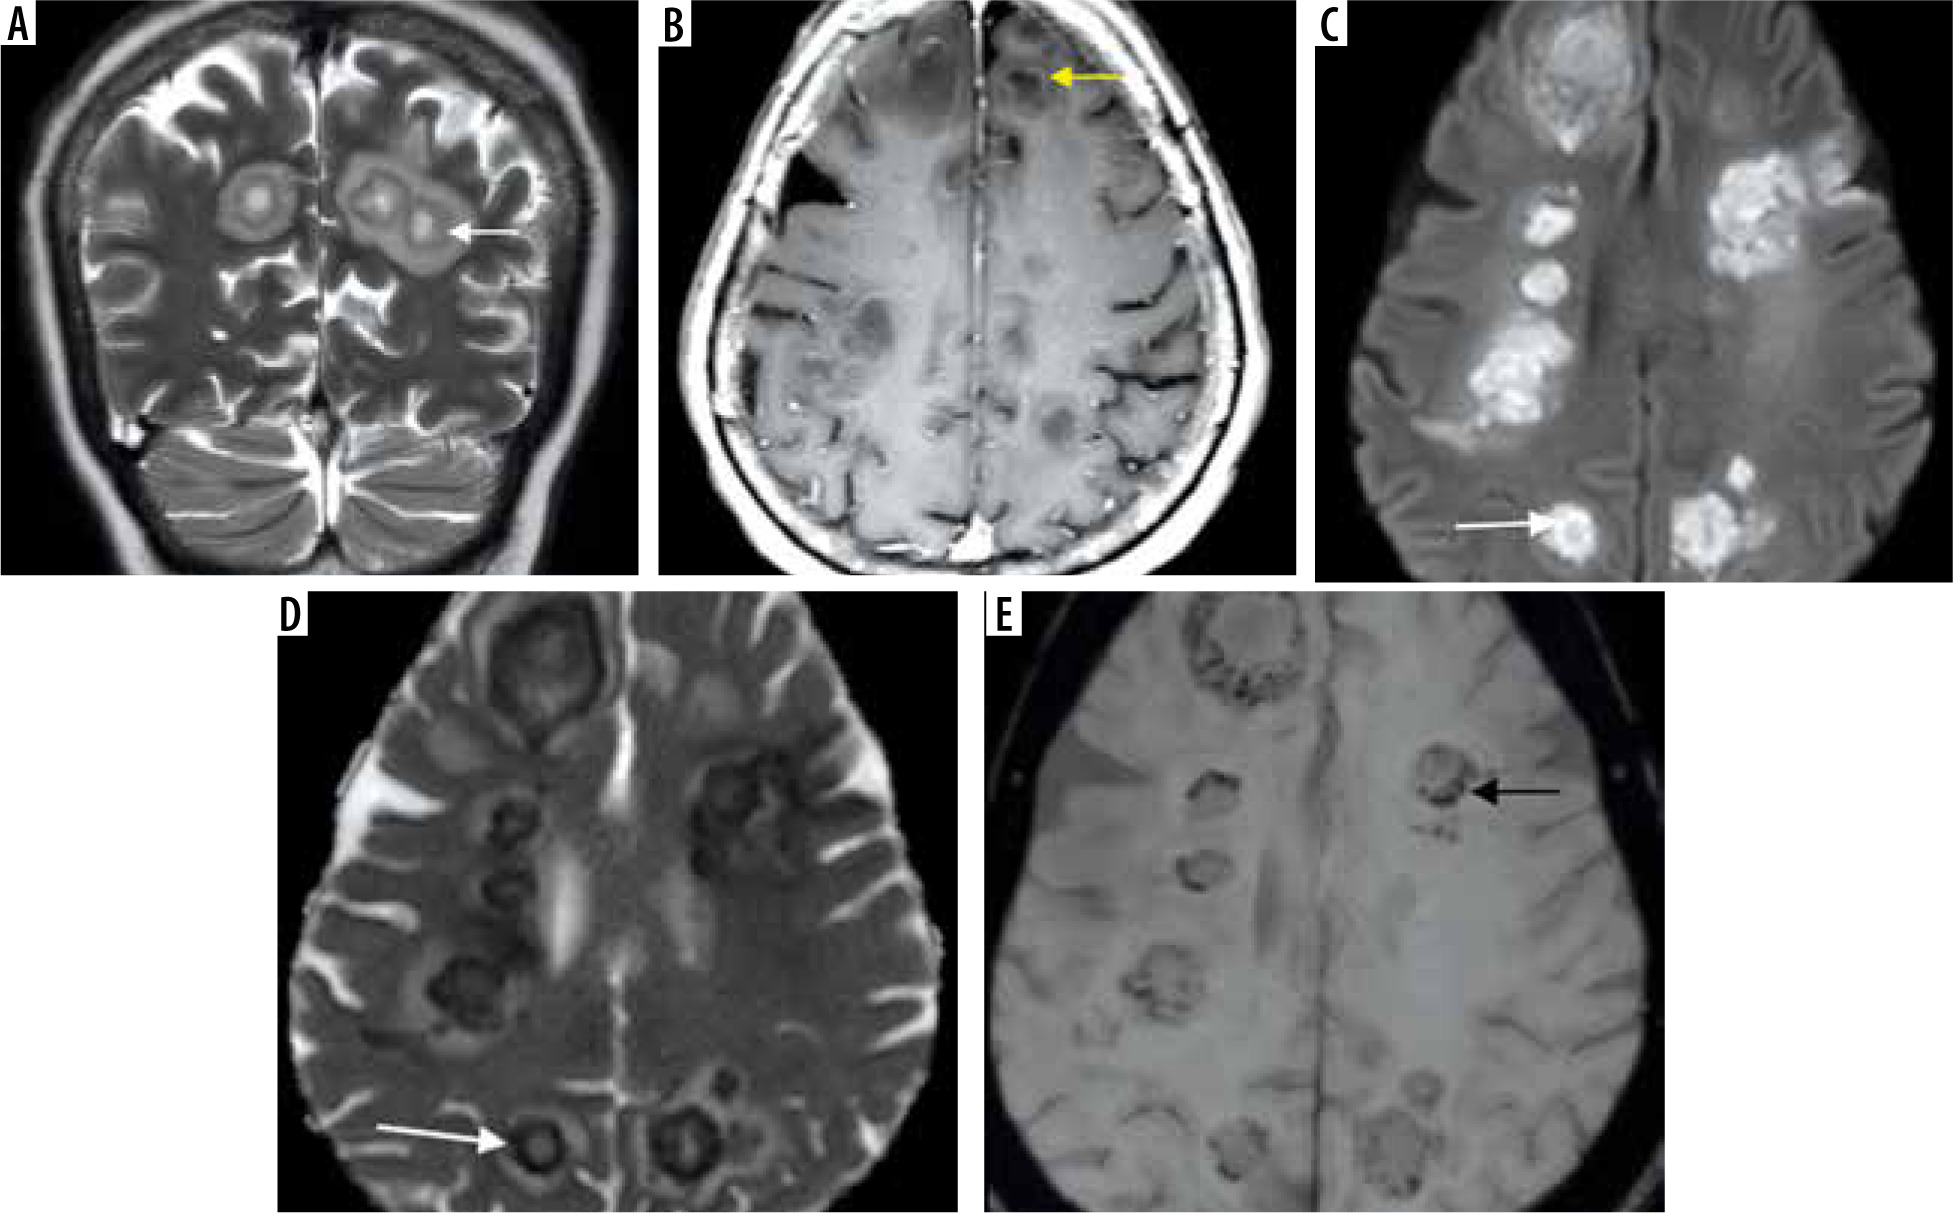
Figure 19
In a known case of COVID-related mucormycosis, post-contrast fat-suppressed (FS) T1-weighted (T1W) axial (A) and coronal (B) images reveal arterial wall enhancement (white arrows) and mild luminal narrowing of the cavernous segment of right internal carotid artery (ICA), suggesting fungal arteritis. In another patient with COVID-related mucormycosis, DWI (C) and corresponding ADC (D) images of the brain show acute embolic infarcts (yellow arrows) in the left fronto-parietal brain parenchyma
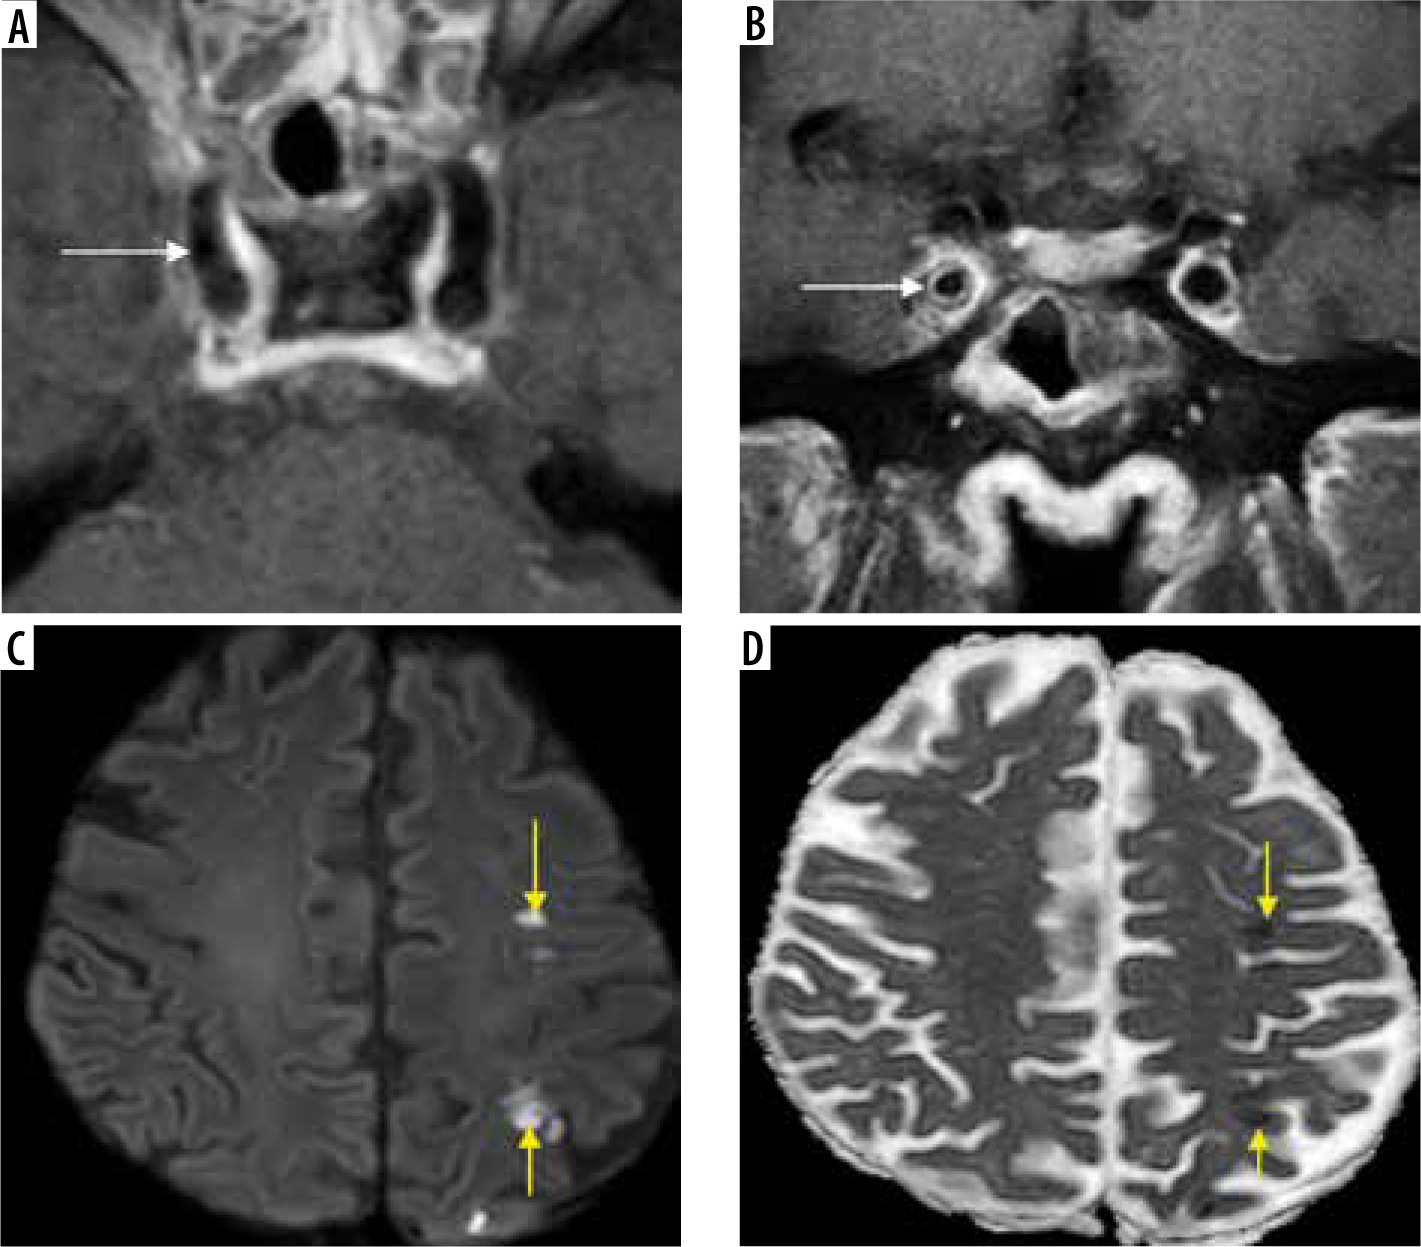
Figure 20
Imaging of skull base in a patient with chronic symptoms of skull-base involvement following COVID-19 infection. Soft-tissue mucosal thickening of the sphenoid sinus (yellow arrow) with areas of dehiscence of its bony walls seen on coronal and axial computed tomography (CT) (A, B). Post-contrast fat-suppressed (FS) T1-weighted (T1W) coronal magnetic resonance (MR) image shows break in continuity of the enhancing mucosal lining of the sphenoid sinus (C), indicating peri-sinus spread of disease. Permeative osteolysis, bone destruction of the basi-sphenoid, greater wings of sphenoid and parts of the petrous temporal bone, better appreciated on CT (bone window – white arrows). Dural enhancement along the middle cranial fossa (red arrows) and in-flammatory enhancement of the infra-temporal fossae (blue arrows) seen on post-contrast MRI (C, D). Imaging diagnosis of central skull-base osteomyelitis, probably due to indolent mucormycosis, was considered
Orbital apex syndrome (Figure 12) and pan-ophthalmitis are complications of mucormycosis of the orbit. Once within the orbital compartment, the fungal disease extends posteriorly to the optic foramen, where the ophthalmic artery, ophthalmic nerve, and optic nerve are at risk. One of the early presentations of ROC mucormycosis can be diminishment or loss of vision, which is caused either by occlusion of the central artery of the retina or by necrosis/infarction of the ophthalmic artery or due to fungal invasion/necrosis of the optic nerve (Figure 13) [11,17].
Intracranial extension of mucormycosis can occur either through the orbital orifices or through the skull base fora-mina. The disease can also spread to the cavernous sinuses, internal carotid arteries, and subsequently to the brain (Figures 15-19).
The cerebral form of ROC mucormycosis may present as skull-base osteomyelitis, pachymeningitis, extradural abscess and focal cerebritis, or cerebral abscess. Cerebral abscess can result either from direct invasion by the fungal disease or as a sequela of embolic phenomenon (Figure 18).
Furthermore, ROC mucormycosis should be considered in the appropriate clinical settings, when the patient presents with symptoms of unilateral cranial nerve involvement (Figures 15 and 16) suggesting Garcin syndrome [13].
The vascular involvement in mucormycosis is attributed to a combination of direct endothelial injury and growth of fungal hyphae into the lumen [18,19]. This leads to mycotic emboli and distal infarcts (Figure 19). Thus, mycotic angioinvasion is a hallmark of local tissue devitalization as well as vascular spread of the disease seen in mucormycosis [19].
Usually, mucormycosis runs an acute fulminant course. However, Figure 20 illustrates sphenoid sinusitis and bila-teral skull-base osteomyelitis on the CT and MRI images of a patient with history of COVID-19 infection. This patient presented with chronically evolving symptoms of skull-base osteomyelitis, spanning over 12 weeks. Although tissue diagnosis was not available, the rare entity of indolent/chronic mucormycosis may be considered in this patient, in view of the clinical presentation and imaging findings [20].
Conclusions
Effective management and prognosis of this potentially fatal infection depend on a high index of suspicion, early diagnosis of the disease, and appropriate assessment of the disease pattern and extent [3,5].
This pictorial essay provides a systematic imaging and reporting checklist that ensures step-by-step evaluation of the paranasal sinuses, orbits, and brain so as to detect any early signs of ROC mucormycosis. Middlebrooks EH et al., in their model proposed for the CT diagnosis of AIFRS, described aggregate evaluation of 7 imaging markers such as: peri-antral fat involvement, bone dehiscence, orbital invasion, pterygopalatine fossa involvement, nasolacrimal duct, and lacrimal sac involvement [12]. Their model demonstrated that involvement of any 2 of these 7 variables predicted AIFR with 100% specificity. Our experience is in line with the imaging findings stated in this model.
CT complements MRI in the detection and imaging evaluation of AIFRS. Adequate importance should be given to interpretation of CT images in soft-tissue as well as bone-window settings. Bone changes and dehiscence of bony walls can be better identified on CT images viewed in bone window. However, abnormal bone marrow signal and post-contrast enhancement pattern are better delineated on MRI. It is also superior in demonstrating early peri-sinus, intracranial, and intra-orbital extension of the disease [21]. MRI provides improved delineation of angioinvasion and perineural spread of the disease.
Appropriate use of these imaging techniques in pertinent clinical settings allows radiologists and clinicians to make a timely and accurate diagnosis of ROC mucormycosis. Thus, the extensive morbidity as well as mortality associated with this fulminant condition can be abated.