


Introduction
COVID-19 is a severe acute respiratory syndrome caused by coronavirus 2 (SARS COV-2), which is a beta-coronavirus, which first developed in China at the end of 2019, specifically in Wuhan [1]. On 5 January 2021, the cumulative number of reported cases reached over 83 million, with over 1.8 million deaths globally [2]. At present, the reference standard to make a definitive diagnosis of SARS-CoV-2 infection is the reverse-transcription-polymerase-chain-reaction assay (RT-PCR) [3]; however, the dramatic diseases dissemination made early diagnosis of the disease very difficult due to insufficient laboratory kits [4]. That is why chest imaging became a very important tool during the COVID-19 outbreak [5]. Computed tomography (CT) is considered the most effective method for the detection of lung abnormalities because it offers more sensitive results than chest radiographs, particularly in the early stage of the disease [6-9].
Pulmonary parenchymal disease severity is considered as a potential risk factor associated with fatal outcome; physicians should be aware of this so as to improve the risk stratification and adjust the level of care for high-risk patients [10,11]. Several studies examined the sensitivity and specificity of CT as a semi-quantitative method to assess the severity of COVID-19 infection in the initial chest CT by implementing the CT severity scoring system, and the results were very reliable [12]. Furthermore, serial chest CT imaging with different time intervals (3-7 days) has been reported as a helpful tool in assessing the disease progression from the time of initial diagnosis till the patient’s discharge [13]. Nevertheless, the dependence on CT as the only reliable radiological method to assess the severity of lung involvement is difficult to sustain over time and creates a great burden on radiology departments [14]. Chest radiographs could serve as substitute to CT examinations in terms of assessment of parenchymal disease severity, especially in monitoring the rapid progression of lung abnormalities in COVID-19.
Some radiographic scoring systems have been tried to reduce the burden on the CT chest as a semi-quantitative method for assessment of the severity of COVID-19 infection, but none of them were properly correlated with clinical severity and CT severity scores. One of the experimental chest X-ray scoring systems (named Brixia score) was designed by Borghesi and Maroldi [15] for hospitalized patients with SARS-CoV-2 infection in Italy, and was assessed on 100 hospitalized patients for whom the final outcome (recovery or death) was available. The results were very promising and led to consideration of this chest X-ray scoring system (CX-SS) as a useful parameter for predicting mortality in hospitalized patients with SARS-CoV-2 infection. In this study, we assess the accuracy of CX-SS using the Brixia score by comparing it to the clinical severity and CT severity scores.
Material and methods
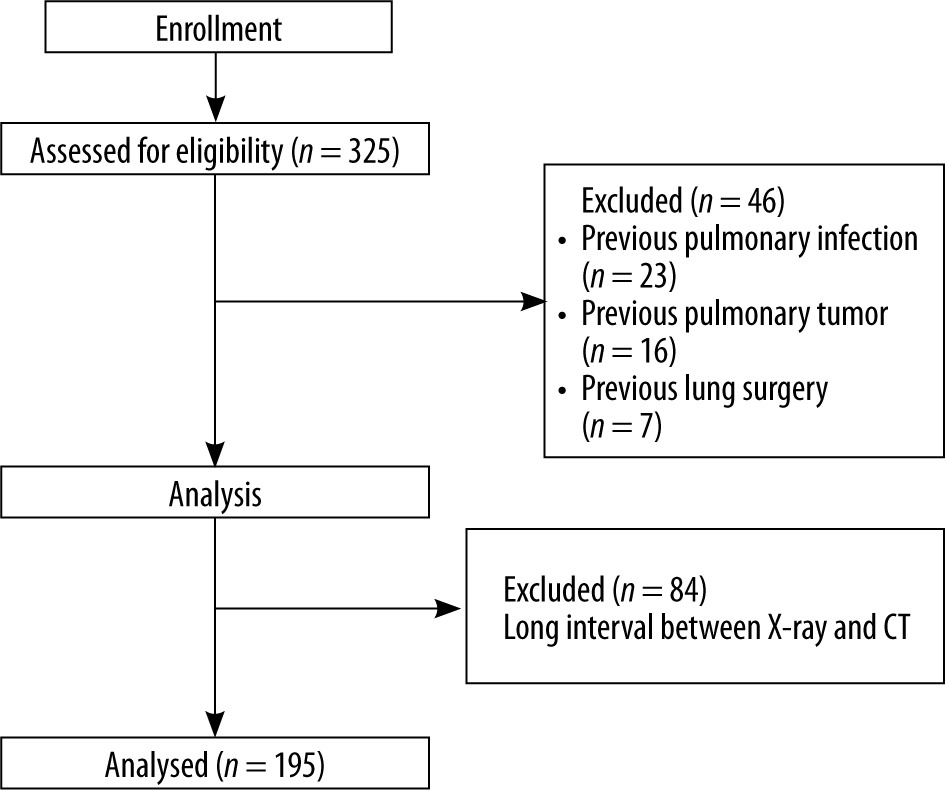
We retrospectively studied patients who were diagnosed with COVID-19 from March 2020 to October 2020 in our hospital. The study consisted of 325 patients in whom COVID-19 was confirmed by RT-PCR throat swab and who underwent X-ray and CT chest studies to assess parenchymal disease severity. Patients with a history of lung malignancy (n = 16), lobectomy (n = 7), and tuberculosis (n = 23) were excluded from this study. Patients who had a long interval (> 24 hrs) between the X-ray and CT chest studies (n = 84) were excluded from analysis to rule out the possibility of disease progression between the X-ray and CT studies that may affect the subsequent severity scoring results. The final analysis of this study included 195 patients (152 males and 43 females); the age range was from 22 to 80 years old, and mean age ± SD was 55.73 ± 10.64. The study flow chart is illustrated in Figure 1.
Chest X-ray scoring system
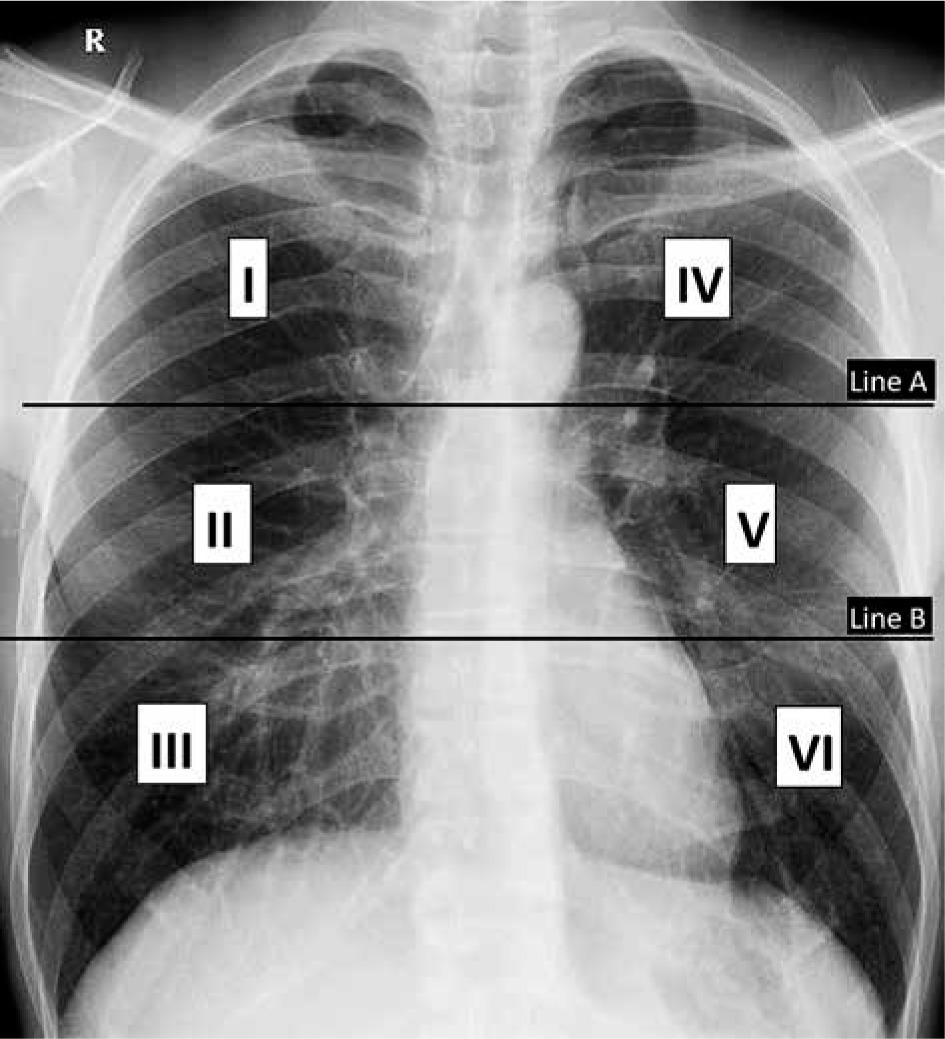
The Brixia severity score [15] divides the lungs into 6 zones on frontal chest projection: (i) upper zones (I and IV): above the inferior wall of the aortic arch, (ii) middle zones (II and V): below the inferior wall of the aortic arch and above the inferior wall of the right inferior pulmonary vein (i.e. hilar structures), and (iii) lower zones (II and VI): below the inferior wall of the right inferior pulmonary vein (i.e., lung bases) (Figure 2). A score (from 0 to 3) is given to each zone based on the lung abnormalities detected on frontal chest projection, as follows: (i) score 0: no lung abnormalities, (ii) score 1: interstitial infiltrates, (iii) score 2: interstitial and alveolar infiltrates (interstitial predominance), and (iv) score 3: interstitial and alveolar infiltrates (alveolar predominance).
Figure 2
Divisions of lungs into 6 zones on frontal chest X-ray for the Brixia scoring system. Line A is drawn at the level of the inferior wall of the aortic arch. Line B is drawn at the level of the inferior wall of the right inferior pulmonary vein
The score of the 6 lung zones are summed to have an overall CX-SS ranging from 0 to 18. Near to the overall score, the partial score of each zone (from I to VI) is also entered between square brackets. Other chest X-ray findings (such as pleural effusion, pulmonary vessel enlargement) were not included in the scoring system. For ease of comparison, our patients were classified according to their total radiographic score into 4 groups, as follows: (i) normal: 0, (ii) mild group: from 1 to 6, (iii) moderate group: from 7 to 12, and (iv) severe group: from 13 to 18.
Chest computed tomography severity score
The CT-SS is an adaptation of a method used previously to describe ground glass opacity, interstitial opacity, and air trapping, which was correlated with clinical and laboratory parameters in patients after SARS [12]. The 18 segments of both lungs are divided into 20 regions, in which the posterior apical segment of the left upper lobe is divided into apical and posterior segmental regions, while the anteromedial basal segment of the left lower lobe was subdivided into anterior and basal segmental regions. The lung attenuations in all of the 20 lung regions are subjectively evaluated on chest CT and given a score of 0.1 or 2 if the parenchymal opacification involved 0%, less than 50% or equal or more than 50% of each region, respectively. The CT-SS was defined as the sum of each individual score in the 20 lung segment regions, which may range from 0 to 40 points. The same as in X-ray studies, we classified all the CT studies of our patients into 4 groups according to their total CT-SS, as follows: (i) normal: 0, (ii) mild disease: from 1 to 13, (iii) moderate disease: from 14 to 27, and (iv) severe disease: from 28 to 40.
All patients were examined in a supine position, and images were acquired during a single inspiratory breath-hold. The scanning range was from the apex of the lung to costophrenic angle. CT scan parameters were as follows: X-ray tube parameters: 120 KVp, 350 mAs; rotation time: 0.5 second; pitch: 1.0; section thickness: 5 mm; intersection space: 5 mm; additional reconstruction with sharp convolution kernel and slice a thickness of 1.5 mm.
All the X-rays and CT images were independently reviewed by 2 radiologists with more than 10 years’ experience in chest imaging, blinded to the correlation between the X-ray and CT images for each patient to avoid the subsequent bias in the corresponding scoring system. All thin-section CT scans were reviewed at a window width and level of 1000 to 2000 HU and –700 to –500 HU, respectively, to assess the lung parenchyma.
Clinical severity scoring
We classified our patients into 3 groups according to the COVID-19 severity stratification by the World Health Organisation [16] into the following: (i) a mild-disease group that included symptomatic patients without evidence of viral pneumonia or hypoxia, (ii) a moderate disease group that had clinical signs of pneumonia such as fever, cough, dyspnea, fast breathing but no signs of severe pneumonia, including SpO2 ≥ 90% on room air [17], and (iii) a severe disease group who presented with clinical signs of pneumonia plus one of the following: respiratory rate > 30 breaths/min, severe respiratory distress, or SpO2 < 90% on room air.
Statistical analysis
SPSS software (version 22; IBM, Chicago, IL, USA) was used to perform statistical analysis. P-values < 0.05 were considered to indicate statistical significance. The Shapiro-Wilk test was used to assess the normality of data. Continuous variables were reported as mean ± standard deviation. We used Student’s t-test to compare between continuous variables when the distribution was normal and Fisher’s exact test to compare between categorical variables. The kappa (k) values were used to estimate the proportion of interobserver agreement for CX-SS and CT-SS. The k values were interpreted as follows: k values between 0.61 and 0.80 represented good; k values between 0.81 and 1.00 represented excellent. Pearson’s correlation coefficient was used for assessment to correlate between the CX-SS and CT-SS after calculation of mean scores for both observers.
Results
All the included patients had variable degrees of presenting symptoms and signs on admission; fever (82.5 %), cough (59%), fatigue (43.5%), anorexia (40%), shortness of breath (n = 60, 30.7%), myalgias (n = 21, 10.7%), other non-specific symptoms such as sore throat, nasal congestion, headache, diarrhoea, nausea, vomiting, loss of smell (anosmia), or loss of taste (ageusia) preceding the onset of respiratory symptoms were also recorded. Based on WHO stratification, COVID-19 clinical severity was mild in 60 patients (30.8%), moderate in 104 patients (53.3%), and severe in 31 patients (15.9%).
According to the chest radiographic findings, interstitial infiltrates were found in 47.2% of the patients, alveolar infiltrates in 68.2%, pulmonary vessel enlargement in 23.5%, and pleural effusions in 1%. Lesions were more frequent bilaterally and in the right lung. Lung involvement was more diffuse than peripheral and to lesser extent central. Chest X-ray characteristics among the study population are summarized in Table 1. CX-SS indicated normal radiographs in 19 patients (9.7%), mild disease in 22 patients (11.3%), moderate disease in 93 patients (47.7%), and severe disease in 61 patients (31.2%). The inter-observer agreement for CX-SS was good (k = 0.79, p = 0.001).
Table 1
Chest X-ray characteristics among the study population
According to the HRCT findings, 95.4% of the study population had ground glass attenuations, consolidations were found in 61.5%, crazy paving in 63%, reversed halo sign in 18.9%, sub-pleural bands in 47.7 %, and bronchiectasis in 42% of the patients. Atypical CT features as nodules were found in 10.7%, mediastinal lymphadenopathy in 18.4%, and pleural effusion in 2%. Similar to X-ray findings, lung affection was predominantly bilateral and more in the right lung. Lesions had more peripheral than diffuse distribution and to lesser extent central distribution. Chest CT characteristics among the study population are summarized in Table 2. CT-SS was normal in 9 patients (4.6%), indicated mild disease in 45 patients (23.1%), moderate in 108 patients (55.4%), and severe in 33 patients (16.9%). The inter-observer agreement for CTSS was excellent (k = 0.85, p = 0.001). Figures 3-6 are demonstrative cases for CX-SS and CT-SS.
Table 2
Chest computed tomography (CT) characteristics among the study population
Figure 3
Mild COVID-19 by CX-SS and CT-SS. A) Chest X-ray for a 42-year-old male shows bilateral infiltrates and was given a radiographic score of 4/18 (mild disease), B) coronal, and C, D) axial chest CT images show subsegmental peripherally distributed areas of ground-glass opacity (GGO), given a CT-SS of 9/40 (5 on the right side and 4 on the left side), and categorized as mild disease
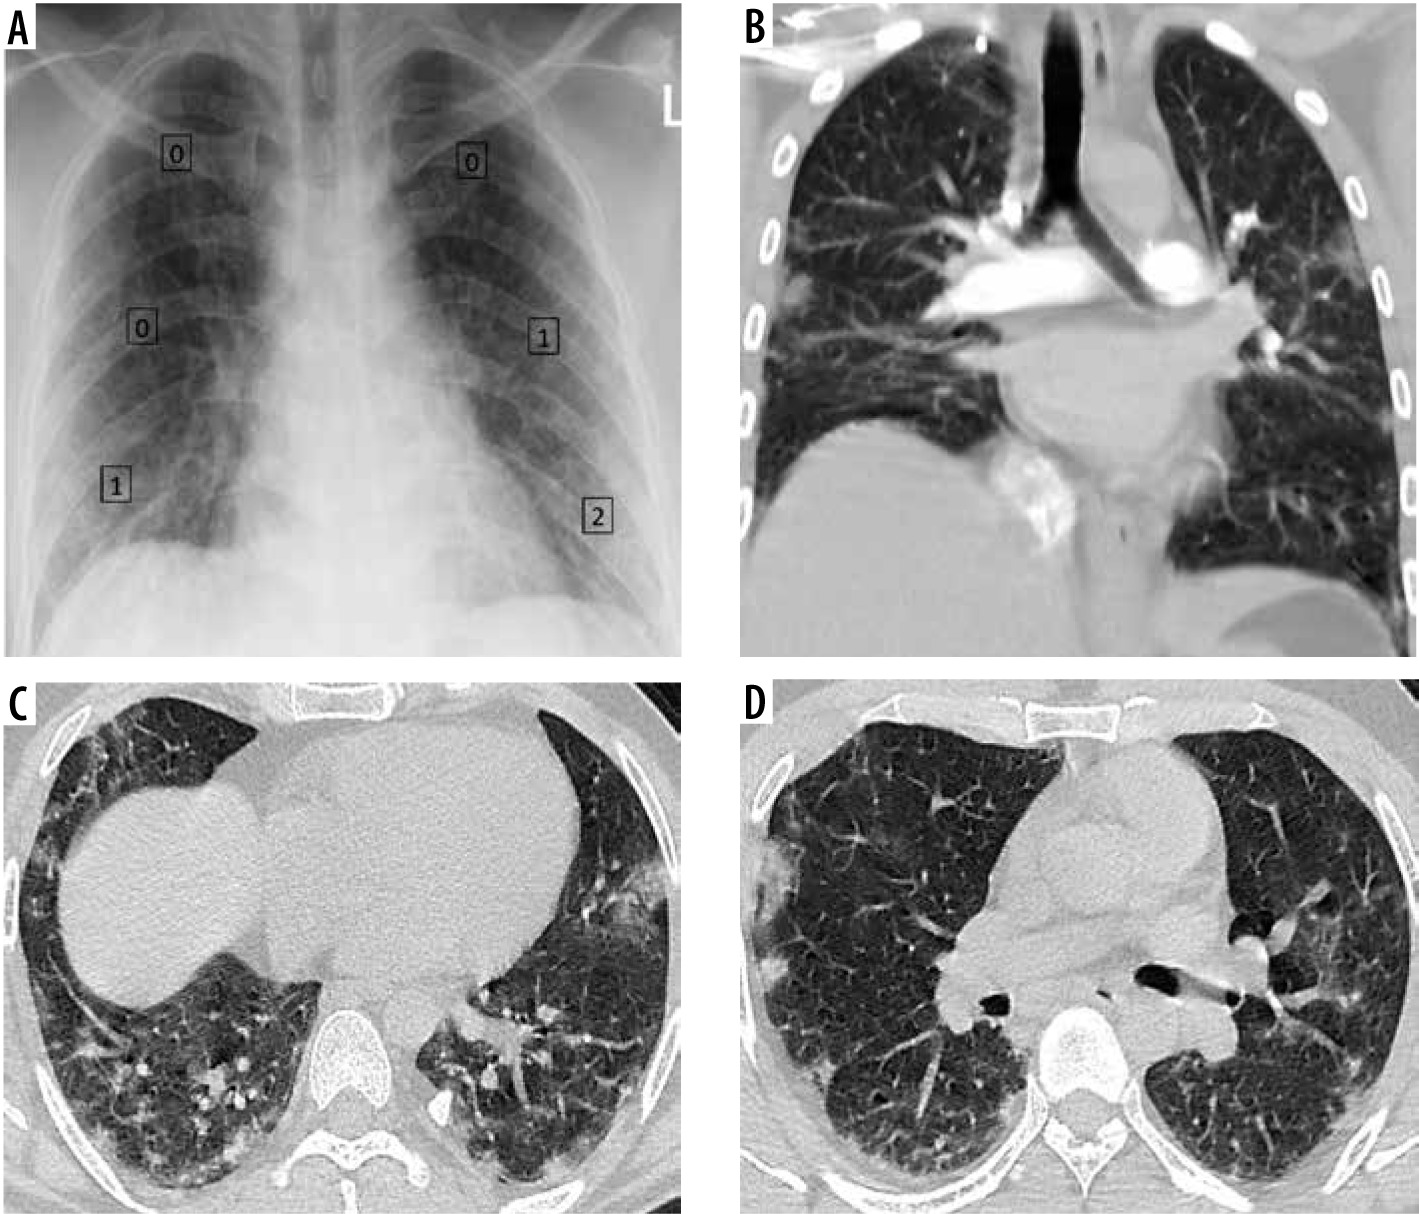
Figure 4
Discrepancy between COVID-19 severity by X-ray scoring system (CX-SS) and computed tomography (CT) scoring system (CT-SS). A) Chest X-ray of 72-year-old male shows bilateral infiltrates sparing the right upper zone and given a radiographic score of 6/18 (mild disease). B) Coronal (C, D) axial chest CT images show bilateral segmental areas of ground-glass opacity (GGO) and right lower lobe basal consolidation. It was given a CT-SS of 16/40 (10 on the right side and 6 on the left side) and categorized as moderate disease. CX-SS was underestimated as GGO in the right upper lobe were missed during interpretation

Figure 5
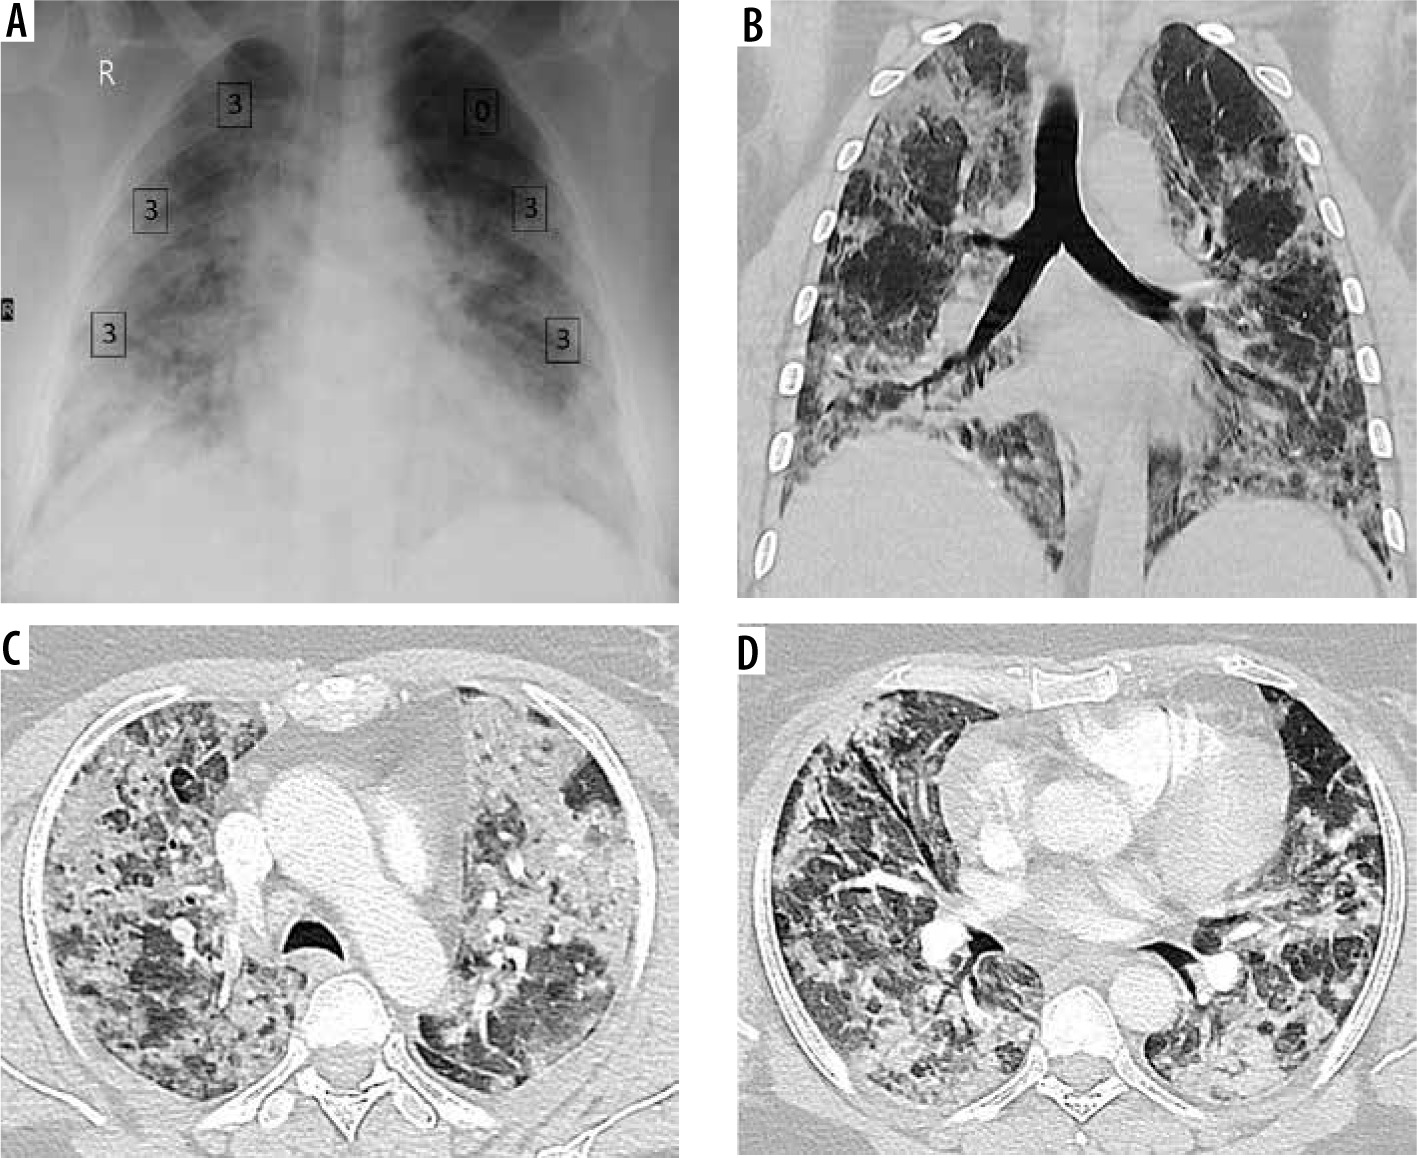
Discrepancy between COVID-19 severity by X-ray scoring system (CX-SS) and computed tomography (CT) scoring system (CT-SS). A) Chest X-ray of 72-year-old male shows alveolar opacities in the lower lung zones and right middle zone, and given a radiographic score of 9/18 (moderate disease). B) coronal (C, D) axial chest CT images show patchy areas of consolidation within both lung fields , more basally, and given a CT-SS of 10/40 (7 on the right side and 3 on the left side) and categorized as mild disease. CX-SS was overestimated secondary to overshadowing caused by lung consolidation
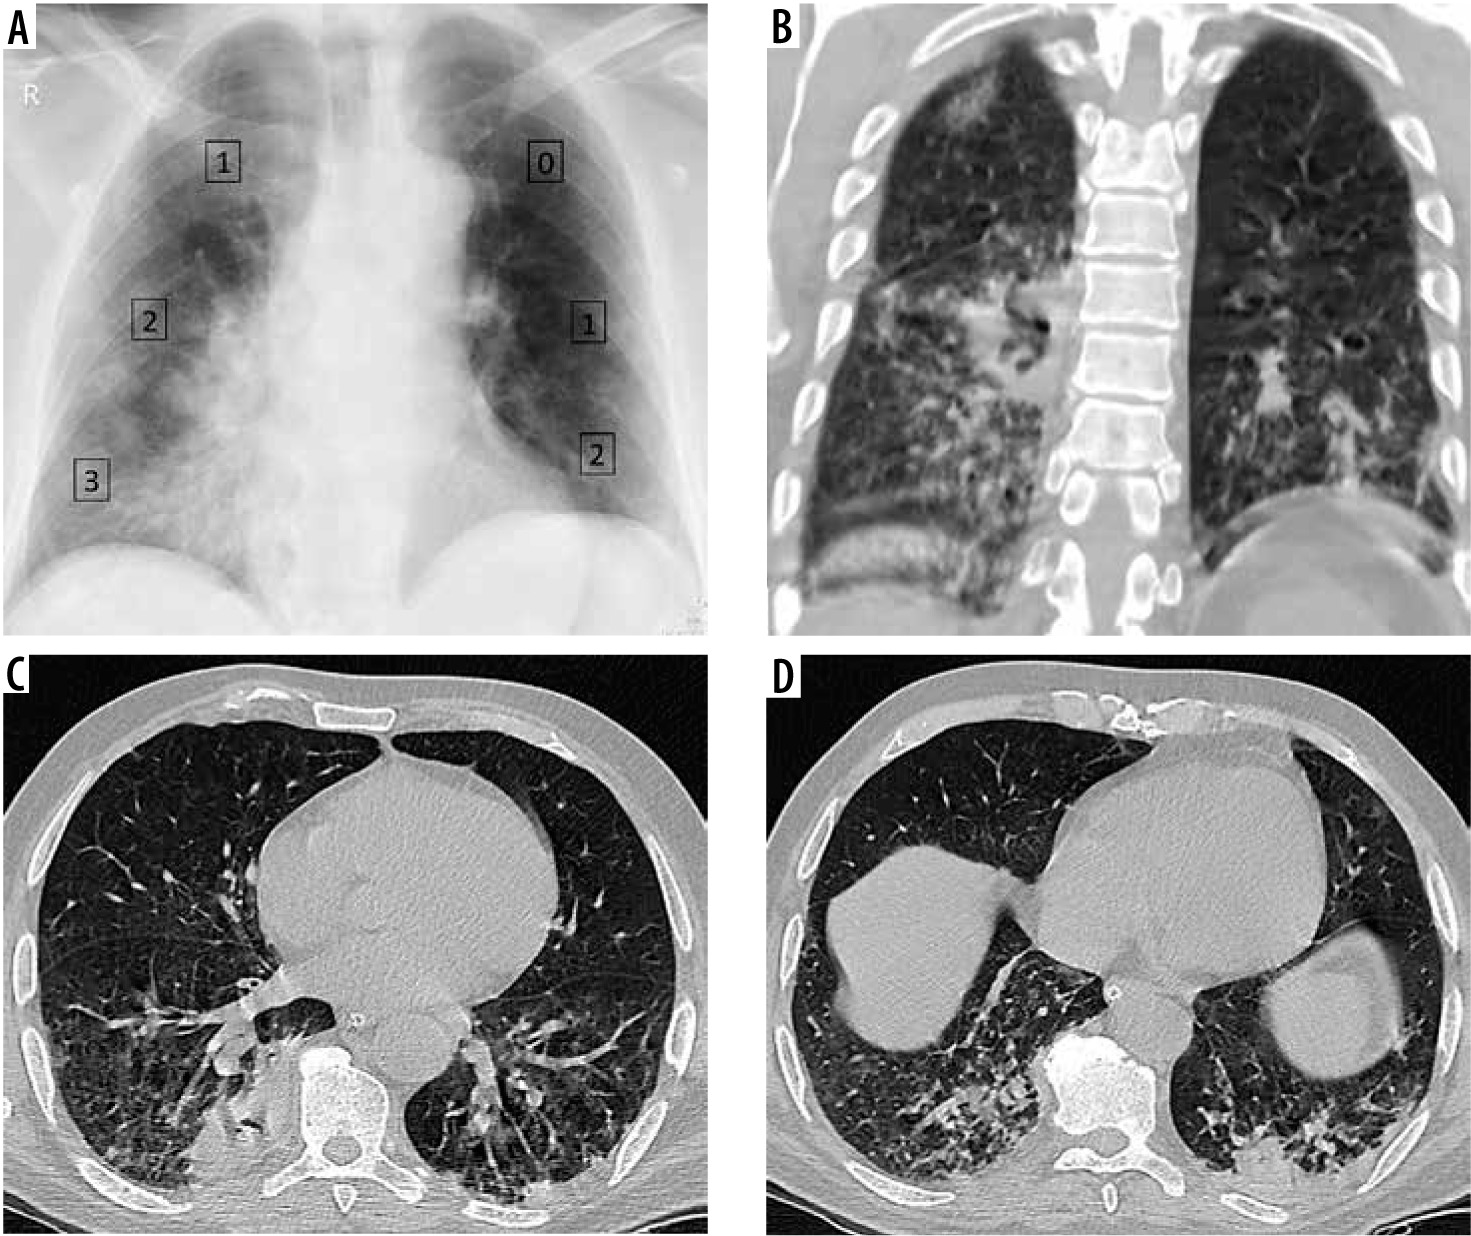
Figure 6
Severe COVID-19 by X-ray scoring system (CX-SS) and computed tomography (CT) scoring system (CT-SS). A) Chest X-ray of 57-year-old female shows bilateral alveolar infiltrates sparing the left upper lung zone and given a radiographic score of 15/18 (severe disease). B) Coronal (C, D) axial chest CT images show widely spread bilateral areas of consolidation. CT-SS was 37/40 (20 on the right side and 17 on the left side) and categorized as severe disease
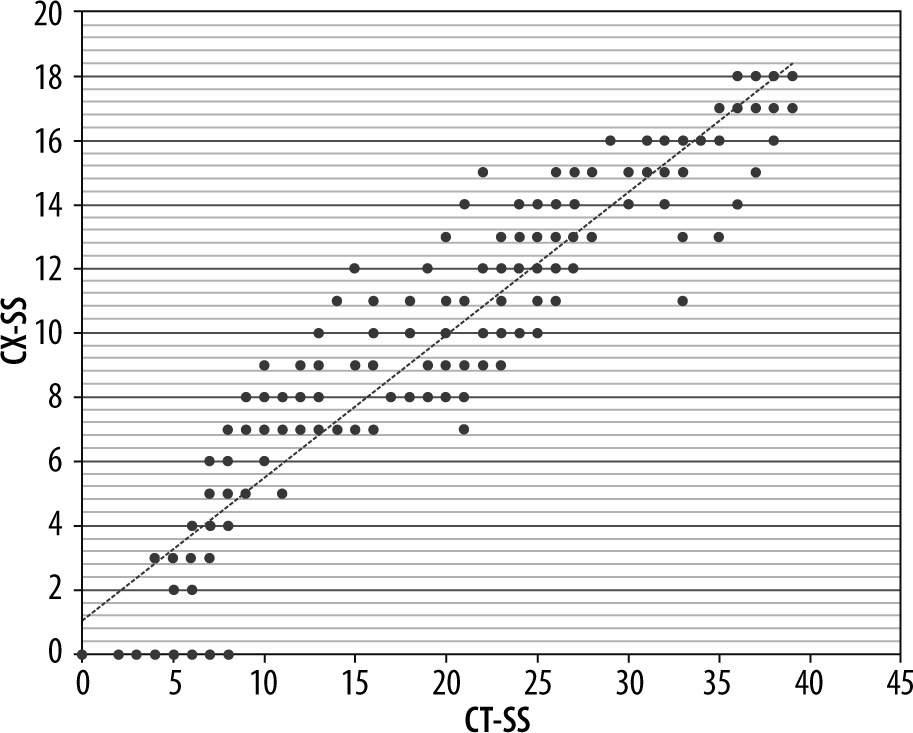
In relation to the clinical severity, sensitivity, specificity, and diagnostic accuracy of the CX-SS for diagnosis of mild cases was 66.2%, 100%, and 83.7%, for moderate cases 90.4%, 100%, and 94.6%, and for severe cases 100%, 84.5%, and 86.7%, respectively. Sensitivity, specificity, and diagnostic accuracy of the CT-SS for diagnosis of mild cases was 80%, 100%, and 92.8%, for moderate cases 100%, 95.7%, and 97.9%, and for severe cases 100%, 98.8%, and 98.9%. For assessment of the correlation between the CT-SS and CX-SS, Pearson’s correlation coefficient demonstrated a strong positive correlation (rs = 0.88, p < 0.001) (Figure 7).
Discussion
We examined the accuracy of the CX-SS using the Brixia score to assess the severity of pulmonary parenchymal disease in COVID-19 patients by comparing it to the clinical severity and correlation with more sensitive CT-SS proposed by Yang et al. [9]. We found that the CX-SS was efficient in expressing the degree of lung involvement in COVID-19-positive cases. CX-SS in this study showed low sensitivity to indicate mild disease, high sensitivity in detection of moderate to severe disease, and lesser specificity compared to CT-SS in the diagnosis of severe disease. These findings were in concordance with Stepha-nie et al., who found that COVID-19 chest X-ray severity and sensitivity are linked and that they increased with time, whereas chest X-ray specificity decreased over time and disease progression [18]. However, reviewers were asked to assign a severity score for the chest X-ray findings (from 0 to 3) as normal, mild, moderate, or severe, not a numerical-based scoring system like CX-SS.
The Brixia score is an experimental CX-SS designed for semiquantitative assessment of the severity and progression of pulmonary involvement in hospitalized patients with COVID-19. The preliminary validation study found that the inter-observer agreement was good and the CX-SS was a useful parameter for predicting mortality in hospitalized patients with SARS-CoV-2 infection [15]. Similarly, this study demonstrated well the interobserver agreement regarding the CX-SS score. During the early months of the pandemic, studies used scoring systems created in the pre-COVID-19 era [19,20] to assess chest radiographs severity scores, such as severe acute respiratory infection (SARI) [21] and Radiographic Assessment of Lung Edema (RALE) [22]. A retrospective study [9] including 350 COVID-19 (+ve) cases assessed the initial plain chest radiographs at the time of presentation and the follow-up chest X-ray for the same patients using the RALE scoring system [22]; it found a significant statistical correlation of the maximum total severity score and time to maximum score to the patient’s outcome (alive or dead) and concluded that CX-SS are a good monitor of COVID-19 chest manifestations and that its scoring system provides an accurate method to predict the disease severity.
Recently, other scoring systems were designed specifically for patients with confirmed COVID-19. Similar to the Brixia score, Monaco et al., [23] subdivided each lung into 3 zones and gave each zone a score on a scale from 0 to 3; however, the point assignment was based on the percentage of pulmonary involvement in each zone rather than the type of opacity. They reported moderate to excellent inter-observer agreement in the assessment of severity scores but weak correlation with clinical parameters. CO X-RADS is another system that was proposed by Bediar et al. [24] using chest radiographs to classify COVID-19 severity into 5 categories (0 to IV) according to the number and presence of different radiological signs attributed to COVID-19, such as vascular shadowing, interstitial thickening, alveolar opacities, consolidation, pleural effusion, and hilar enlargement. They concluded that CO X-RADS correlated well with the clinical severity score of patients.
Our results showed a level of correlation between CX-SS and CT-SS. The timing of the chest radiograph and CT acquisition was close (maximum 24-hr interval) to exclude any possibility of disease progression or regression in between. To validate the efficacy of CX-SS, we used the CT-SS proposed by Yang et al. in March 2020. The CT-SS is an adaptation of a scoring system previously used during the SARS epidemic in 2005 [24]. They found that CT-SS is higher in severe and critical cases when compared to mild and common cases, and a CT-SS threshold of 19.5 could identify severe COVID-19. Similarly to our results, the inter-reader agreement between their 2 radiologists was excellent, and they concluded that CT-SS provides a straightforward semi-quantitative method for assessing severity of COVID-19 in the initial chest CT [12]. Compared to other semi-quantitative severity scoring systems, such as chest CT severity score [25] and total severity score [26], CT-SS has a higher accuracy of assessing the pulmonary abnormalities because it depends on processing of 20 pulmonary segments and not just the 5-lobe analysis used in the other systems. Nevertheless, the number of regions that are required to be processed in CT-SS by a radiologist may cause difficulties during evaluation and longer time for interpretation [27].
Professional radiologic societies [28-30] do not recommend CT imaging as a general diagnostic imaging tool for patients with COVID-19 due to concerns regarding CT, including risks associated with patient transport, decontamination of CT scanners, and exposure of healthcare providers. The radiation burden is another concern when using serial CT examination to assess the severity of COVID-19. The approximate effective radiation dose for chest X-ray is 0.1 mSv compared to computed tomography (CT) of the chest at 7 mSv [31]; this gives a greater advantage of the use of CX-SS over CT-SS in terms of reducing the radiation exposure for COVID-19 patients.
This study has some limitations that should be addressed. The sample size was relatively small compared to the current burden of COVID-19 because we excluded patients who had chest X-ray and chest exams with a time interval greater than 24 hours. The data were collected retrospectively, comprising patients admitted to hospital, which carries the selection bias of patients with more severe disease. Lastly, some of the chest X-ray were taken in AP projection as a portable study for critical patients, so the quality of the chest X-ray was not uniform for all the cases.
Conclusions
The CX-SS (Brixia score) is a reliable tool to assess the severity of pulmonary parenchymal disease in COVID-19 patients, particularly in moderate and severe cases, with a tendency of overestimation of severe cases. It can adequately replace the CT scoring system, especially in the high peaks of pandemic, to reduce the burden on the CT scanner and satisfy the need for rapid and efficient assessment of the severity of COVID-19 with lower radiation exposure compared to chest CT.