


Introduction
Renal cell carcinoma (RCC) is a common type of cancer and is among the 10 most spread malignancies overall, and sixth in men. The incidence of RCC in the world is increasing annually by 2-3%, with this pathology developing in 1 in 63 people during their lifetime. In the USA, the annual number of newly diagnosed RCC cases is approximately 271,000 while the number of deaths due to this pathology is 116,000 per year [1]. Around 30% of patients present with the locally advanced or metastatic form of RCC [2]. Isolated metastatic involvement of the lymph node portends poor prognosis and is associated with a 1-year and 5-year metastasis-free survival after surgical treatment of only 37% and 16%, respectively, with a median time to progression of 4.2 months [3]. Also, patients with lympha-denopathy have 3-4 times higher risk of distant metastatic disease [4]. Moreover, 13% of patients already possess distant metastasis at presentation [5].
Nowadays, the gold standard of treatment of localized RCC is partial or radical nephrectomy depending on the size and location of the lesion [6]. In most cases, surgical removal of the tumour or tumour-bearing organ grants durable cancer-specific survival rates. Notwithstanding, in some cases, local recurrence (LR) may arise in the renal fossa or remnant renal parenchyma. According to different sources, the prevalence of this dangerous occurrence ranges between 2 and 10% [7,8]. The interim between nephrectomy and development of LR is variable – from 3 months to 45 years – which calls attention to the momentousness of long-term follow-up [9]. What is more important – patients with isolated LR are at higher risk of distant metastatic disease [10].
Diagnostics of isolated LR is challenging due to post-operational changes in the region of the renal bed and non-specific presentation on cross-sectional images such as multiphase computed tomography (CT) and magnetic resonance imaging (MRI), and the presence of small bowel or pancreatic tail within the renal bed. The cellulose and gelatin bolster mass in the location of post-operative scar following laparoscopic partial nephrectomy is frequently interpreted as LR of tumour due to its morphology and characteristics of enhancement [11]. In some works, good potential of contrast-enhanced CT in the differentiation of recurrent renal-cell carcinoma from post-operative desmoplastic reaction [12-14] and FDG-PET/CT for detection of local relapse of RCC was illuminated [15,16]; however, still no imaging (nor molecular) marker that is able to accurately differentiate LR from benign tissues was found.
There is evidence that application of the apparent diffusion coefficient (ADC) of diffusion-weighted images (DWI) of MRI allow accurate differentiation of RCC from benign renal lesions, such as angiomyolipoma and oncocytoma, and prognostication of tumour grade [17]. However, the potential of ADC in the diagnostics of LR of RCC has not been comprehensively investigated. The goal of our study was to assess the diagnostic performance of the DWI/ADC of MRI in distinguishing LR of RCC from benign conditions after partial nephrectomy.
Material and methods
Ethics statement
This retrospective study was approved by the local ethics committee and was based on the data of 4 leading medical centres based in Ukraine and Poland, in years 2013-2021. Written informed consent for enrolment in the study was signed by all patients.
Selection criteria
Thirty-nine patients (25 men and 14 women) were enrolled in the study, the average age was 65.24 ± 5.87 years. The study included patients who underwent partial nephrectomy for solid RCC (in all cases pathologically verified) and in whom, according to MRI data in a late postoperative period (≥ 6 months after surgery), one or more of the following inclusion criteria were observed: a) signs of local relapse of the neoplastic process (increased accumulation of contrast agents in the area of the postoperative defect of the kidney or other part of its parenchyma); b) no signs of local recurrence of tumour in the area of postoperative defect of the renal parenchyma (or presence of MR features of postoperative fibrosis) within ≥ 1 year after surgery, provided there are at least 2 MRI examinations with an interval of ≥ 6 months (penultimate MRI data were included in the study and analysed). The mean time of follow-up was 24.34 ± 4.56 months. The study did not include patients with distant RCC metastatic lesions, inoper-able cases, bilateral tumours, with severe chronic kidney disease (stages 4 and 5), and with urinary tract infections.
Patients’ clinical characteristics
According to postoperative pathomorphological reports obtained after initial surgical treatment, the tumour size varied from 2.89 to 7.28 cm in the largest dimension, and the average size was 4.56 ± 1.63 cm. The distribution of the RCC stage according to the TNM classification was as follows: pT1aN0M0 – 25 (64.10%) patients, pT1bN0M0 – 9 (23.08%) patients, and pT2aN0M0 – 5 (12.82%) cases. By histological subtype, there were 28 (71.79%) patients with clear-cell variant of RCC (ccRCC), 6 (15.38%) patients with papillary RCC subtype (pRCC), and 4 (12.82%) patients with chromophobe RCC (chRCC). With the aim of facilitating statistical analysis, in our study the 2-tiered Fuhrman classification was used to define the degree of RCC nuclear atypia, in which grades I and II were combined as low grade (LG) and grades III and IV were combined as high grade (HG). Among conventional RCC, 16 (57.14%) patients had LG according to Fuhrman classification and 12 (42.86%) had HG. In patients with pRCC low Fuhrman grade was observed in 4 (66.67%) patients and high grade in 2 (33.33%) cases. The patients with chRCC were not classified according to Fuhrman gradation, given the low prognostic value of this system for the chromophobe RCC subtype. Detailed clinical and pathological characteristics of patients with RCC after initial surgical treatment are presented in Table 1.
Table 1
Clinical and pathological characteristics of patients with renal cell carcinoma after initial surgical treatment
All patients with MRI features of LR (progressive increasing in the lesions’ size in the region of post-op renal scar along with active contrast enhancement and/or invasive behaviour) were included into the main group (n = 14), and the remaining patients without MRI features of RCC recurrence (no evidence of the expansive enlargement of post-operative renal scar with mild to moderate contrast enhancement and without invasive behaviour) were enrolled into the comparison group (n = 25). All patients of the comparison group after inclusion into this study were followed up using MRI for at least 2 years; during this period we registered no imaging features of RCC LR. We used the MR-data of healthy volunteers (control group) from another study as reference values of ADC of normal renal parenchyma (n = 25) [18].
Local recurrence management
In all patients with radiological and clinical signs of local recurrent RCC, surgical treatment was performed depending on the size, spread, and location of the tumour: resection of the kidney with recurrent lesion was executed in 10 (71.43%) patients and radical nephrectomy in 4 (28.57%) patients.
MRI protocol and image analysis
In all cases MRI was performed according to unified protocol, using a 1.5-T body scanner (Signa HDxt, General Electric, USA) with an 8-channel phased-array body coil. The scanning parameters of the DWI sequence were as follows: TR = 12,000 ms, TE = 90 ms, FOV = 40 cm × 40 cm; matrix = 200 × 192; NEX = 3; bandwidth = 250 kHz, diffusion direction = slice, slice thickness = 6.0 mm, interscan gap = 1.0 mm, b-value = 800 s/mm2, before contrast media administration, using of single-shot echo-planar imaging with parallel imaging technique/fat suppression, and breath-hold. Axial 3D LAVA sequence was routinely included into the scanning protocol and was used to detect suspicious kidney regions.
In all cases, the values of the ADC were recorded by placing the region of interest (ROI) over the area of the postoperative scar of the kidney or suspicious lesion, carefully repeating its contour, or the area of the parenchyma where the resumption of the tumour growth was suspected, as well as over the region of unaffected renal parenchyma. To avoid contamination by adjacent tissues, an oval ROI was chosen with mean diameter of 3.5 ± 2.5 mm and drawn over the kidney. The signal intensity of DWI was not measured, because based on the data obtained by us earlier, it was not informative in the differentiation of RCC. The DWI sequence was used as an anatomical reference point and a source for ADC map generation. The MRI data were interpreted by 2 radiologists with special training in urogenital radiology with 10 and 20 years of experience.
Statistical analysis
ADC-map production and ADC measurements were performed using Functool 4.5. SPSS 22.0 software was used for statistical data analysis. The ADC values were expressed as mean value ± standard deviation. The differences between ADC values in patients’ subgroups were calculated by means of analysis of variance (ANOVA). The results of the study were considered statistically significant if p < 0.05. The specificity and sensitivity were calculated by means of receiver operating characteristic (ROC) method.
Results
In all 14 (100%) cases, after surgical treatment of a suspected recurrence, the diagnosis of RCC corresponding to the primary tumour histological subtype was pathologically confirmed: in 92.86% of high Fuhrman grade and in 7.14% of low Fuhrman grade. The average size of the tumour was 2.21 ± 0.67 cm. According to pathomorphological analysis following radical nephrectomy, in 3 (75.0%) out of 4 cases the metastatic involvement of regional lymph nodes was found (pN1), and in 1 (25.0%) case spread of a tumour thrombus in the renal vein (pT3a) was detected.
With respect to pathologic analysis, on the DWI, both areas with RCC local recurrence and benign fibrous changes in post-operative renal scar had a hyperintensive signal relative to the normal parenchyma, which helped to identify pathological changes and place the ROI above them. As a result of the retrospective analysis, we obtained a significant difference in the mean values of ADC in the main, comparison, and control groups. The mean ADC values of recurrent RCC demonstrated significantly higher numbers compared to benign fibrous tissues and were 1.64 ± 0.15 × 10⁻³ mm2/s vs. 1.02 ± 0.26 × 10⁻³ mm2/s (p < 0.001). Moreover, the mean ADC values of RCC LR and benign post-op changes in renal scar substantially differed from the mean ADC values of healthy kidney parenchyma; the latter was 2.58 ± 0.05 × 10⁻³ mm2/s (p < 0.001) (Table 2, Figure 1).
Table 2
Detailed statistical characteristics of the apparent diffusion coefficient of the renal cell carcinoma (RCC) local recurrence, benign fibrotic tissues of post-op renal scar, and normal renal parenchyma
Figure 1
The box plot of the apparent diffusion coefficient of renal cell carcinoma (RCC) local recurrence, benign postoperative changes of the kidney, and the normal renal parenchyma
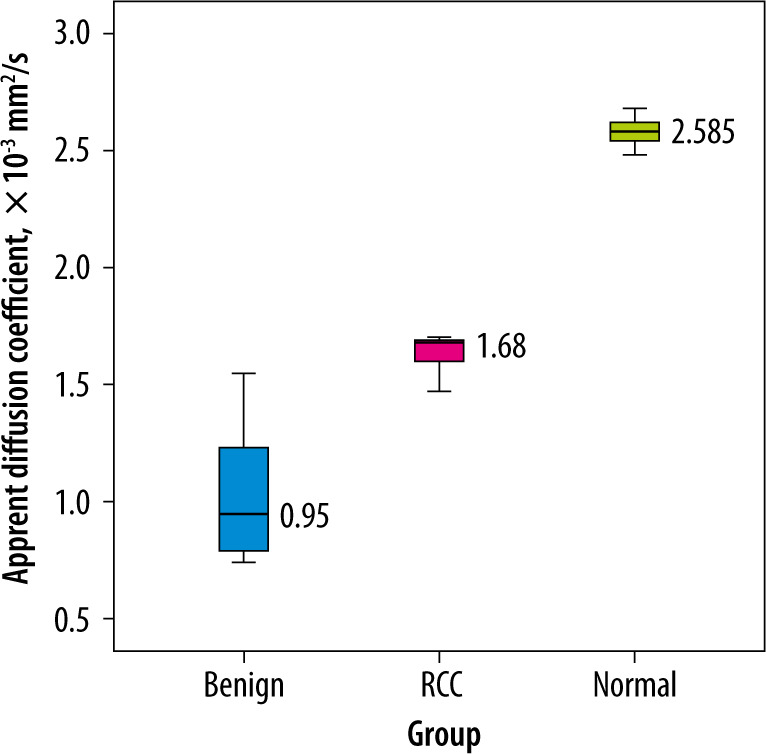
Of note, the mean ADC values of conventional (n = 7), papillary (n = 4), and chromophobe (n = 3) histological subtypes of RCC in the group with local recurrence were 1.72 ± 0.10 × 10⁻³ mm2/s, 1.61 ± 0.03 × 10⁻³ mm2/s, and 1.39 ± 0.11 × 10⁻³ mm2/s, respectively, and showed statistically significant difference (p < 0.05). The mean ADC values of locally relapsing HG and LG RCC were not analysed due to an insufficient number of cases in the second subgroup of patients, which was a limitation of our study.
In ROC analysis, the use of ADC with a threshold value of 1.28 × 10⁻³ mm2/s allowed us to differentiate local recurrence of RCC from benign postoperative changes of the renal parenchyma with 100% sensitivity, 80% specificity, and high accuracy: AUC = 0.980 (95% CI = 0.945-0.998, p < 0.001) (Figure 2).

Discussion
This study was an assessment of the diagnostic performance of the apparent diffusion coefficient of the DWI of MRI in distinguishing local RCC recurrence from benign post-operative changes in renal tissues after partial nephrectomy. The main risk factors of RCC LR are incomplete resection of the primary tumour, positive surgical margins, and regional metastatic lymph node involvement [19]. Local relapse of RCC is a rare condition: in our multicentre study we observed only 14 cases or RCC LR during the 8 years. In our study we used 2-tiered Fuhrman classification of RCC to facilitate a statistical analysis of a limited number of observations. According to Sun et al., simplified 2-tiered Fuhrman classification of RCC demonstrates equal prognostic performance compared to the 4-tiered gradation system [20].
The detection and differentiation of relapsing RC by means of cross-sectional imaging is still a significant clinical problem: currently there is no accurate imaging marker of locally recurrent RCC. The presence of active contrast enhancement in the region of post-operative kidney scar in the late arterial, early corticomedullary, parenchymal, and excretory CT or MRI phases may increase the suspicion of RCC LR and provide primary data for differentiation of relapsing tumour with desmoplastic or inflammatory mass lesions [13,14].
There is a paucity of scientific data dedicated to imaging features and markers of recurrent RCC. According to Lang et al., enhancement > 90 HU of the renal lesion at the operative site during arterial CT phase strongly suggests RCC relapse, while a progressive decrease in lesion size suggests a desmoplastic reaction. However, this study included only 2 cases of LR RCC [12]. In another small series, increase in attenuation of 10-20 HU on contrast-enhanced CT at the post-operative site was characteristic of a bolster-related mass [11], which can be confusing while differentiating low-vascularized relapsing RCC. As was demonstrated by Alongi et al., the role of FDG PET/CT in the diagnostics of RCC local recurrence was uncertain, particularly due to the high rate of false negative results due to the limited PET scanner resolution and low vascularization of several histological subtypes of RCC, such as chromophobe [16]. In contrast, in a study by Malhotra FDG PET/CT was a valuable tool for the detection of port-site recurrence of RCC [21].
Previously, the value of ADC in improving the differential diagnosis, histologic subtyping, and grade differentiation of RCC using MRI [22] and in assessing RCC systemic treatment response with tyrosine kinase inhibitor was demonstrated [18]. In the current study we ana-lysed the performance of ADC of DWI in the diagnostics of locally recurrent RCC. We found that the mean ADC value or RCC LR was significantly higher compared to benign changes in kidney parenchyma at the post-op site and amounted to 1.64 ± 0.15 × 10⁻³ mm2/s vs. 1.02 ± 0.26 × 10⁻³ mm2/s (p < 0.001) (Figures 3 and 4). At the same time, in the comparison group, the obtained range of ADC values, from 0.74 to 1.55 × 10⁻³ mm2/s, was significantly lower compared both with the group with LR of RCC and with normal renal parenchyma, reflecting a significant restriction of diffusion in the area of postoperative kidney defect, probably due to a reduced the degree of microvascularisation because of fibrotic and sclerotic post-surgical alterations in renal tissues (Figure 5).
Figure 3
Magnetic resonance imaging data of female patient B., 65 years old, 23 months after partial nephrectomy due to clear cell renal cell carcinoma of the right kidney, stage pT1aN0M0, high grade according to Fuhrman system (arrows), axial projections. A) Axial T2-weighted fast recovery fast spin echo; B) axial dual-echo fast spoiled gradient-echo; C) axial diffusion-weighted imaging, in the region of post-op scar of the renal parenchyma there is an area of hyperintensity; D) ADC-map, the value of ADC over the region of post-op kidney defect was 1.59 × 10⁻³ mm2/s. Pathological diagnosis after re-resection of the kidney: recurrent conventional RCC pT1aN0M0, HG according to Fuhrman system
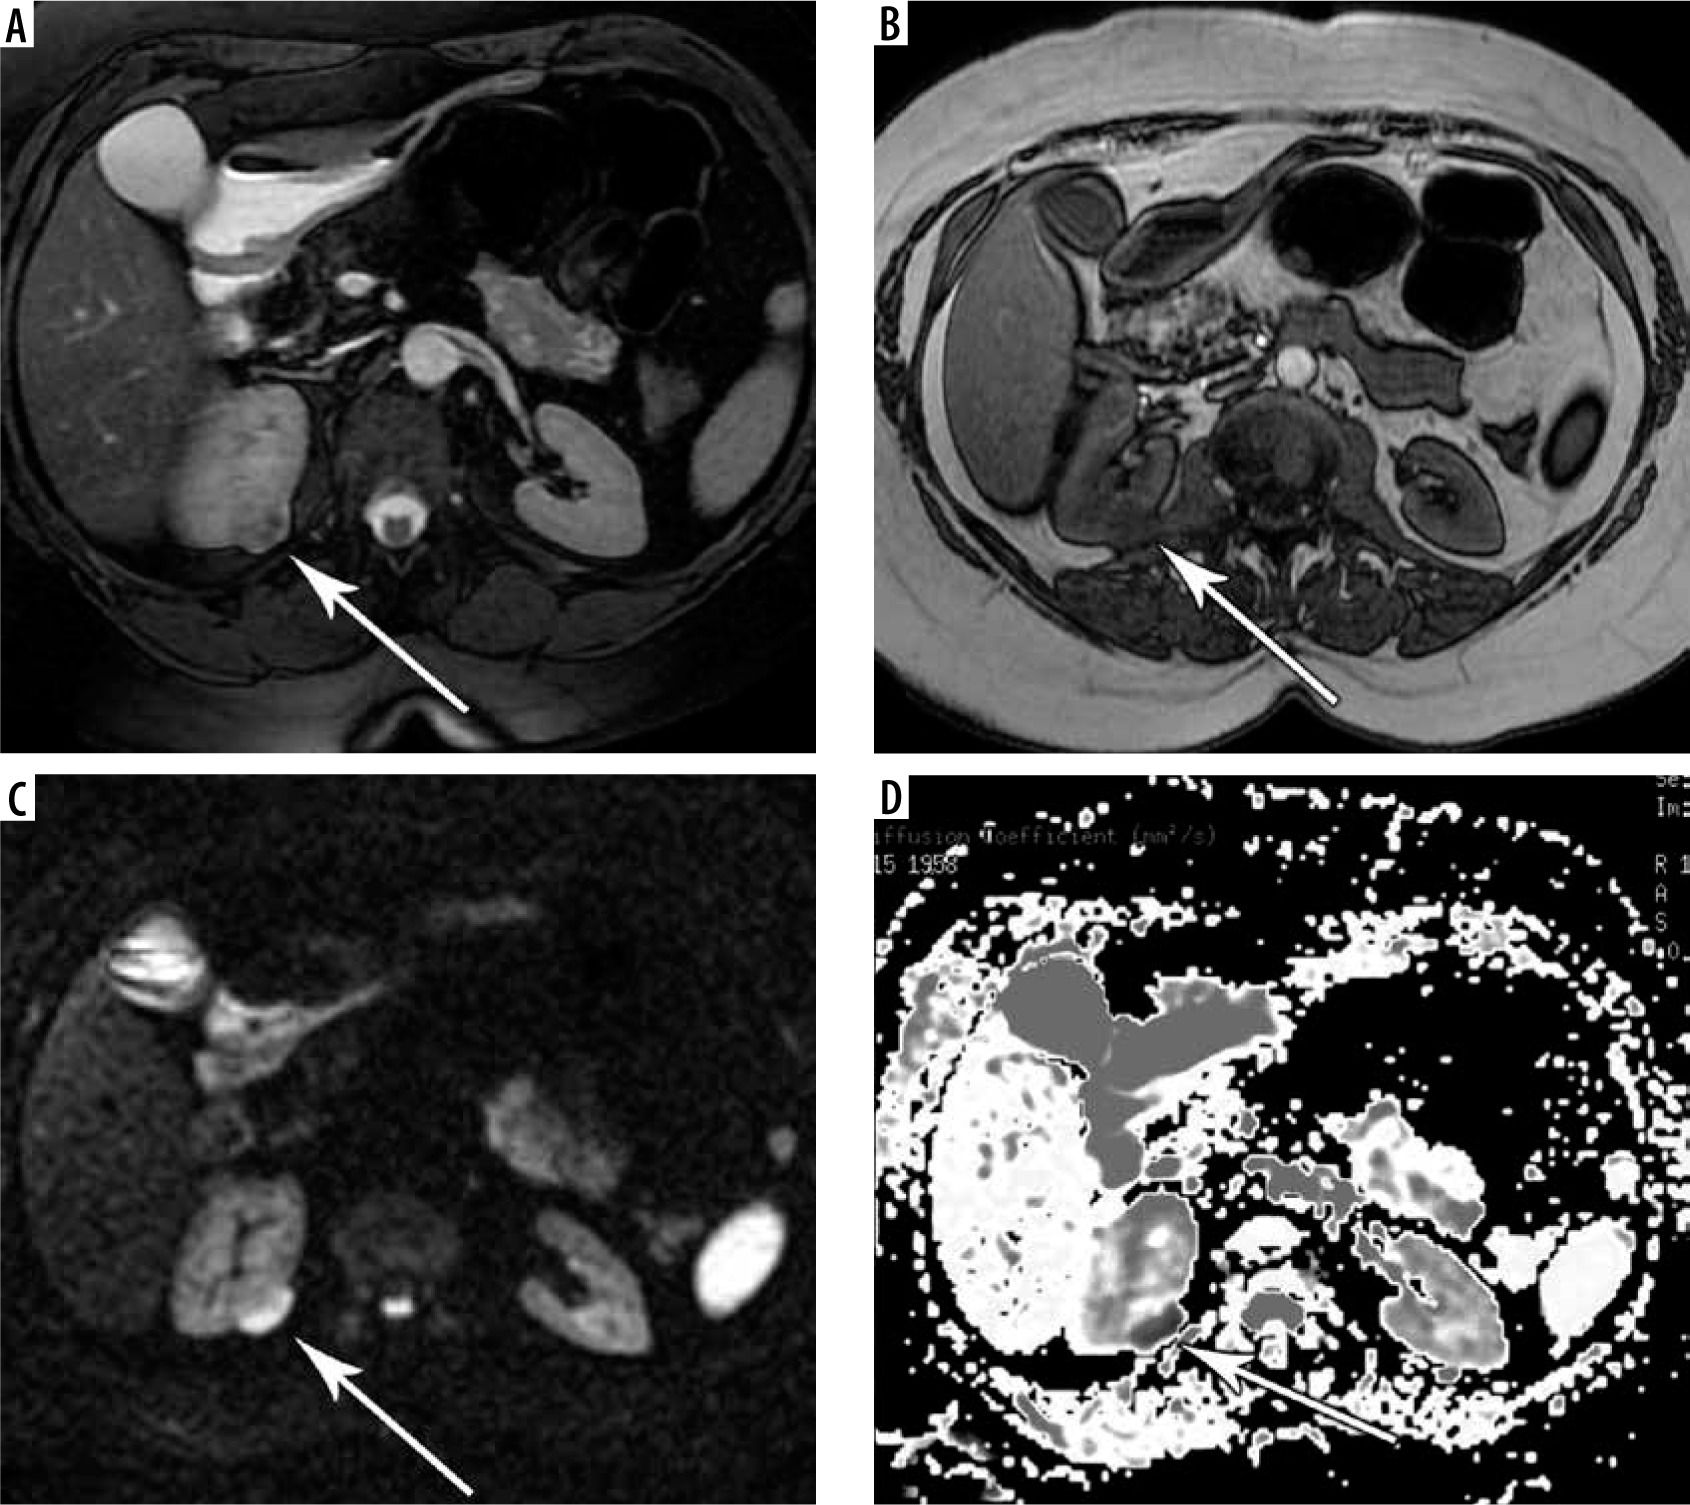
Figure 4
Magnetic resonance imaging data of female patient S., 61 years old, 19 months after partial nephrectomy due to clear cell renal cell carcinoma (RCC) of the lower pole of the left kidney, stage pT1aN0M0, high grade according to Fuhrman system (arrows), axial projections. The increased contrast accumulation was observed in area of postoperative kidney defect as well as the progressive increasement in size of lesion in the region of surgery. A) Axial T2-weighted fast recovery fast spin echo; B) axial dual-echo fast spoiled gradient-echo (FSPGR); C) axial T2-weighted fast recovery fast spin echo; D) axial T1-weighted FSPGR; E) axial diffusion-weighted imaging, in the region of post-op scar of the renal parenchyma there is an area of hyperintensity; F) ADC-map, the value of ADC over the region of post-op kidney defect was 1.67 × 10⁻³ mm2/s. Pathomorphological diagnosis after re-resection of the kidney: recurrent conventional RCC pT1aN0M0, HG according to Fuhrman system
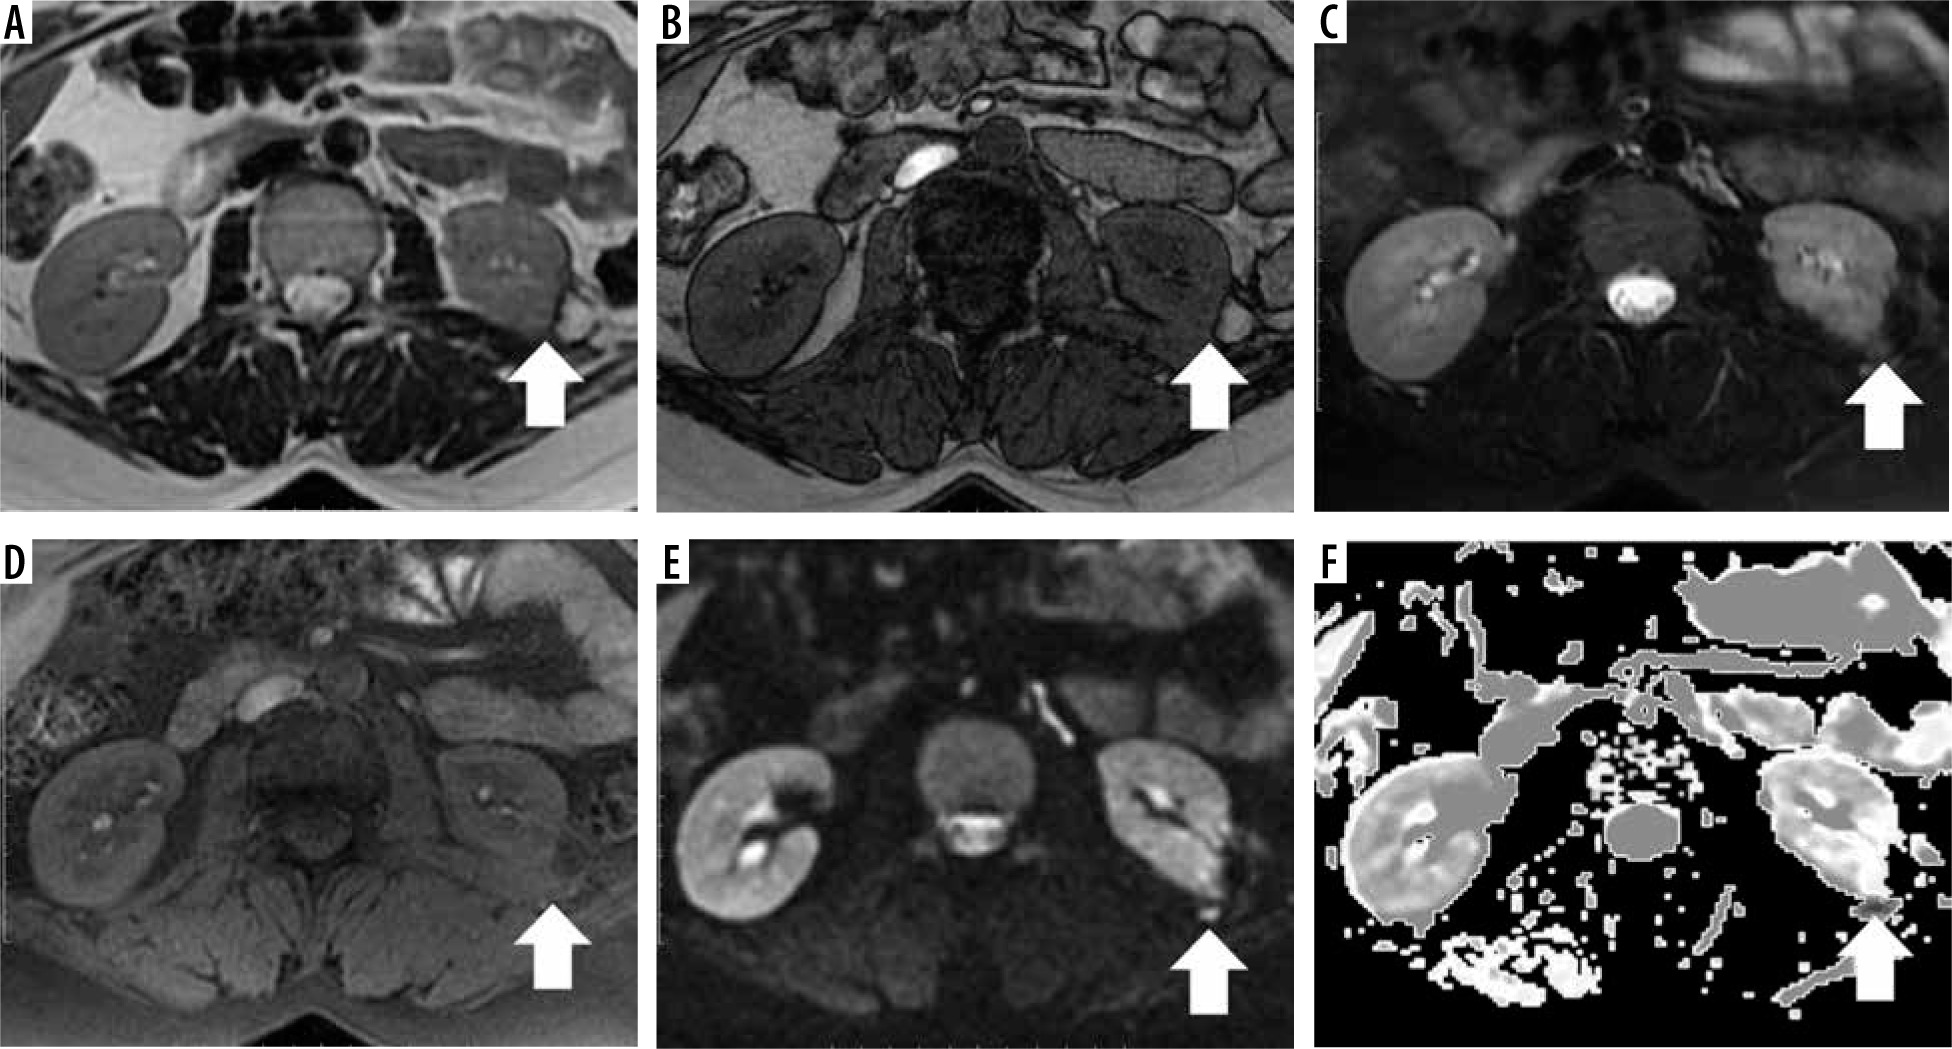
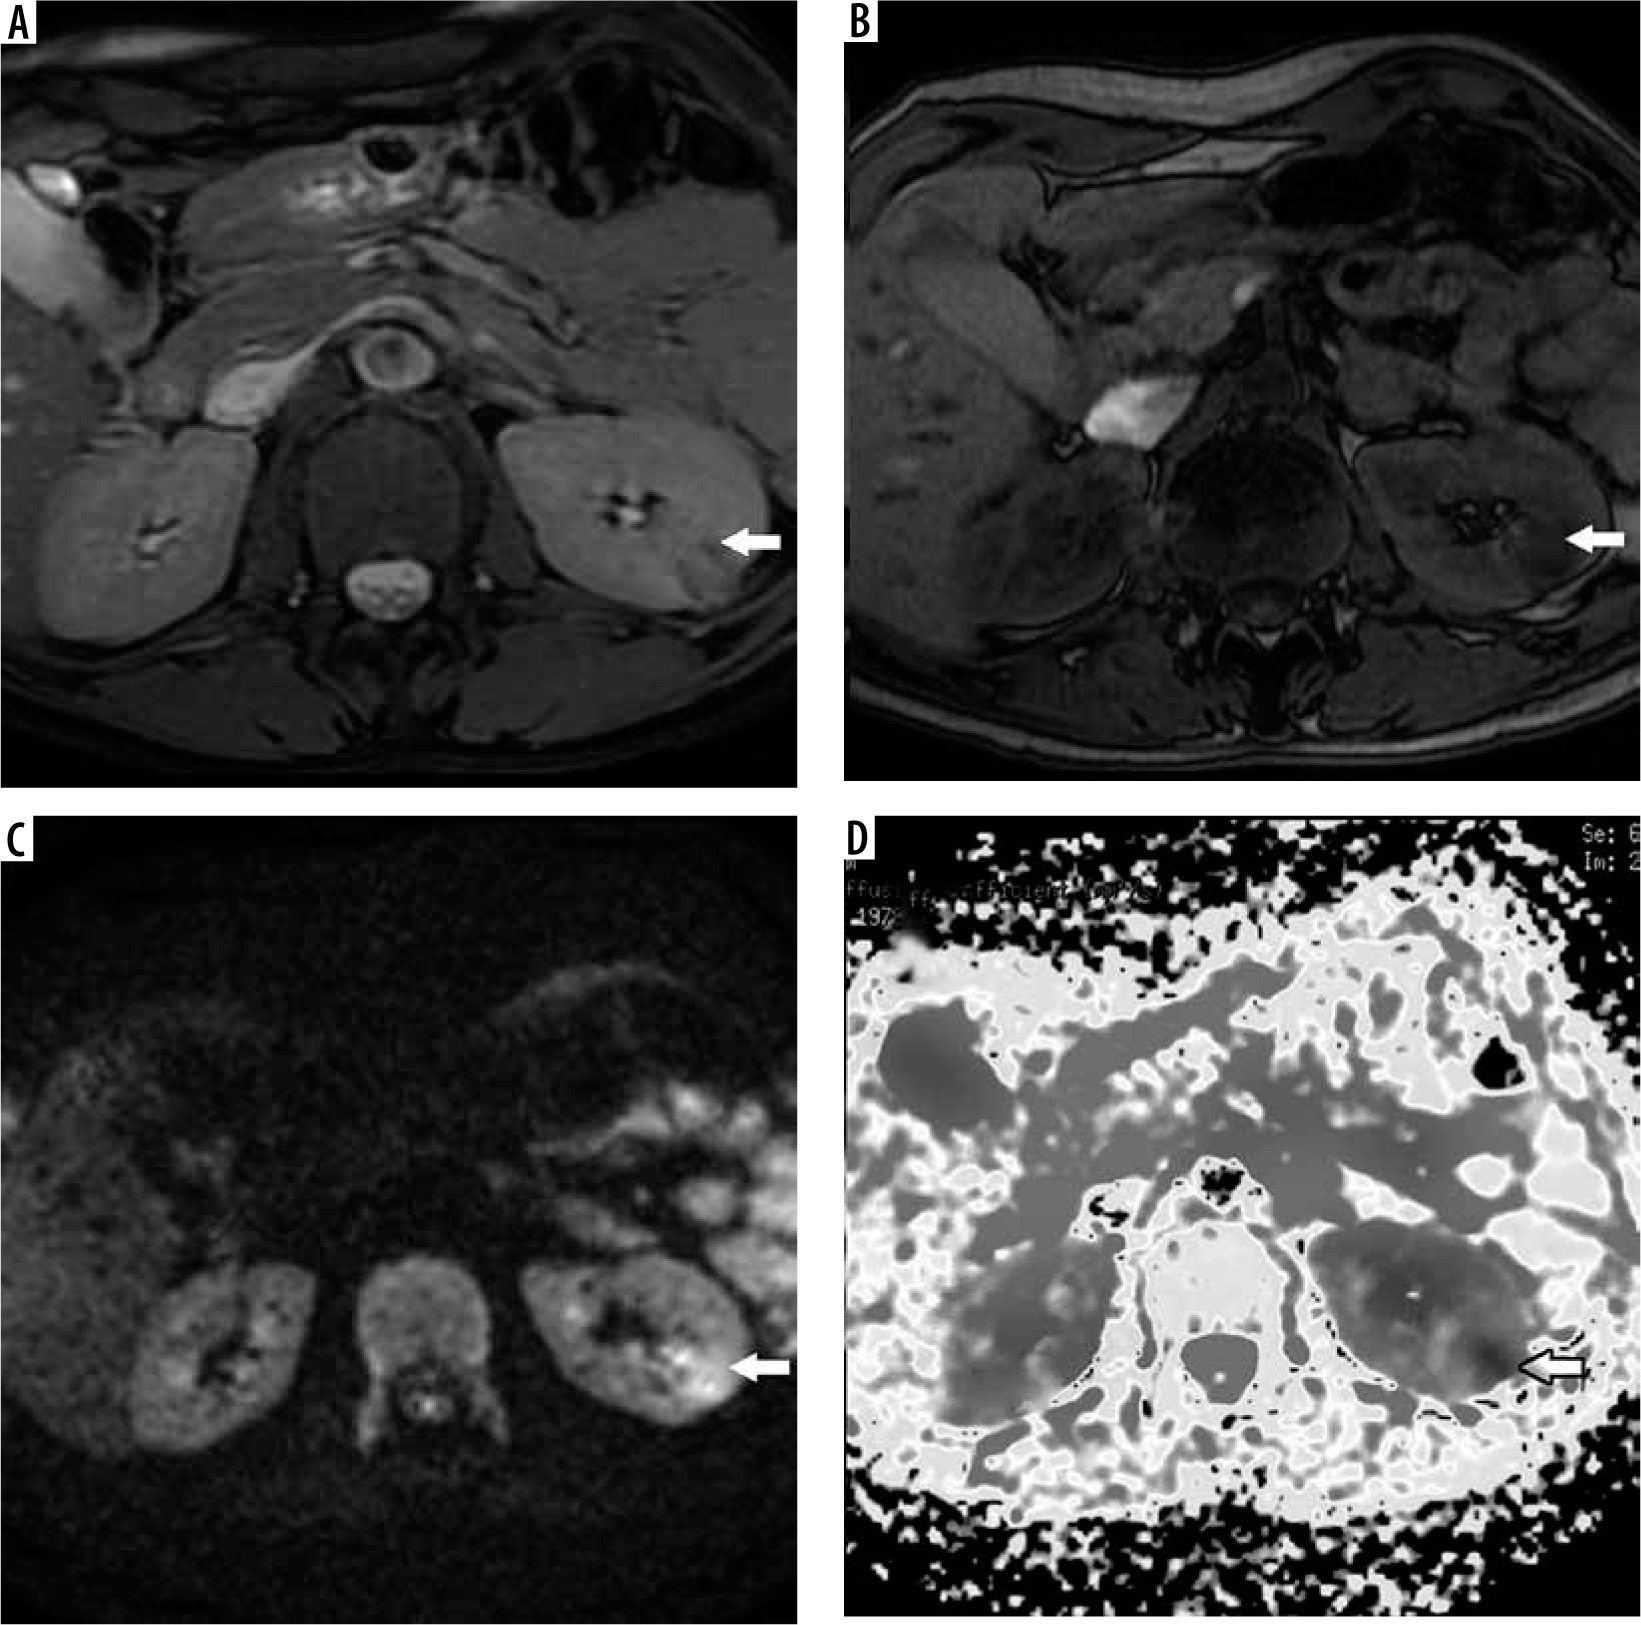
Figure 5
Magnetic resonance imaging (MRI) data of male patient N., 63 years old, 25 months after enucleation of tumour due to clear cell renal cell carcinoma (RCC) of the left kidney, stage pT1aN0M0, low grade according to Fuhrman system (arrows), axial projections, without MRI features of RCC recurrence (no evidence of the expansive enlargement of post-operative renal scar with mild to moderate contrast enhancement and without invasive behaviour). A) Axial T2-weighted fast recovery fast spin echo; B) axial T1-weighted fast spoiled gradient-echo; C) axial diffusion-weighted imaging, in the region of post-op scar of the renal parenchyma there is an area of hyperintensity; D) ADC-map, the value of ADC over the region of post-op kidney defect was 0.81 × 10⁻³ mm2/s
There is a lack of scientific data dedicated to the measurement of ADC at the post-operative site after surgical treatment of RCC with which to directly compare the ADC values achieved in our study. Nevertheless, our results are supported by the investigation of Zhao et al., in which minimal ADC values (the b-value was same as in our study) of histologically verified fibrotic renal medulla were as low as 1.46 mm2/s, which was in the range of ADC values of benign fibrotic post-op changes in our work (from 0.74 to 1.55 × 10⁻³ mm2/s). Moreover, according to Zhao et al., renal ADC values in patients with fibrotic kidney damage demonstrated a significant inverse correlation with the degree of histological fibrosis (R = –0.78, p < 0.05) [23]. A similar tendency (negative ADC correlation with the grade of renal fibrosis/sclerosis) was proven in a more recent paper by Sułkowska et al. [24]. In our study the severity of renal fibrosis was aggravated by post-op changes, which was probably the cause of low ADC values in the comparison group. Of note, our results also match those of El-nasr et al. (b-values of 0, 50, and 850 s/mm2): the mean ADC value of the benign breast lesions (1.2 ± 0.34 × 10⁻³ mm2/s) was statistically higher than that of the post-operative recurrent malignant lesions (0.83 ± 0.15 × 10⁻³ mm2/s), while the mean ADC value in cases of post-op fibrosis was lowest among those subgroups and amounted to 0.77 ± 0.2 × 10⁻³ mm2/s [25].
In the group with local recurrence of RCC, the ADC values were in the range that was obtained in another work, dedicated to investigation of the primary RCC: from 1.31 to 1.98 × 10⁻³ mm2/s. This is a logical observation and indicates the correctness of the proposed me-thod [17]. Earlier Rosenkrantz et al. demonstrated that the mean ADC value of RCC was 1.85±0.40 × 10⁻³ mm2/s (the b-value was the same as in our study), which is in line with our data [26]. The above data indicate that the apparent diffusion coefficient in local recurrence of RCC was within the range of the primary detected tumour, which is understandable because, with the progression of this disease, a change in the histological subtype of the tumour is usually not observed, and often additional sarcomatoid and/or rhabdoid differentiation may appear, which is a poor prognostic factor. At the same time, we did not encounter such changes in our study.
The main limitations of our study are the relatively small number of cases of locally relapsed RCC (and particularly of low grade), a period of follow-up that did not exceed 5 years, and the retrospective nature of the study. Another limitation of our work is the absence of correlation analysis of the enhancement pattern of suspicious renal lesion and ADC value; this should be performed in our next investigation.
Conclusions
It can be argued that the apparent diffusion coefficient of diffusion-weighted images of MRI can be used as potential imaging marker for the diagnosis of local recurrence of RCC, provided it is localized in the renal parenchyma. However, further investigations with more cases are required.