


Introduction
Autosomal dominant polycystic kidney disease (ADPKD) is a well-recognised clinical entity, with a multisystemic phenotype, originating from mutation of polycystin-1 and polycystin-2 encoding genes PKD1 and PKD2 [1]. The disease is believed to be encountered in 1 : 400 to 1 : 1,000 live births [1]. The main clinical presentation of this highly prevalent genetic disorder is the cystic remodelling of the kidneys, leading to progressive deterioration in their function and development of chronic kidney disease (CKD). CKD occurs late in the course of the disease, in typical cases in the fourth to fifth decade of life [1].
Slowing the CKD progression remains the principal clinical concern nowadays. Besides the benefit at the individual level, success in this respect could have an enormous economic impact, as ADPKD constitutes the fourth cause of end-stage renal disease (ESRD) and accounts for 5% to 10% of cases treated with renal replacement therapy (RRT) in Europe alone [2].
The course of the disease, whose diagnosis is typically made much earlier than its complications occur, allowed the implementation of numerous clinical trials intended to slow the progression of this detrimental disease. However, it was found that a significant limitation impacting the recruitment and the performance of those trials is the variability of the disease progression.
The European Medicines Agency (EMEA) in 2017 and Food and Drug Administration (FDA) in April 2018 approved the first specific drug for slowing down the progression of ADPKD – tolvaptan, a vasopressin V2 receptor antagonist [3]. Therefore, accurate monitoring of the disease at its early stages has become even more important than ever before. It is crucial to identify the group of patients with the fastest rate and risk of progression. This particular group will benefit most from the pharmacotherapy.
Diagnosis
The diagnosis of ADPKD is based on positive family history, radiological imaging, and DNA tests in selected cases. The family history is an important step in the diagnostic process. Nevertheless, demographic changes make this parameter less reliable. Also, in up to 10% of cases, a pathogenic variant of the polycystin encoding genes may occur de novo [4]. Genetic testing is not a useful screening tool because it can identify only approximately 70% of the hundreds of different PKD1 and PKD2 mutations [5].
That explains the significant role of radiologic imaging techniques, among which conventional ultrasound is used most frequently for its high diagnostic accuracy, accessibility, and cost-effectiveness.
Ultrasound diagnosis of patients with a known mutation in the PKD1 gene is based on age-dependent Ravine’s criteria (Table 1) [6].
Table 1
Ravine’s criteria [6]
| Number of cysts | ||
|---|---|---|
| Age (years) | Positive family history | Negative family history |
| < 30 | ≥ 2 in one or both kidneys | ≥ 5 |
| 30-59 | ≥ 2 in each kidney | ≥ 5 |
| ≥ 60 | ≥ 4 in each kidney | ≥ 8 |
It is well established that mutation in the PKD2 (about 15% of cases) gene is usually associated with a less severe form of the disease. Therefore, Revine’s criteria cannot be used in these patients (particularly below the age of 30), mainly because of the higher risk of false negative results, which reduces the sensitivity of the test [7].
The majority of patients seen in clinical practice have unknown genotype status. Pei et al. proposed unified diagnostic criteria that can be used regardless of the mutation type (PKD1/PKD2/Unknown) in patients older than 15 years old, with a positive family history of the disease [7]. Currently, these criteria are mainly used in screening (Table 2).
Table 2
Unified ultrasound diagnostic criteria [7]
| Confirmation | Exclusion | ||
|---|---|---|---|
| Age (years) | Number of cysts | Age (years) | Number of cysts |
| 15-39 | ≥ 3 uni- or bi-lateral | 15-39 | Not diagnostic |
| 40-59 | ≥ 2 in each kidney | ≥ 40 | < 2 in each kidney |
| ≥ 60 | ≥ 4 in each kidney | ||
Computed tomography is not routinely used in the diagnosis of ADPKD mainly due to the use of ionizing radiation.
Magnetic resonance imaging is expensive and time-consuming, but due to its excellent spatial resolution, the Working Group PTN recommends the use of non-enhanced magnetic resonance imaging (MRI) sequences in some clinical scenarios [8]. For those subjects who require disease exclusion with high certainty (for example living donors with a positive family history), MRI is recommended for both obtaining a definite diagnosis and disease exclusion. Specifically, among subjects who are at risk of ADPKD ages 15-40 years old, the presence of a total of > 10 renal cysts can be considered as sufficient for diagnosis, while the presence of < 5 cysts precludes the diagnosis [7]. MRI can also be used for a diagnostic purpose in patients with a negative family history of the disease.
Monitoring disease progression
ADPKD is a disease that progresses over the decades until kidney failure finally occurs by the fifth to seventh decade of life in the majority of patients [1]. Serum creatinine level and estimated glomerular filtration rate (eGFR) do not change until the fourth or fifth decade of life in contrast to the kidney volume, which grows continuously, exponentially. Therefore assessment of the disease progression requires determination of the size of kidneys.
According to the Consortium for Radiologic Imaging Studies of Polycystic Kidney Disease (CRISP), MRI derived height-adjusted total kidney volume (ht-TKV) is the best radiological biomarker to assess the severity and risk of progression of renal insufficiency in patients with typical variant of ADPKD [5,9].
In rare, atypical variants of renal cystic remodeling (e.g. unilateral cysts distribution) measurement of ht-TKV is not recommended (Table 3).
Table 3
Radiologic phenotypes of polycystic kidneys classified as atypical variants, type 2 [11]
| Atypical | |
|---|---|
| Focal disease | Parenchymal atrophy |
| Unilateral | Unilateral |
| Asymmetric | Bilateral |
| Segmental | |
| Lop-sided | |
Ultrasonography is the basic diagnostic tool, but it does not allow accurate TKV measurements, underestimating them by 25% [10]. Computed tomography (CT) is just as accurate as MR assessment; however, it cannot be used due to the risk of ionising radiation in a long-term follow-up.
Irazabal et al. proposed to associate the ht-TKV with the age of patients [11]. This allowed assignment of the class 1 study participants into one of the five subclasses (1A-1E) characterised by the increasing rate of ht-TKV accretion in time. This classification allows us to predict the course of the disease and thus define the subgroup of patients most at risk of rapid progression to ESRD. The estimated frequency of ESRD at ten years increased from A to E (2.4%, 11.0%, 37.8%, 47.1%, and 66.9%, respectively). The classification is easily available on the Mayo Clinic Rochester, Minnesota, USA website [12].
There exists a wide range of urinary tract complications in ADPKD including infections, intracystic bleeding, lithiasis and cyst rupture resulting in retroperitoneal haemorrhage. A crucial task of imaging diagnostics is to differentiate these conditions and enable doctors to apply appropriate causal treatment accurately.
Complex cysts represent haemorrhage, infection, or malignancy. Hemorrhagic cysts are hyperechoic on the US, hyperdense on CT imaging, and hyperintense on the T1 MRI sequence. It can be challenging to determine if a complex cyst contains blood or proteinaceous fluid even in a non-enhanced MRI examination. Both entities are hyperintense on the T1 sequence and hypointense on the T2 sequence or bright on both series. They do not show enhancement after gadolinium administration and disappear on the subtracted images [13].
Infected cysts show an increase of intensity on DWI, fluid-fluid levels or wall thickening. Also gas within the cyst is an indicator of infection [14].
Another challenge is how to distinguish between focal lesions and a complex cyst. The Bosniak CT-based scale can be helpful, but the intravenous administration of a potentially nephrotoxic iodine contrast medium is usually contraindicated. MRI findings related to RCC are a heterogeneous mass of low-to-intermediate signal on T1-weighted images that increases in signal intensity on T2-weighted images and intense enhancement after injection of gadolinium. However, we have to remember the risk of nephrogenic systemic fibrosis associated with the use of gadolinium.
Total kidney volume measurements
Gold standard: manual tracing/stereology method (sTKV)
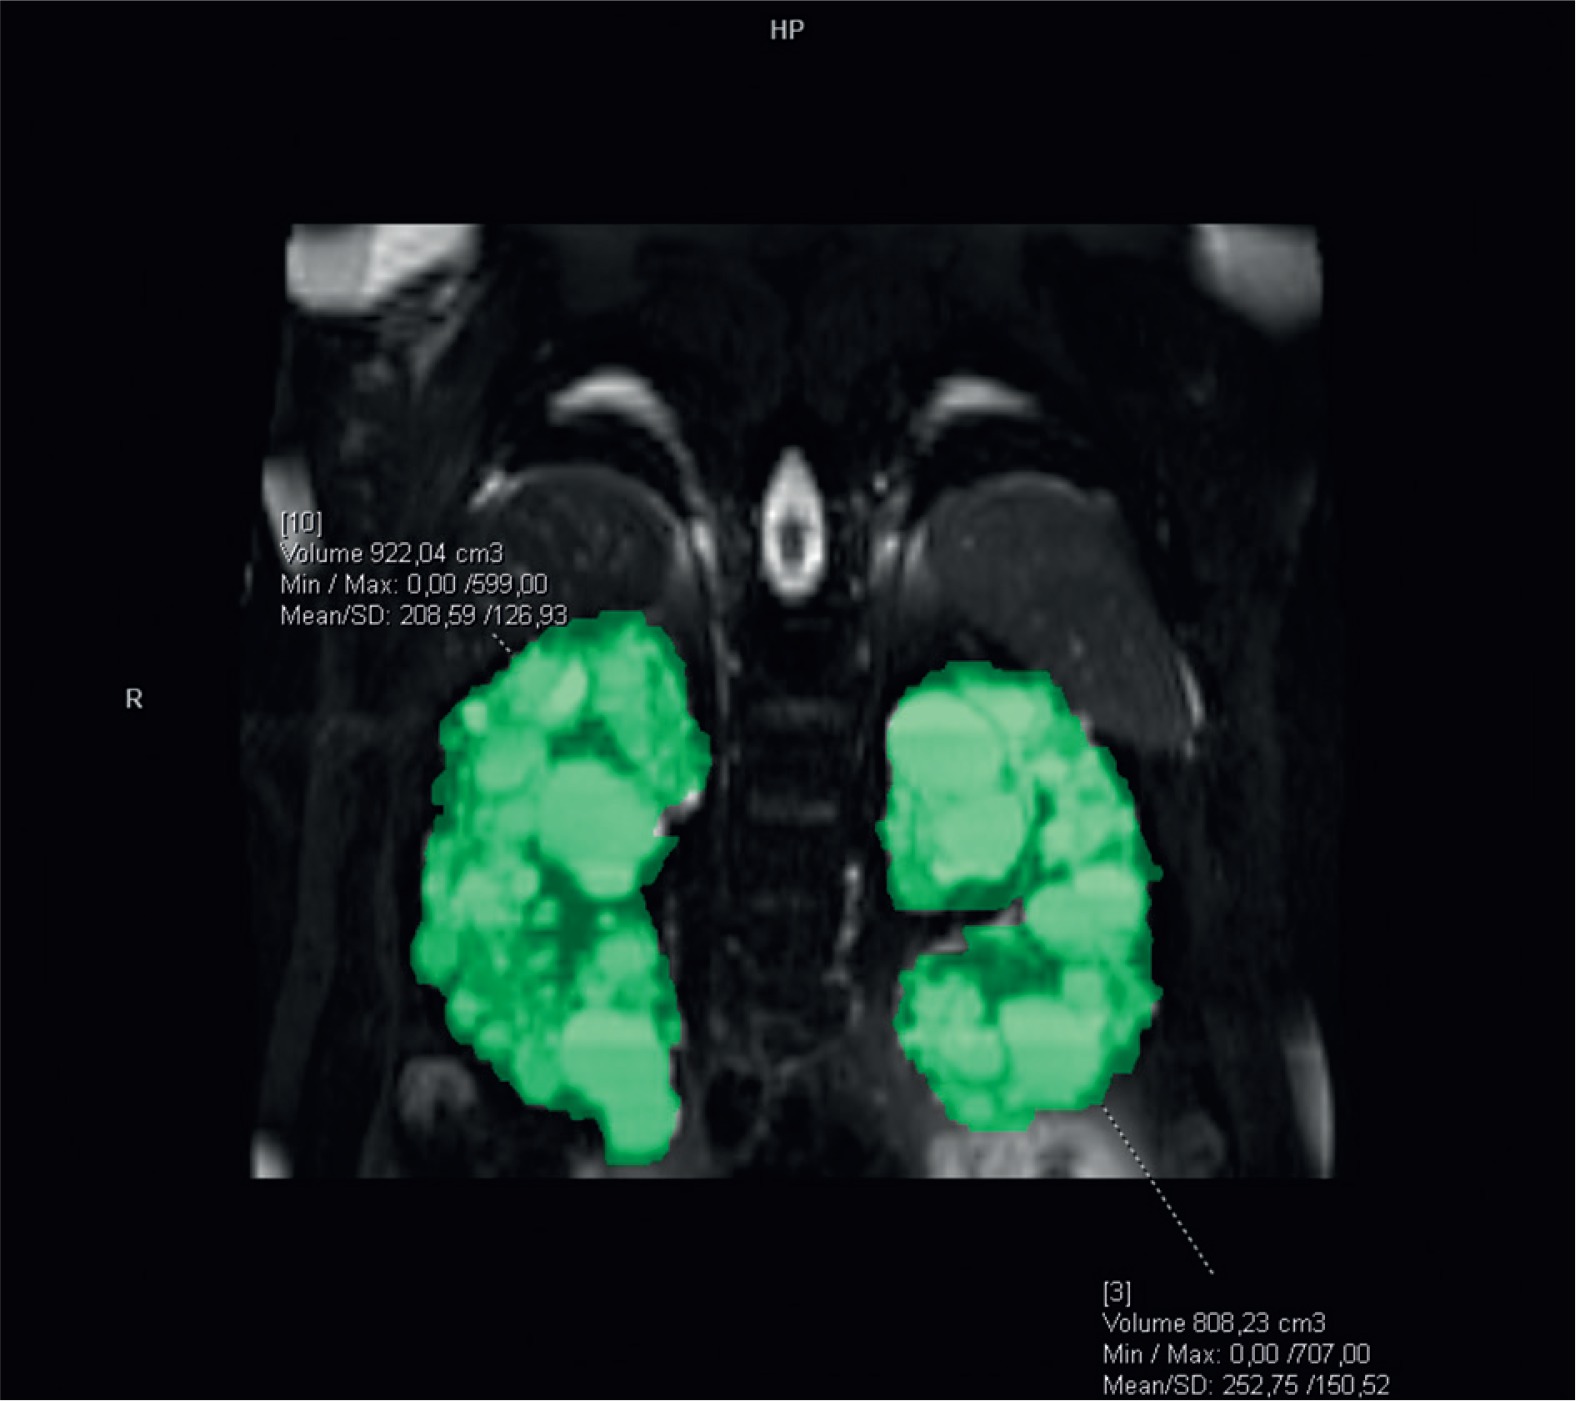
The gold standard method to assess TKV is the manual tracing method. Kidney volumes should be measured on the coronal fat, saturated T2-sequence images. Kidney boundaries are manually traced using the commercially available software. Kidney volume is calculated from the set of contiguous images by summing the products of the area measurements within the kidney multiplied by the slice thickness (Figure 1). Nonrenal parenchyma (renal hilus) should be excluded from the analysis. Assessment of sTKV is time-consuming and needs specific software, which limits its applicability for clinical care [15].
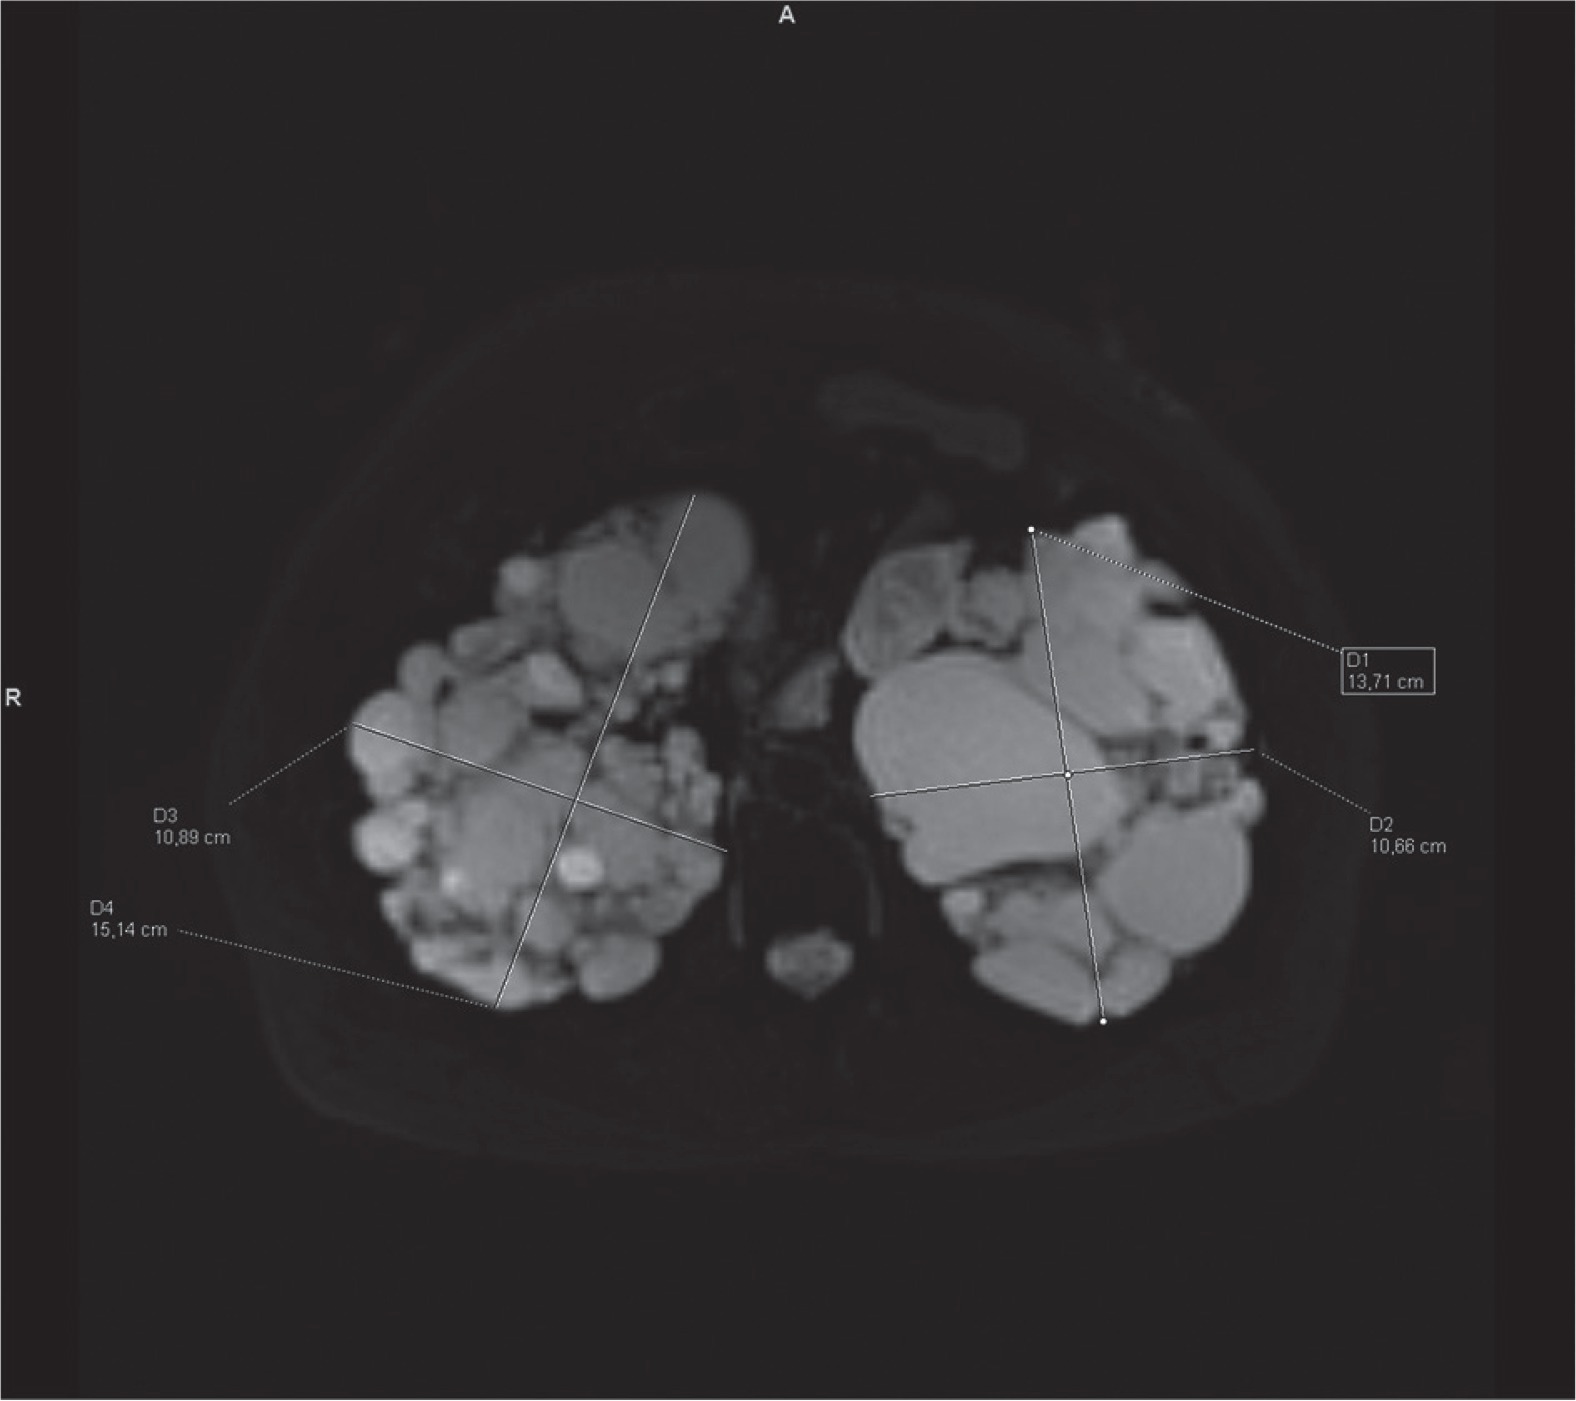
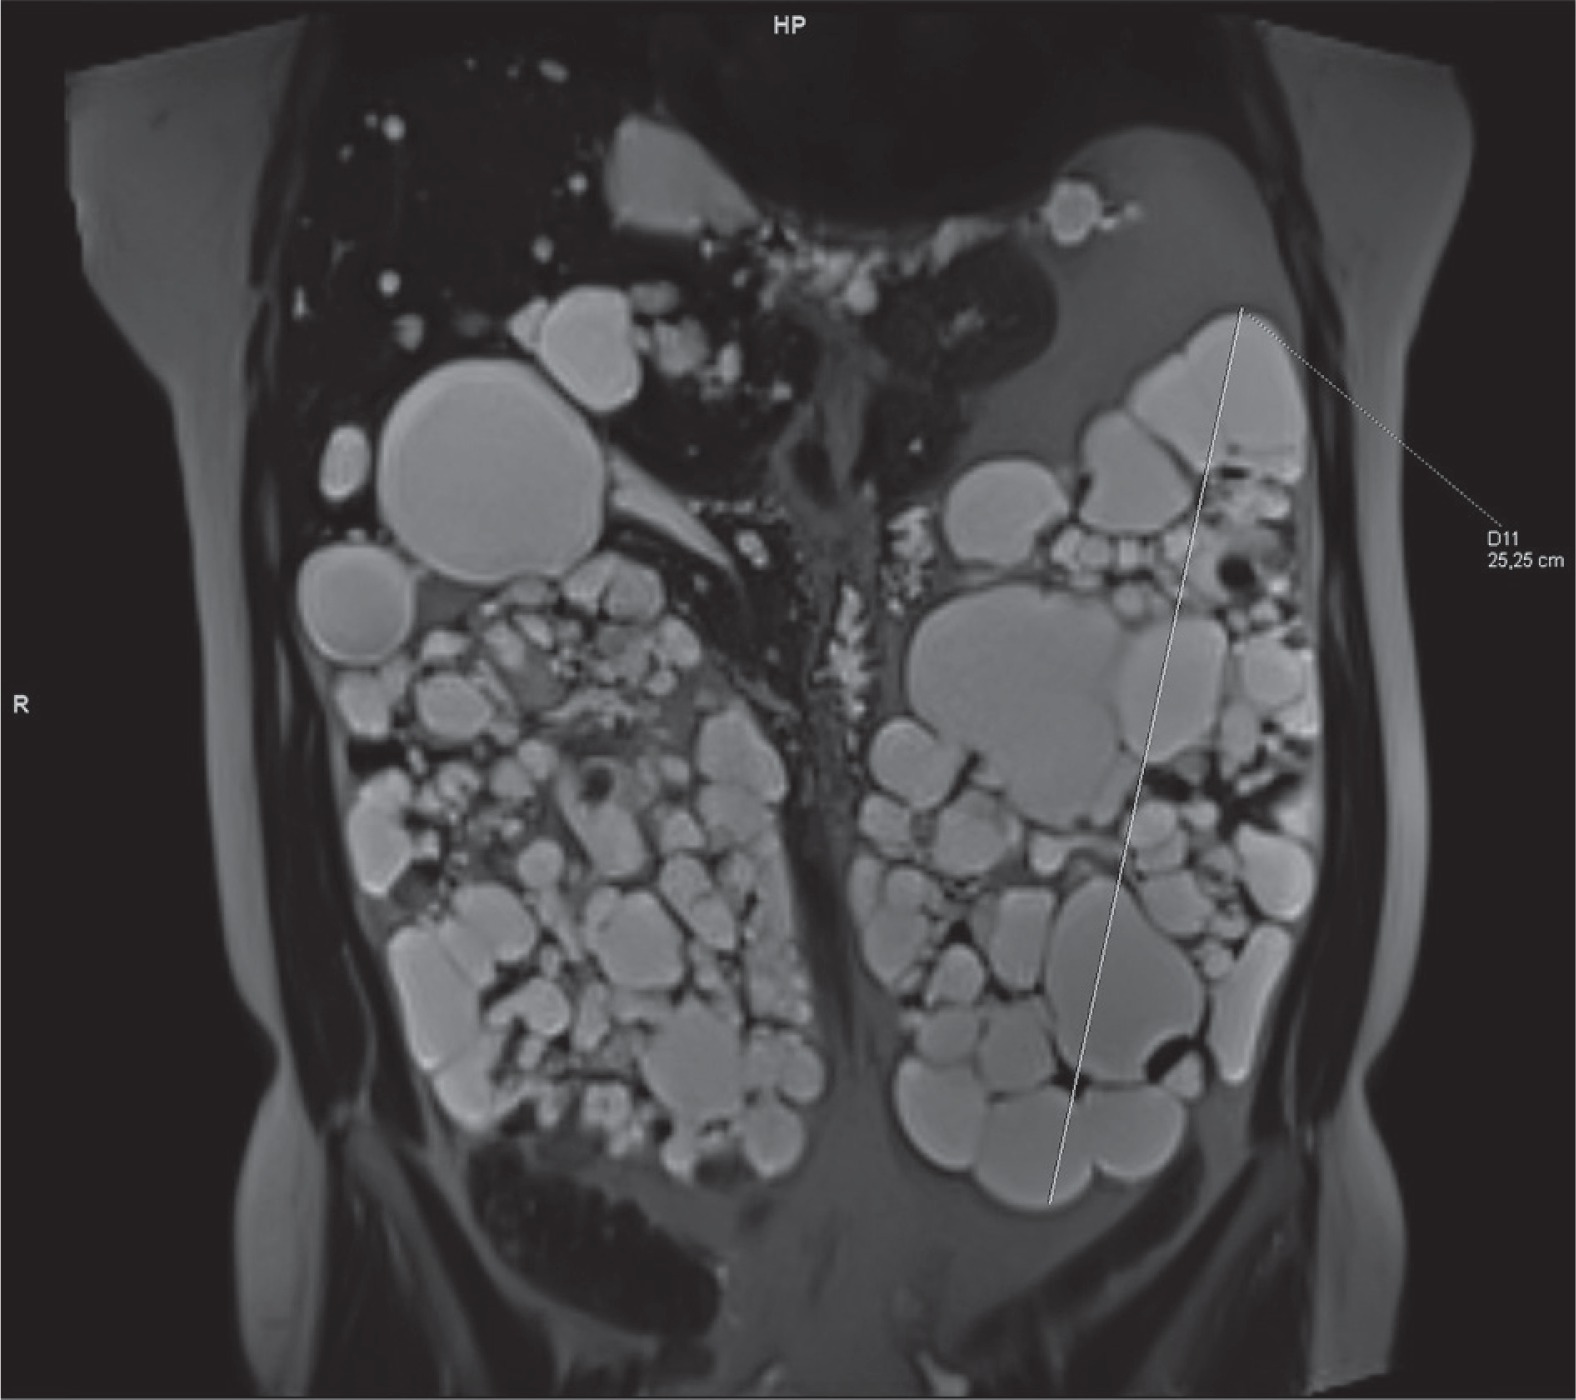
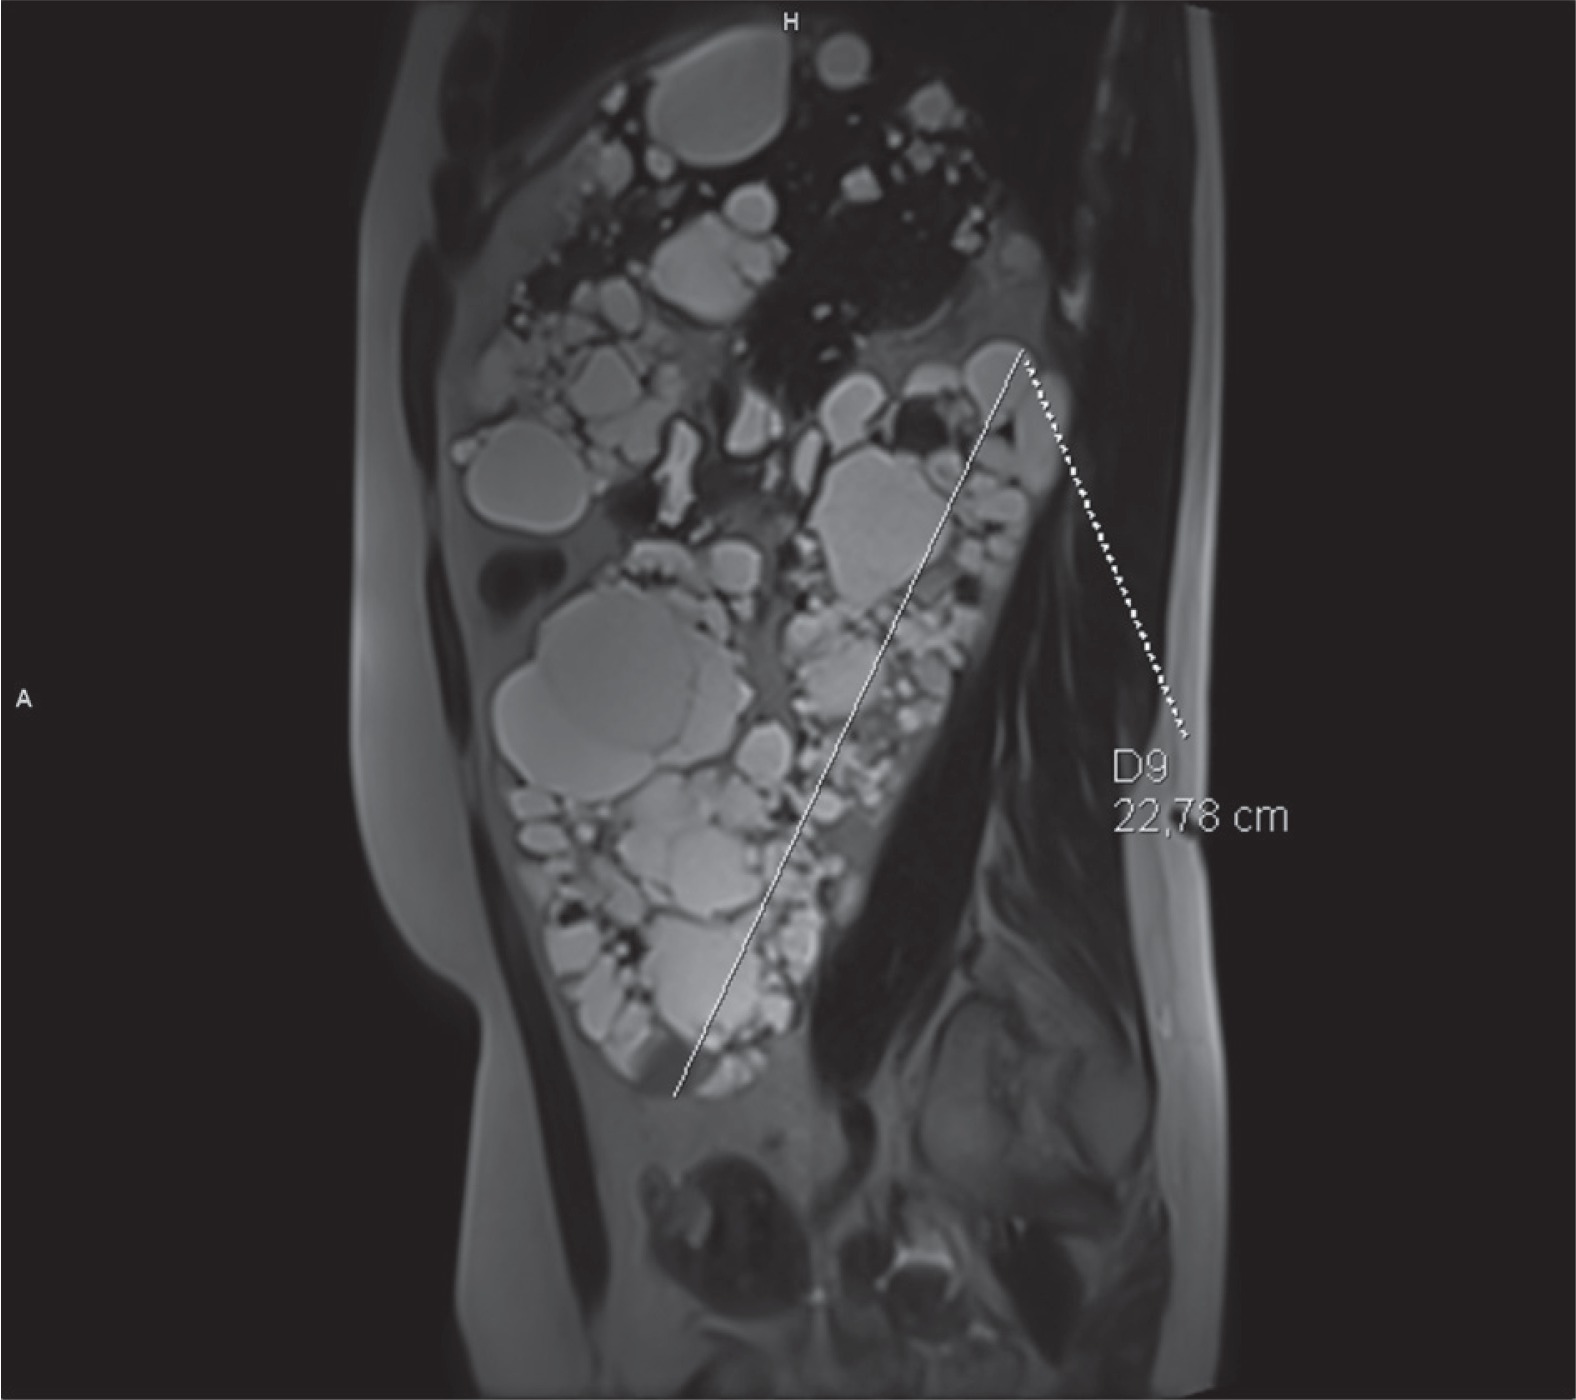
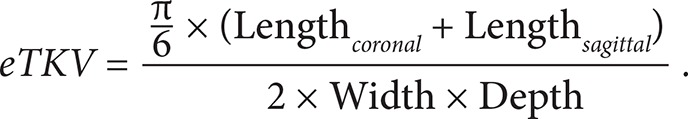
Estimated ellipsoid method (eTKV)
In clinical practice, the ellipsoid method is mainly used. eTKV correlates strongly with sTKV, without systematic underestimation and overestimation. The average time needed to measure sTKV was 45 minutes, compared with 7 minutes for eTKV [11]. For each kidney, the length is measured as the average maximal longitudinal diameter measured in the coronal and sagittal plane (fat-saturated T2-sequence). Width is obtained from the transversal image at maximum transversal diameter, and depth is measured from the same image perpendicular to the width measurement (Figures 2-4). The eTKV ellipsoid is calculated as the sum of the left eTKV and right KV, both derived by the equation [15]:
Estimated midslice method (mTKV)
To estimate mTKV mid slice (half the sum of numbers of the first and last slice that contains the kidney) of the coronal fat saturated T2-sequence should be selected separately for each kidney. mTKV is calculated as the sum of the mTKV of the right and left kidney from the equation [15]:
Semiautomated/automated method (sa/aTKV): shape or boundary automatic/semiautomated detection, usage of specific software is necessary
To sum up: mainly the ellipsoid method is used in clinical practice because it is fast and accurate compared to manual tracking TKV, and no specific software is necessary.
Recommendations of the Working Group and ADPKD guidelines
Several national and international initiatives released recommendations and guidelines on ADPKD imaging approaches and diagnosis. Among the most recent (February 2019) are recommendations of the Working Group of PTN [8]. They are summarized in Table 4.
Table 4
Recommendations for ADPKD imaging approaches in Poland
Quantitative MRI sequences
Quantitative MRI sequences are new, promising biomarkers. They could provide a more accurate and earlier assessment of renal diseases and enable quicker interventions to stop or slow down function decline.
Therefore, quantitative techniques that can add to the assessment of renal structure are needed.
According to the study “Quantitative MRI of kidneys in renal disease” quantitative techniques have shown relevant structural and functional changes in the ADPKD kidneys compared to healthy controls [14]. The following quantitative MR imaging sequences were found to be significant:
blood-oxygen-level-dependent imaging (BOLD),
diffusion-weighted imaging (DWI),
magnetic resonance elastography (MRE),
magnetisation transfer imaging (MTR).
In the study mentioned above, in the group of patients with an early stage of ADPKD, the researchers found a reduction in the BOLD parameter (R2*) which suggests tissue alteration possibly resulting from decreased vascular density or changes in tissue viability. With DWI they found a reduction in the pseudo-diffusion component as well as a reduction in the derived perfusion fraction, which is evidence for changes in vascular structure and function. With MRE they found a reduction in tissue stiffness.
Diagnostic information can also be elicited from the image texture. Although there is no strict definition of the image texture, it is easily perceived by human eyes. Image texture refers to the appearance, structure, and arrangement of different intensity levels within an image [16]. Voxels in the image are perceived to exhibit specific brightness, colour, roughness, directionality, randomness, smoothness, grain, uniformity, and density. In the medical sense, texture describes the micro- and macro-structure and three-dimensional shape of the selected organ [16]. To obtain information about tissue properties precisely defined parameters (texture features) are needed. For example, the texture feature entropy measures the degree of disorder within the kidney. Thus kidneys with seemingly random cyst distributions will have a higher entropy value [17]. According to the study “Image texture features predict a decrease in renal function in patients with autosomal dominant polycystic kidney disease” texture characteristics may explain differences in the rate of progression in different phenotypes of kidneys [17]. Individual texture features were found to predict subsequent renal function decline. These features characterised factors such as the degree of disorder within the kidney, differences in cyst size and number, and whether the kidneys were composed of many similar-appearing regions to differentiate the patients [17].
Diffusion tensor imaging (DTI) gives us much information about water motion along axes fitted to a symmetric matrix, named diffusion tensor, resulting in a 3D model. Fractional anisotropy (FA) is a value scaled from 0 (no preferred diffusion direction calculated) to 1 (strong directionality of the tensor in one direction), which measures the diffusion anisotropy. By use of a tensor, it is possible to calculate a 3D model, which represents the diffusion directions with lines called tracts [18]. According to the study “3 Tesla-diffusion tensor imaging in autosomal dominant polycystic kidney disease: the nephrologist’s point of view” parenchymal FA was significantly lower, and ADC was higher among ADPKD patients. 3T-DTI seems to be a promising tool that could be used to evaluate ADPKD patients, detecting early structure changes [19]. It is likely that the combination of texture feature analysis with current biomarkers will improve personalised clinical decision making in ADPKD.
Arterial spin labelling (ASL) is an MRI method for measuring perfusion using the patient’s water molecules as tracers. ASL offers the opportunity to characterise renal perfusion and could inform on changes in vascular geometry and restrictions in regional kidney blood flow [20].
These new MR quantitative techniques should be further explored.
Conclusions
At the early stages of ADPKD typical markers of severity and progression of the disease remain unchanged, in contrast to the TKV, which increases continuously in an exponential way. Therefore, the use of MRI ht-TKV as a biomarker should become a more accessible diagnostic option. Disease course varies widely among patients with ADPKD, so it is crucial to identify the group of patients with the fastest rate and risk of progression. This particular group of patients will benefit most from pharmacotherapy and they are the best candidates for clinical trials. Also, quantitative MRI techniques are promising biomarkers for ADPKD evaluation and could provide additional insights into the course of the disease. More extensive studies are still needed to evaluate quantitative MRI techniques further to assess their usefulness in clinical decision making.
Slowing down the progression of the disease is not only crucial for the patient as an individual but is also strongly economically justified. However, this could not be attained without a reliable imaging approach.