


Introduction
Fibrous dysplasia (FD) is a tumour-like benign condition of bone [1]. Histologically, normal lamellar bone is replaced by immature and functionally inferior woven bone and fibrous tissue [1]. While any bone may be affected, craniofacial bones are affected in 15-30% of monostotic FD and almost all patients with polyostotic FD [2]. Fibrous dysplasia involving the skull and facial bones is also termed craniofacial fibrous dysplasia (CFD).
The clinical presentation of patients with FD depends on lesion localisation and is often unspecific. Common symptoms are swelling, deformity, and asymmetry or pain [3]. CFD is often associated with visual and acoustic disorders or symptoms as in sinusitis [4]. However, a great number of FD lesions are asymptomatic and detected incidentally [1]. Therefore, the true incidence of FD is unknown [1]. Available data suggest that FD accounts for approximately 2.5% of all bone tumours and approximately 10% of all benign bone lesions [5]. Hence, it has been proposed that FD is the most common tumour-like condition of the bone [1]. Computed tomography (CT) is currently regarded as the modality of choice for diagnosing FD [6], offering advantages in the evaluation of cortical changes, which are displayed without superposition. A characteristic CT sign is the ground glass appearance [6]. Ground glass areas show a homogeneous greyish appearance due to the presence of woven bone components with a variable amount of mineralisation. The magnetic resonance imaging (MRI) appearance of CFD lesions has only been reported in small study populations, and investigators have not specifically addressed the ground glass phenomenon [7].
As more and more MRI examinations are performed, reliable detection and diagnosis of CFD lesions by MRI becomes important as well. Meningiomas can infiltrate adjacent structures and induce hyperostosis in bone to a variable extent [8]. Meningioma-associated hyperostosis can be mistaken for the sclerotic form of FD and is thus considered a relevant differential diagnosis [6]. Reports of patients with intraosseous meningioma initially misdiagnosed as CFD are available, all of them with ground glass phenomenon in CT and no soft tissue component [9]. The purpose of our study was therefore first to assess how accurately CFD can be detected using MRI. Secondly, we evaluated the morphological MRI features in terms of their usefulness for diagnosing and differentiating CFD lesions from intraosseous meningioma. Thirdly, the MRI appearance of the ground glass phenomenon, a characteristic CT feature of CFD, was evaluated.
Material and methods
This retrospective study was approved by the Institutional Review Board (IRB; EA1/205/14) and was conducted in accordance with the ethical standards of the institutional and national research committee and with the 1964 Helsinki Declaration and its later amendments.
A retrospective search of the institutional database was performed to identify patients with CFD, who underwent both CT and MRI. In all patients, the diagnosis of CFD was based on at least one of the following criteria: positive histopathological finding, positive G-nucleotide binding protein alpha sub unit (GNAS) mutation analysis, and characteristic CT morphology. Patients with negative histopathological or GNAS mutation analysis, or imaging findings suggesting a different pathology were excluded. The CT datasets were acquired on eight different CT scanners with slice thicknesses between 1 and 2 mm. MRI datasets were acquired on six different MR scanners using slice thicknesses between 3 and 6 mm.
To evaluate the detectability of CFD lesions in MRI, 10 randomly chosen datasets of the head with CFD and 10 normal controls were presented in random order to two radiologists who were blinded to the clinical data. Sensitivity and specificity, and positive (PPV) and negative predictive value (NPV) for detection of CFD were calculated.
The following morphological characteristics of bone changes were analysed: bone deformity, cortical changes, internal lesion structure in T1-weighted (T1w) and T2-weighted (T2w) sequences, signal intensity of the lesion (compared to skeletal muscle), and enhancement after intravenous administration of Gadolinium-based contrast medium. The latter three features were additionally used to specifically analyse areas showing the ground glass phenomenon on CT scans.
To evaluate the diagnostic potential of the morphological changes, 10 cases of histologically proven intraosseous meningioma were included from our database [6].
All images were analysed by two radiologists with > 4 and > 10 years of experience in skeletal imaging in consensus. They were blinded to clinical data. The frequency of qualitative findings was expressed as numbers and percentages.
Statistical analysis
Statistical analysis was performed with R (R Development Core Team 2008. R: A language and environment for statistical computing. R Foundation for Statistical Computing, Vienna, Austria. www.R-project.org.). Due to the small sample size, normal distribution of data was not assumed and descriptives are given as median, interquartile range (IQR, 25th-75th percentile) and range (minimum-maximum). The unpaired Mann-Whitney-U test was used to compare metric values between CFD and intraosseous meningioma patients. The association of one metric parameter and one dichotomous variable was analysed using receiver operating characteristic (ROC) curve, and the Youden index was used for determination of the optimal threshold. Morphological changes were tested for sensitivity, specificity, PPV, and NPV using univariate logistic regression analysis. All tests were two-sided, and a p-value of < 0.05 was considered to indicate statistically significant differences.
Results
Patients with craniofacial fibrous dysplasia
The 32 patients (21 female) with CFD included in the study had a mean age of 41.5 ± 20.7 years (range 6-80 years). A total of 36 lesions were detected in craniofacial bones: 20 lesions in the base of the skull, 13 in the calvaria, two in the maxilla, and one in the mandible. Mean lesion size measured in MRI was 56 ± 27 mm (range 18-120 mm).
Controls and detectability
The 10 control cases (five female) included had a mean age of 50.1 years (range 18-85 years). Both readers identified the FD lesions vs. controls with a sensitivity, specificity, PPV, NPV, and accuracy of 100% in MRI.
Magnetic resonance morphology of craniofacial fibrous dysplasia
The affected bone was broadened in all 36 cases of CFD – examples for illustration of this finding are shown in Figures 1 and 2. In three cases, the cortex could not be evaluated by MRI due to large slice thickness and resulting low image quality. In the remaining 33 cases, the cortex was thinned in 93.9% (31/33) and thickened in 3.0% (1/33). In one case, the cortex showed mixed areas of thickening and thinning. Cystic changes were detected in 44.4% of the lesions (16/36). Examples given in Figures 1 and 3 also show the expansive growth of CFD with displacement of adjacent soft tissue, which was observed in 30.5% (11/36) of the lesions. The differential diagnosis of intraosseous meningioma is displayed in Figure 4.
Figure 1
67-year-old female with craniofacial fibrous dysplasia of the right sphenoid bone (arrow) and sinus. A) A transverse section of the computed tomography dataset in the bone window (window width 1700 HU, center 350 HU). B) A coronal T1w image is shown with iso- to hypointense appearance of the fibrous dysplasia lesion (TE 11 ms, TR 714 ms). C) A coronal T2w image (TE 103 ms, TR 4000 ms) the heterogeneous, mainly hyperintense T2w presentation is shown. Postcontrast images (14 ml gadoter acid) in (D) and subtraction in (E) as well as transverse GRE images (VIBE, TE 2.38 ms, TR 9 ms) in (F) show heterogeneous contrast enhancement. Small areas of ground glass phenomenon are indicated by an asterisk in (A), (C), and (E)
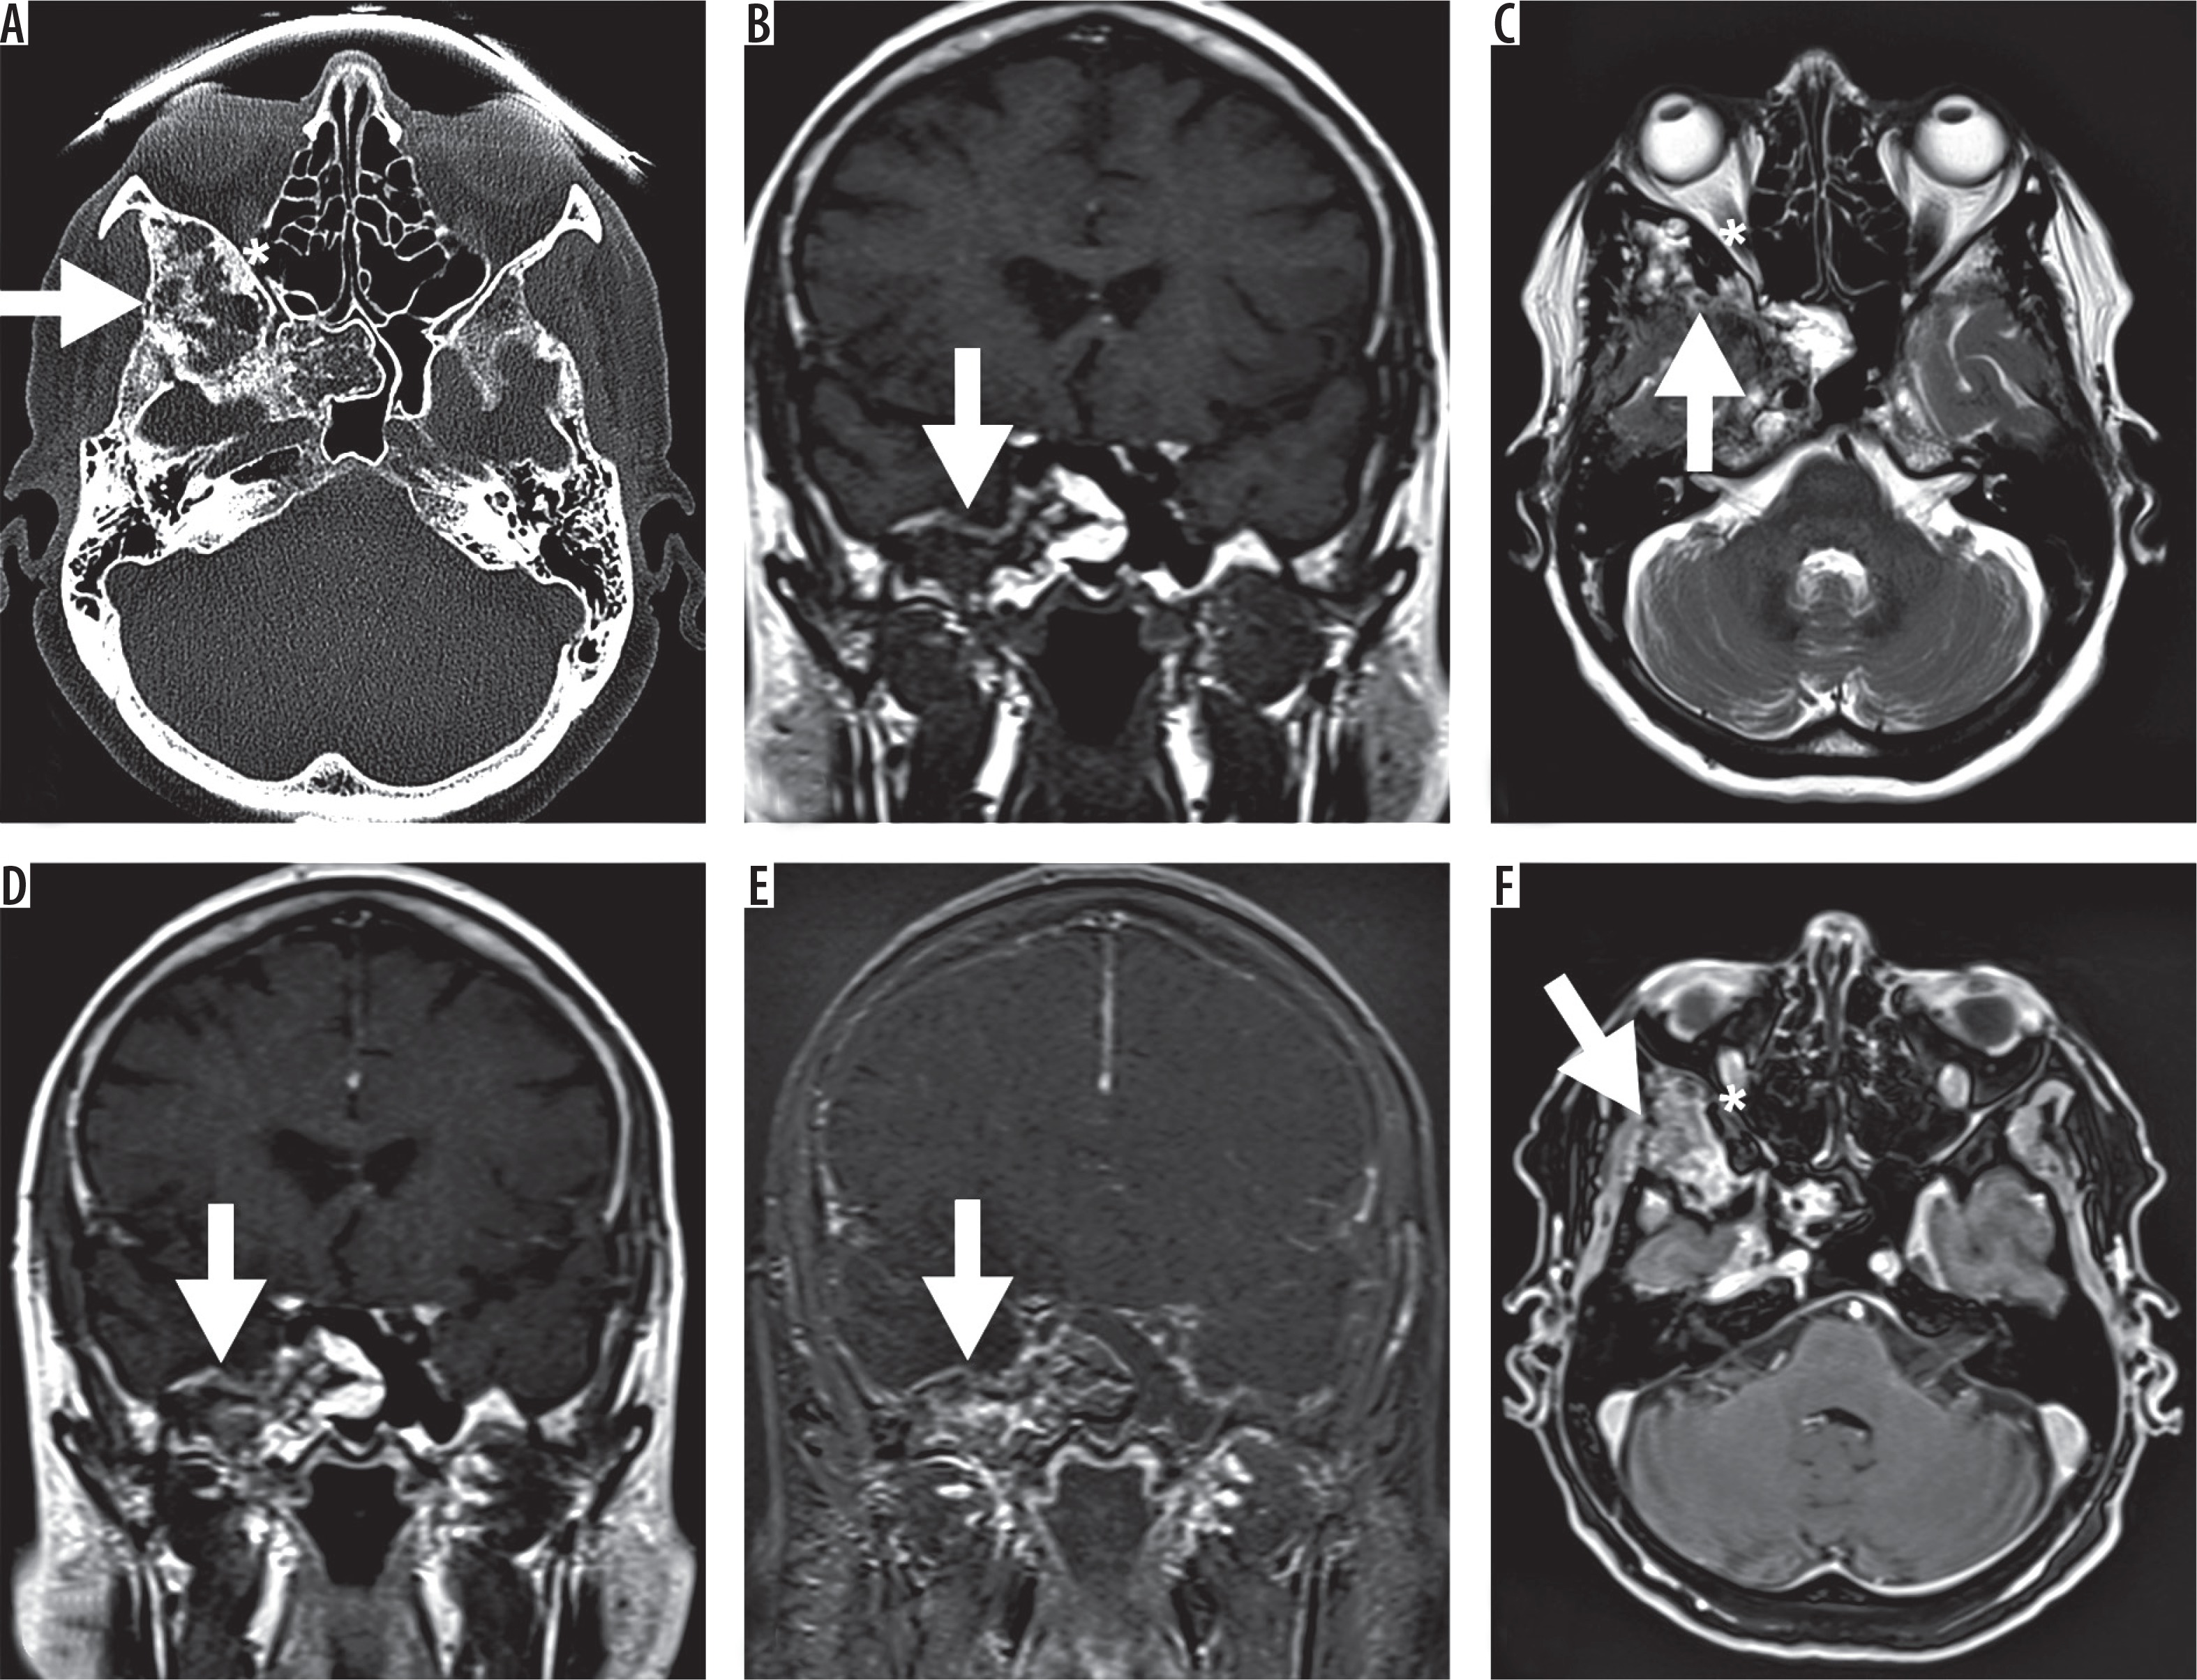
Figure 2
Histologically proven craniofacial fibrous dysplasia (CFD) of the left maxillary bone in a 57-year-old male patient. A) A transverse section of the computed tomography dataset in the bone window (window width 1700 HU, centre 350 HU) showing bone broadening, cortical thinning, and the ground glass phenomenon. B) A corresponding slice of the T2w magnetic resonance imaging examination is shown (TE 120 ms, TR 4900 ms, 3 mm slice thickness) with heterogeneous, predominantly hypointense appearance of the CFD lesion. The area of ground glass phenomenon, however, appears homogeneously structured. Figure 2 shows T1w images (TE 12 ms, TR 500 ms) before (C) and after (D) administration of 15 ml gadopentetate dimeglumine without signal enhancement. Subtraction images cannot be provided due to the use of different imaging matrices. Therefore, additional T1w images with fat saturation in coronal view are displayed in (E) (TE 15 ms, TR 500 ms, 3 mm slice thickness). No contrast enhancement of the lesion can be seen (arrow). The arrowhead indicates a contrast-enhanced blood vessel
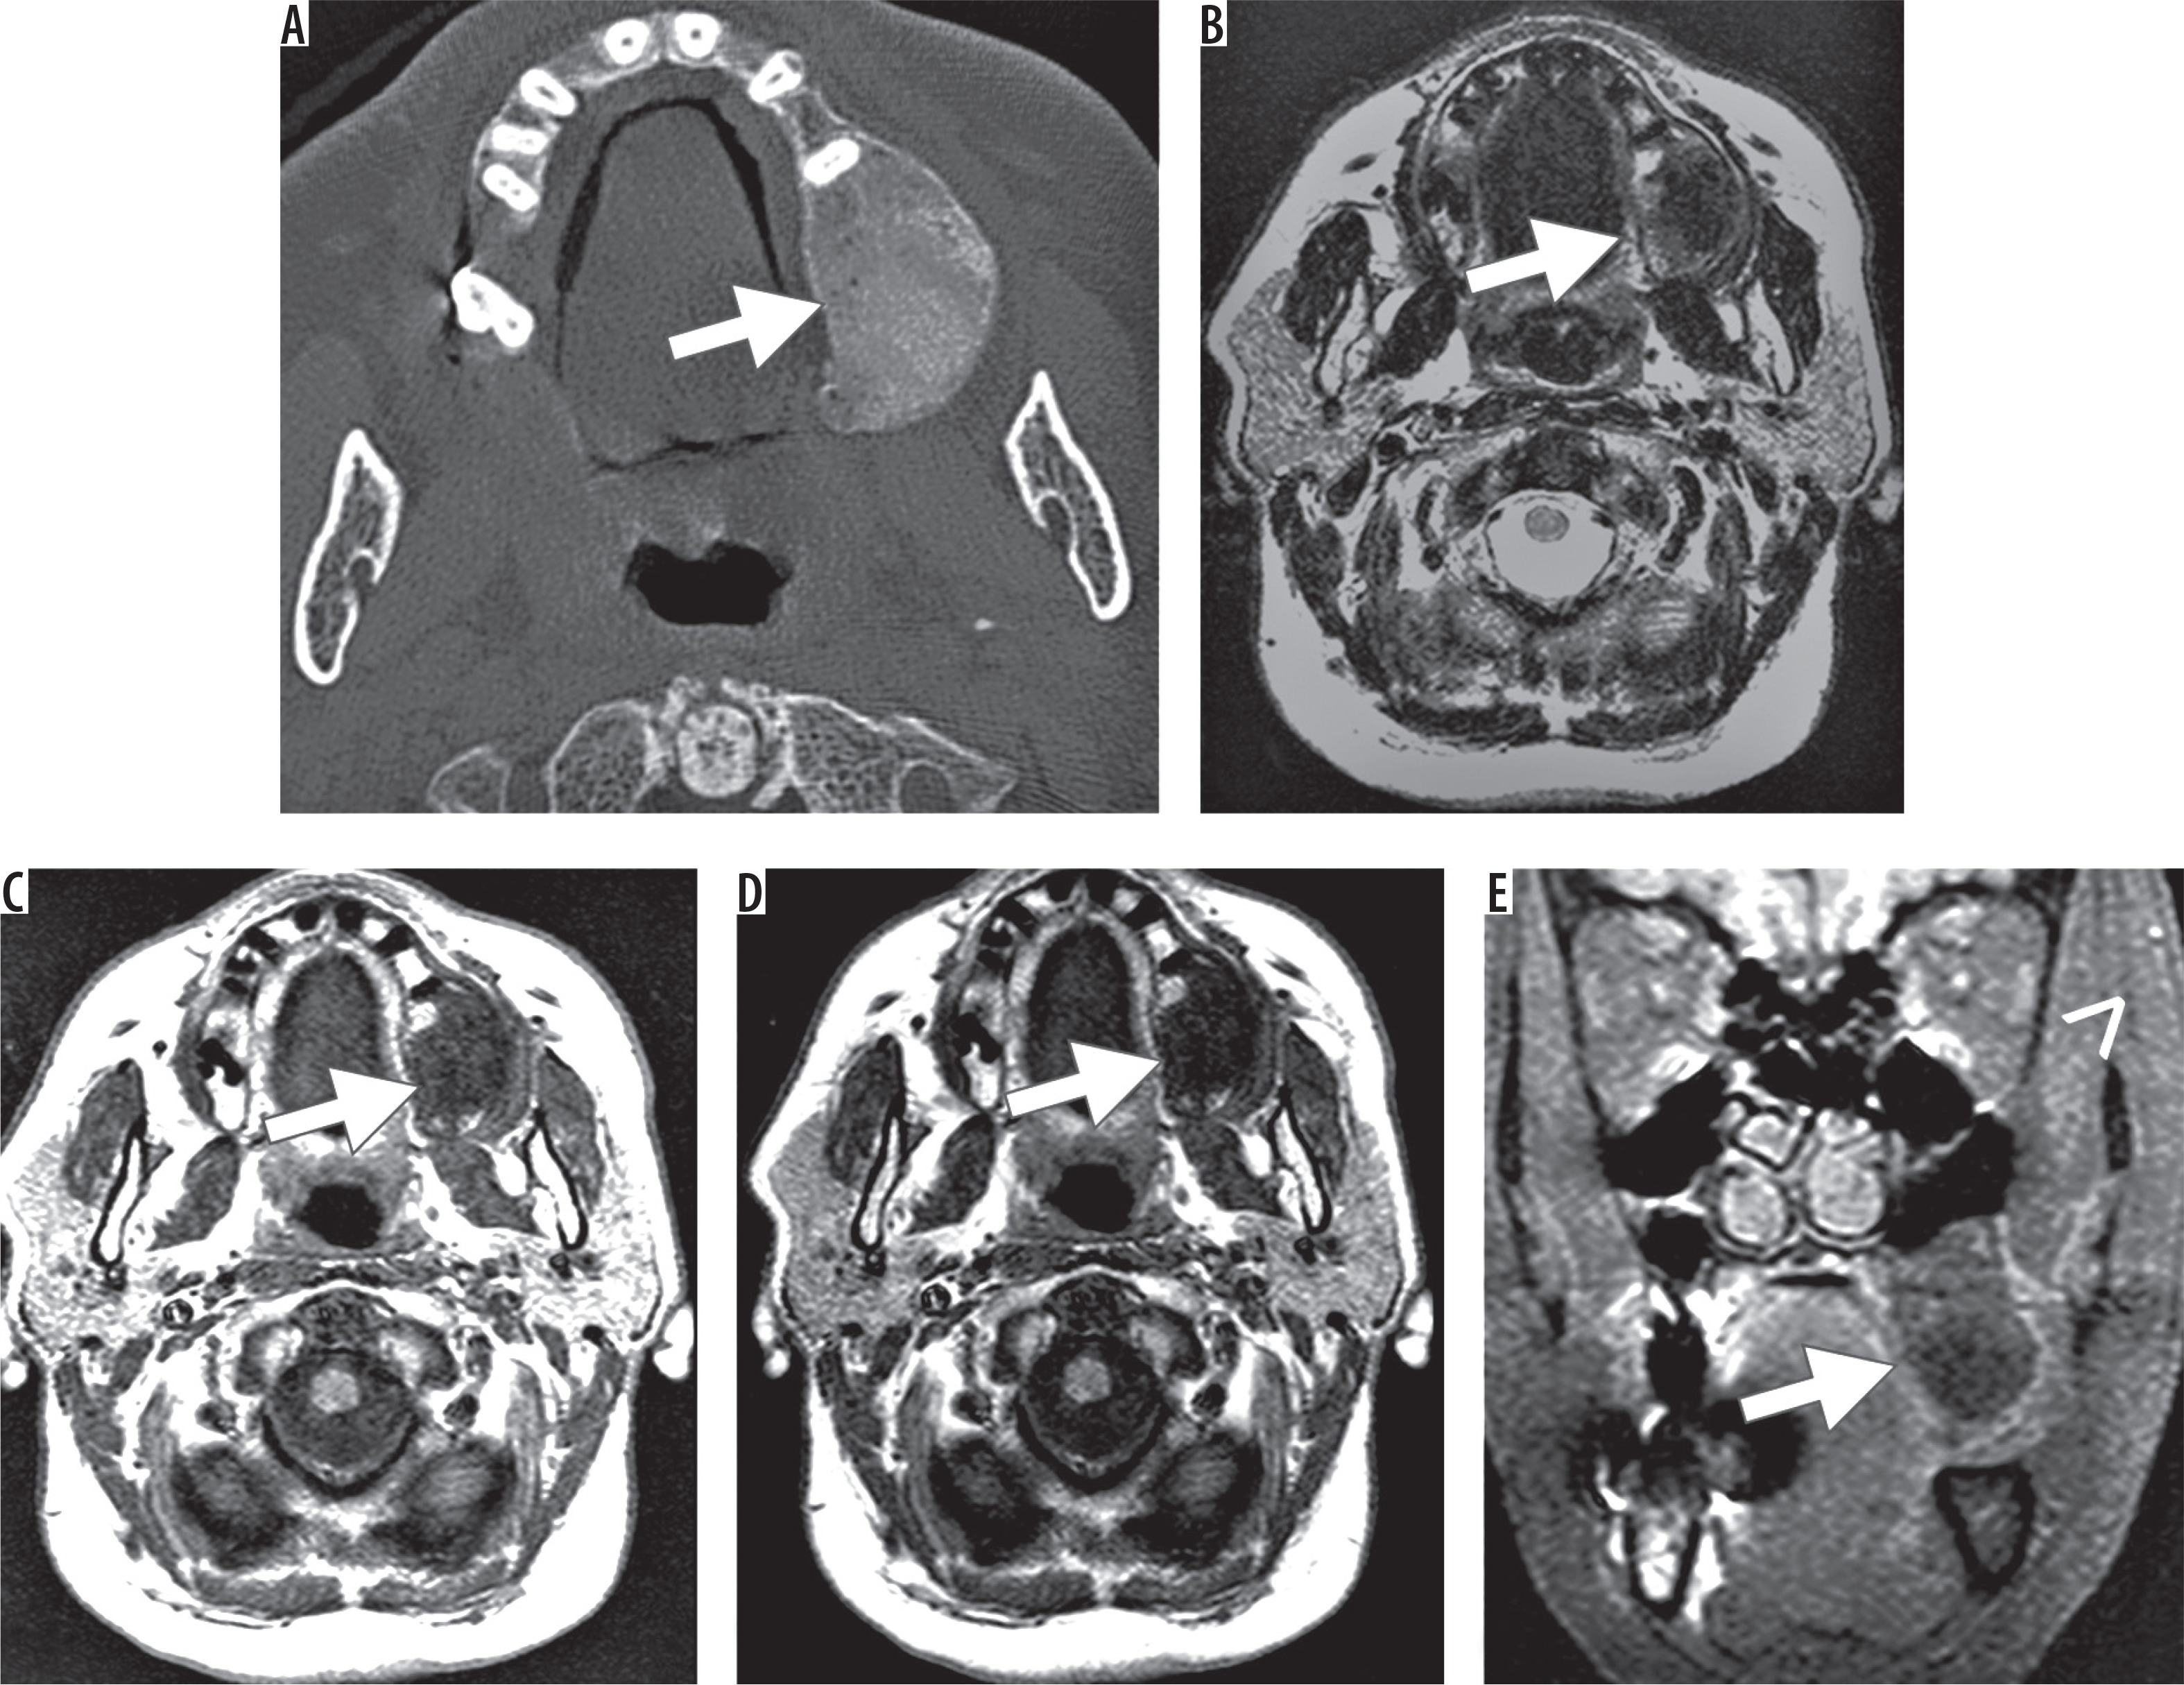
Figure 3
17-year-old female with fibrous dysplasia of the right sphenoid and clival bone. A) is a transverse section of the computed tomography dataset in the bone window (window width 1700 HU, centre 350 HU) and shows a lesion with a large ground glass area and cystic changes in the centre. T1w images in transverse (B) and coronal planes (C, TE 14 ms, TR 440 ms) and T2w images (D, TE 103 ms, TR 3500 ms) are shown. Images after administration of 15 ml gadopentetate dimeglumine (E, F) show heterogeneous enhancement of the lesion and homogeneous enhancement of the ground glass areas
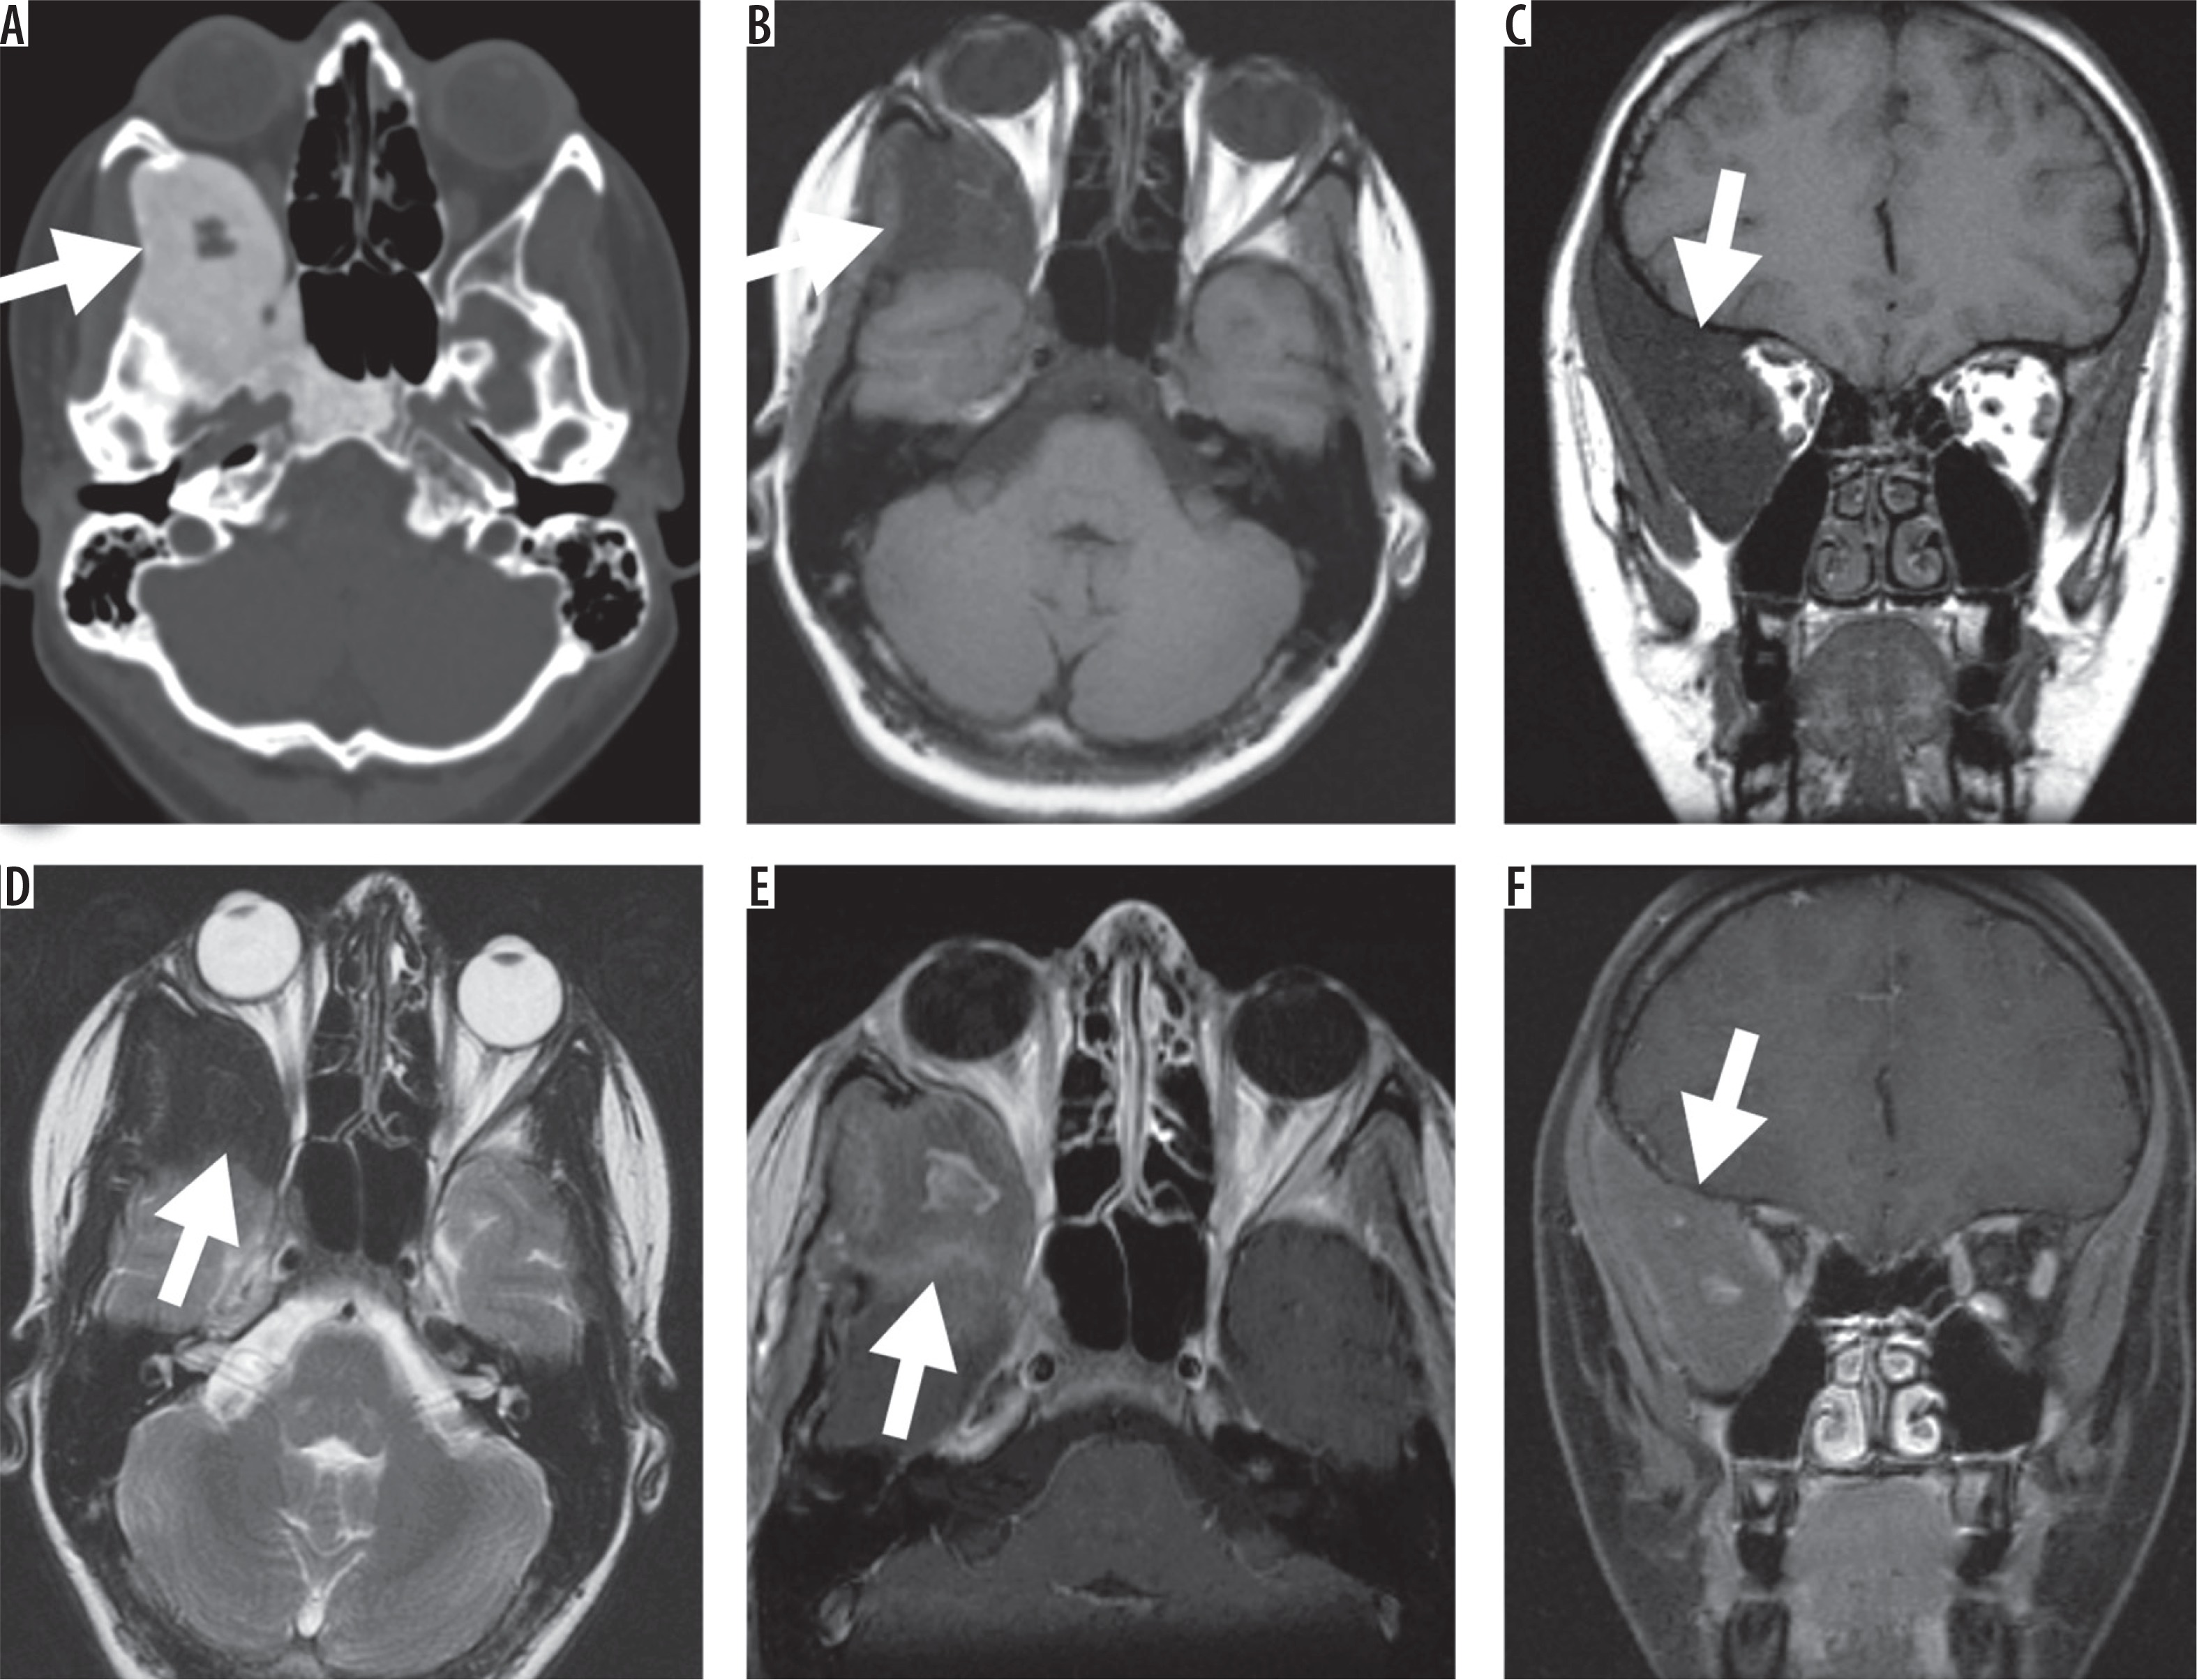
Figure 4
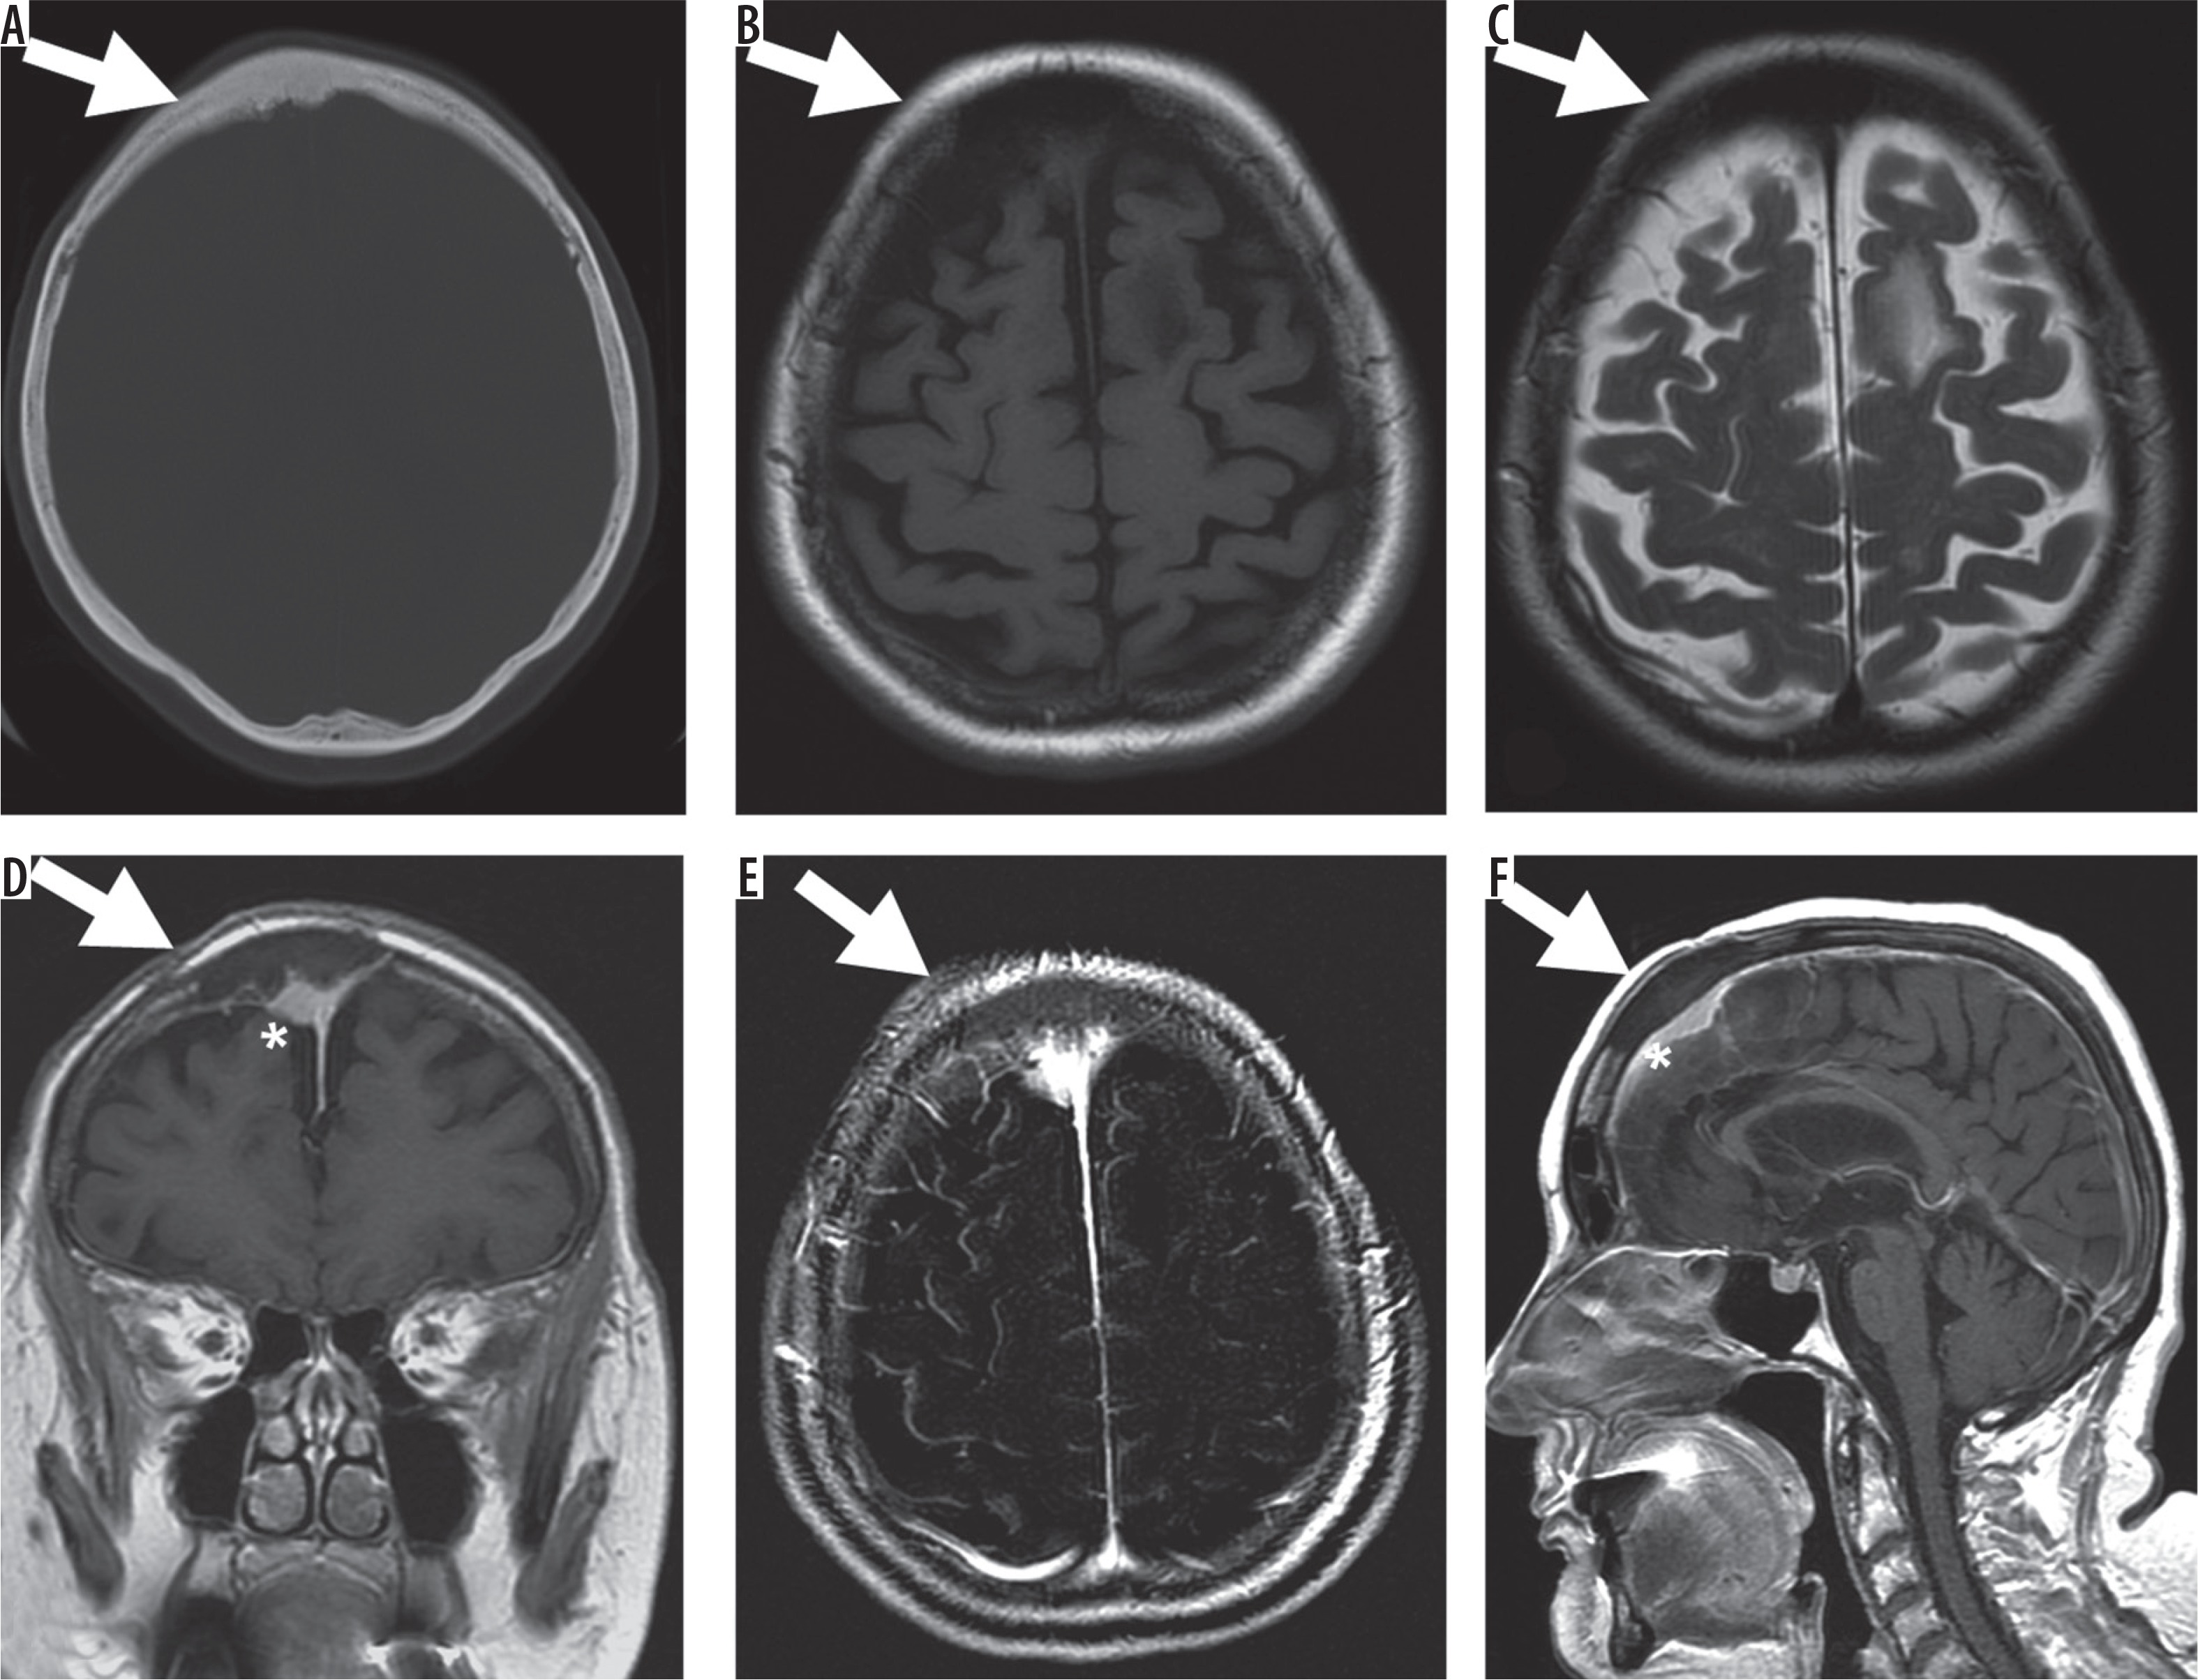
78-year-old female with intraosseous meningioma of the frontal bone. A) A transverse section of the computed tomography dataset in the bone window (window width 1700 HU, centre 350 HU), a localised sclerotic thickening of the bone and alteration of the inner table can be noted. The corresponding T1- (B) and T2- (C) weighted imaging show hypointense signal of the bone and no soft tissue component. The adjacent intracranial signal is unremarkable. After intravenous application of 10 ml gadopentetate dimeglumine (D, coronal reconstruction) slight and heterogeneous enhancement can best be depicted on the T1-weighted subtraction images (E, same slice orientation as in B). The adjacent dural sinus shows normal contrast media filling (F, sagittal reconstruction)
The CFD lesion was homogeneous in T1w in 44.4% (16/36) and in T2w in 38.9% (14/36). The signal intensity of the CFD lesion was low in T1w in 58.3% (21/36), intermediate in 30.6% (11/36), and high in 11.1% (4/36) and in T2w 13.9% (5/36), 8.3% (3/36), and 77.8% (28/36), respectively. The combinations of homogeneity/heterogeneity and signal intensities for T1w vs. T2w are outlined in Figure 5. Postcontrast images were available for 34 lesions and showed positive enhancement in 97.1% (33/34, example shown in Figure 1). Only one lesion showed no contrast enhancement (Figure 2).
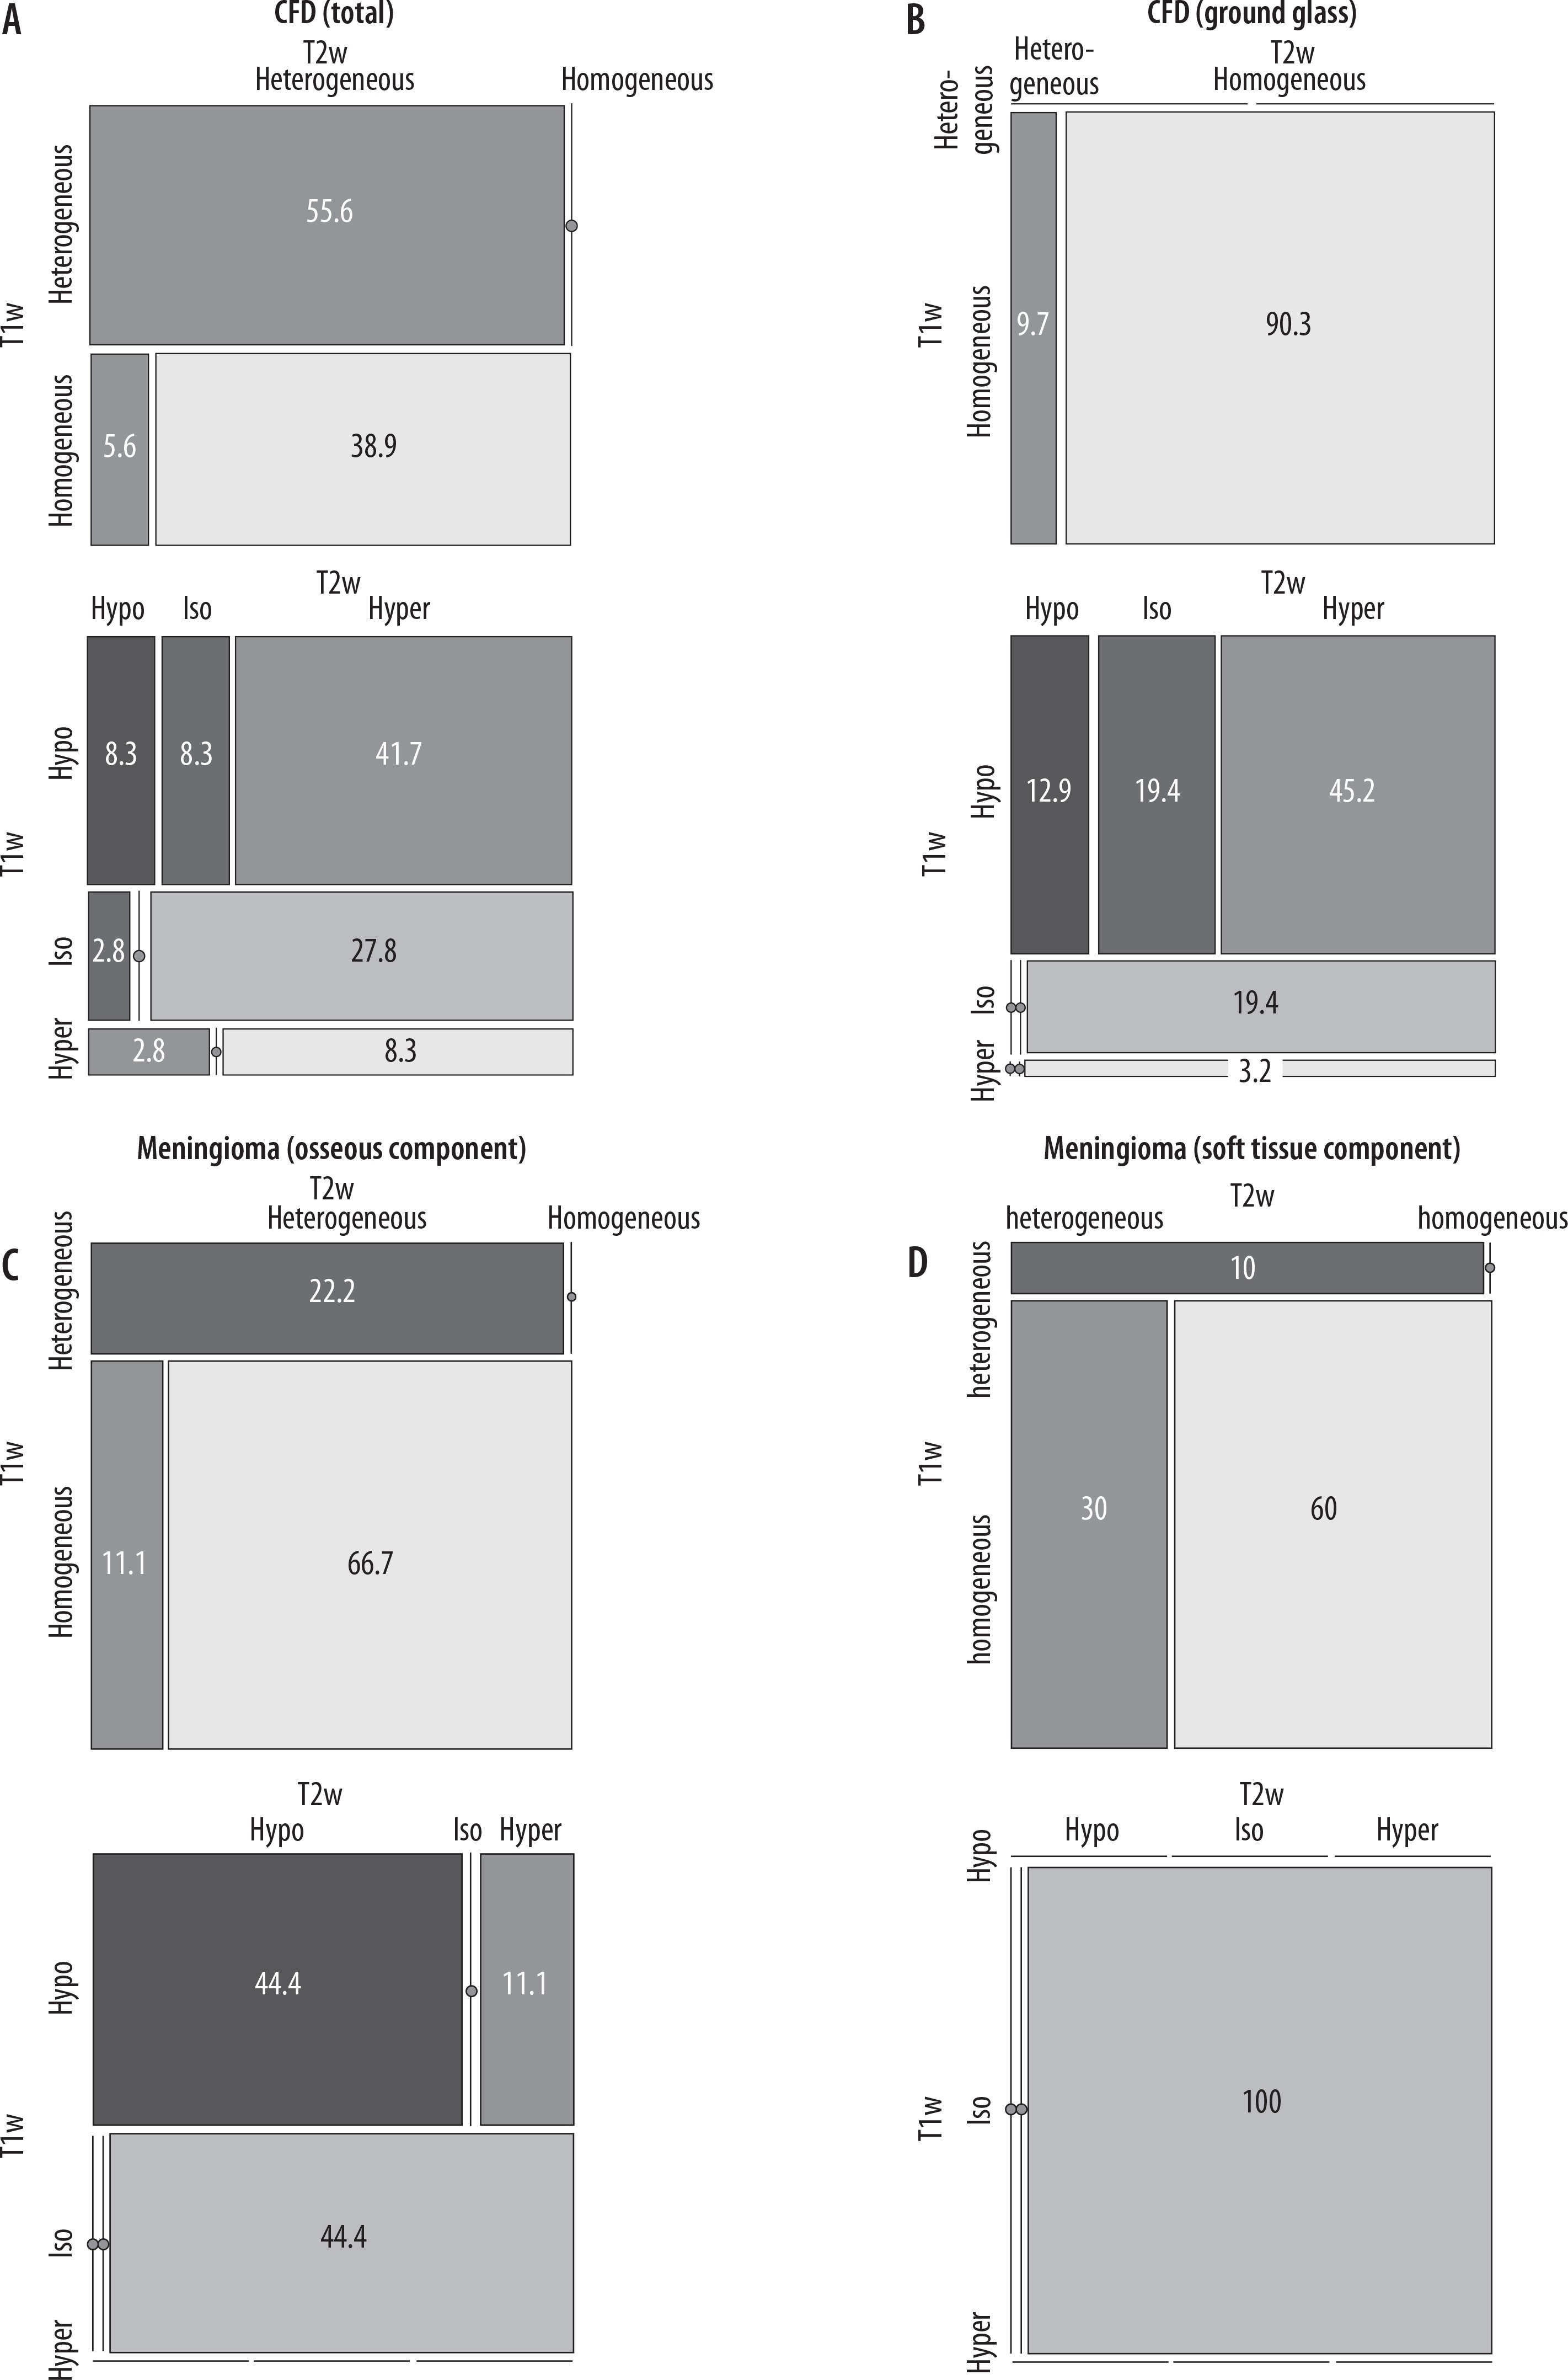
Figure 5
Mosaic plots depicting the homogeneity/heterogeneity (upper row) and signal intensity analysis (bottom row) of T1w and T2w. A) The whole craniofacial fibrous dysplasia (CFD) lesion (n = 36) was rated concordantly heterogeneous in T1w and T2w in 55.6% of cases and concordantly homogeneous in 38.9%. The majority of CFD lesions was hyperintense in T2w and hypointense (41.7%) or isointense (27.8%) in T1w. B) Areas of ground glass phenomenon (n = 31) were rated predominantly homogeneous in T1w and T2w (90.3%). The major percentage of lesions shows hypointensity in T1w and hyperintensity in T2w (CFD 41.7%; ground glass 45.2%) as well as isointensity in T1w and hyperintensity in T2w (CFD 27.8%, ground glass 19.4%). C) The osseous component of intraosseous meningioma (n = 9) were concordantly heterogeneous in T1w and T2w in 22.2% of cases and concordantly homogeneous in 66.7% of cases. Osseous components were concordantly hypointense in T1w and T2w (44.4%) and showed isointensity (44.4%) or hypointensity (11.1%) in T1w and hyperintensity in T2w. D) The soft tissue components of intraosseous meningiomas (n = 10) showed concordant homogeneity in 60% and concordant heterogeneity in 10%. All soft tissue components showed isointensity in T1w and hyperintensity in T2w
Detailed analysis of the ground glass phenomenon in craniofacial fibrous dysplasia
CT data were available for 33 of the 36 CFD lesions in 32 patients. The ground glass phenomenon was detected in 97.0% (32/33 lesions). T1w images were available for 31 lesions, T2w images for 32 lesions, and postcontrast images for 30 lesions with the ground glass phenomenon.
The internal structure of the ground glass area was homogeneous in T1w in all 31 lesions and in T2w in 90.6% (29/32).
Signal intensity was mainly hypointense in T1w images and hyperintense in T2w images (15/36 of the whole CFD lesion and 14/31 of the ground glass part of the lesion) and the second major part of CFD lesions was isointense in T1w and hyperintense in T2w (27.8% of the whole CFD lesion and 19.4% of the ground glass part of the lesion), as illustrated in Figure 2. Ground glass areas were enhanced in 93.3% of cases (28/30).
Patients with intraosseous meningioma
The patients with intraosseous meningioma had a mean age of 59.9 ± 13.2 years (range 37-74 years). Nine of the 10 meningiomas had an osseous and an extra-osseous soft tissue component. In one case the soft tissue of the meningioma destroyed and replaced the adjacent bone completely, and only a soft tissue component was identified. Osseous and extra-osseous soft tissue components of the meningiomas showed a mean lesion size in MRI of 48 mm ± 21 mm (range 22-86 mm) and 35 mm ± 20 mm (range 13-72 mm), respectively.
In the patients with meningioma the affected bone was broadened in two cases (20.0%) and destroyed in eight cases (80.0%). Cortical thinning was observed in nine cases (90.0%). In all cases of meningioma the zone of transition was narrow and the margin was irregular. No cystoid change was detected. Surrounding tissue was infiltrated in eight cases and displaced in one case by expansive growth.
Both osseous and soft tissue components of the meningiomas were predominantly homogeneous in T1w (7/9 and 9/10) and T2w (6/9 and 6/10). The osseous component was in similar portions isointense in T1w and hypointense in T2w, and hypointense in T1w and T2w, as shown in Figure 5. Signal intensity of the soft tissue component of the meningiomas was isointense in T1w and hyperintense in T2w in all 10 cases. Post-contrast enhancement was positive in only 55.6% (5/9) of the osseous components but in all the soft tissue components (9/9). The ground glass phenomenon was found in one case of meningioma with homogeneous T1w isointensity and homogeneous T2w hyperintensity.
Differentiation of craniofacial fibrous dysplasia vs. intraosseous meningioma
CFD patients were significantly younger than intraosseous meningioma patients (41.5 ± 20.7 years vs. 59.9 ± 13.2 years, respectively; p = 0.014). ROC analysis revealed an optimal threshold of 48 years with 63% sensitivity and 80% specificity for differentiating CFD from intraosseous meningioma.
The following two parameters showed highest sensitivity and accuracy in MRI for the diagnostic differentiation of CFD vs. intraosseous meningioma: absence of soft tissue component (accuracy 100%) and bone broadening (accuracy of 98%). The presence of ground glass phenomenon in CT showed an accuracy of 95% for differentiation of CFD and intraosseous meningioma. Of note, the evaluation of MR signal intensity showed an accuracy of ≤ 71% (Table 1).
Table 1
Performance for selected MR parameters and presence of ground glass phenomenon in computed tomography for the diagnosis of craniofacial fibrous dysplasia against intraosseous meningioma
Discussion
As the number of MR examinations has increased in recent years, reliable detection and detailed characterisation of incidentally detected bone lesions have become important tasks for radiologists [10]. Our study expands the present knowledge of CFD and the ground glass phenomenon in MRI based on one of the largest study groups of CFD in MRI published to date [7,11]. In summary, our study confirms reliable detectability of CFD in MRI and typical features of CFD in general, such as young patient age, expansive nature of the lesion, and local alteration of bone, cortex, and especially the bone marrow [2].
In MRI, the internal structure of CFD lesions was predominantly heterogeneous on unenhanced T1-weighted and T2-weighted images and on contrast-enhanced T1-weighted images. Variation between areas of high and low signal intensity was observed. Although histologic verification was not available for each CFD lesion in our study, our MRI findings are consistent with the mixed composition of CFD lesions reported in the literature [11-13]. CFD lesions are not composed solely of homogeneous fibrous tissue but can also contain hyaline cartilage [12,14], bone matrix of variable mineralisation, fatty tissue [11], necrosis, and areas of cystic degeneration [13]. Nearly 90% of the CFD lesions evaluated in our study were iso- to hypointense to skeletal muscle in T1w images, which is again consistent with published findings [7,11,15]. Low T1w signal intensities may indicate fibrous tissue [13,16], calcifications, hyaline cartilage, collagenous matrix, or necrotic parts [13]. Fibrous tissue generates low to intermediate T2w signal intensity [13]. This explains the low to intermediate T2w signal intensity of FD lesions reported by Adada et al. in 2003, Hanifi et al. in 2013, and Atalar et al. in 2015 [7,15,17]. However, high T2w signal intensity of FD lesions was observed by Utz et al. as early as 1989 [16]. More recent studies report variable appearance of FD lesions in T2w sequences [11]. In our study, 77.8% of CFD lesions had high T2w signal intensity, which indicates the presence of hyaline cartilage, chondroid and collagenous matrix, and necrotic parts [13]. Fibrous tissue in FD lesions is highly vascularised and is characterised by contrast enhancement [12,16]. In our study, 97.1% of the CFD lesions showed enhancement.
Meningiomas can produce MRI signal intensities similar to FD: in 2005, Tokgoz et al. reported a case of frontoparietal intraosseous meningioma showing low T1w and high T2w signal intensity with homogeneous contrast enhancement [18]. In 1995 another case of T1w hypointensity in intraosseous meningioma was reported by Crawford et al. [19], and Lee et al. reported a case in 1992 of a meningioma with hypointensity in T1w and intraosseous hyperintensity in T2w and the presence of an extra-osseous soft tissue component [20]. Bone marrow was displaced with simultaneous dilatation of the calvarian diploe, and postcontrast enhancement was heterogeneous in the intraosseous component while homogeneous in the soft tissue component [20].
Imaging features in MRI detected in this study that are particularly suitable for differentiation of CFD from intraosseous meningioma include broadening of the affected bone and absence of an extra-osseous soft tissue component or adjacent soft tissue infiltration. The intraosseous meningiomas analysed in our study showed irregular infiltration of adjacent bone and destruction of the affected bone, whereas bone affected by FD was broadened. A soft tissue component was present in all cases of meningioma while FD did not show a soft tissue component, as also known from literature [21]. FD lesions can undergo cystic degeneration with formation of simple regressive cysts or secondary aneurysmal bone cysts [22]. Cystic areas with high signal intensity in T2w were observed in 44.4% of the CFD cases in our study but in none of the patients with meningioma [13].
Furthermore, the patients with intraosseous meningioma were significantly older than the CFD patients (41.5 ± 20.7 years vs. 59.9 ± 13.2 years, respectively; p = 0.012). ROC analysis revealed an optimal threshold of 48 years with 63% sensitivity and 80% specificity for differentiating CFD from intraosseous meningioma. FD is mostly found in younger patients, whereas meningiomas tend to occur in middle-aged patients [9]. Intraosseous meningiomas often present with symptoms like pain [1] or visual impairment [9], although cases of incidental findings without prior symptoms are reported in the literature. Wood et al. found meningiomas in 100 patients during autopsy which were clinically inapparent [23]. Conversely, FD is often asymptomatic and is occasionally diagnosed in older individuals, while meningioma can rarely occur in children [24]. In the case of doubt, intraosseous meningiomas can only be verified histologically [1].
The ground glass phenomenon characterising CFD in CT shows a more homogeneous overall appearance than the whole lesion. Specifically, ground glass areas were homogeneous in 100% of cases in T1w images and in 90.3% of cases in T2w images. The ground glass areas within CFD lesions were iso- to hypointense in T1w in 96.8% and showed enhancement after gadolinium-based contrast medium administration in 93.3%. In T2w, ground glass areas were hyperintense in 67.7% of the lesions. The ground glass phenomenon is caused by the presence of woven bone with variable mineralisation, which contributes to lower T2w signal intensity [25]. Metabolic activity, on the other hand, results in high T2w signal intensity [1] and contrast enhancement [26]. It is well established that the appearance in T2w sequences is dependent on the metabolic status of fibrodysplastic tissue with high metabolic activity resulting in longer T2 relaxation time and thus high signal intensity [1].
Even though ours is one of the largest series of patients that has thus been analysed for MRI morphology of CFD lesions, the number is still relatively small. Other imaging techniques such as diffusion-weighted imaging, which has shown to possibly discriminate FD from malignant findings due to high ADC values, has not been evaluated in our study [27]. Additional possible differential diagnoses of CFD apart from intraosseous meningioma could not be included, which limits the overall significance of our findings. Information regarding the time of diagnosis and possible prior drug therapy were not available for all patients. Without knowledge of these parameters, reliable evaluation of the metabolic activity of CFD lesions and potential specific changes in MR morphology is not possible. Future studies should evaluate the potential of MRI for providing information on metabolic changes in CFD lesions and ground glass areas.
Conclusions
Our study demonstrates that CFD can be reliably detected by MRI. Broadening of the affected bone and the absence of soft tissue component are the most accurate parameters for diagnosis of CFD against intraosseous meningioma. About two thirds of the CFD lesions appear hypo- to isointense in T1w and hyperintense in T2w images and show contrast enhancement. No specific MR parameters could be derived for the areas of ground glass in CT although these areas have a more homogeneous internal MR appearance than the whole CFD lesion.