


Introduction
Pulmonary hypertension (PHT) is rare in children, but is a potentially life-threatening condition, causing significant morbidity and mortality. Early diagnosis can improve patient outcomes and also increase disease awareness in healthcare workers and lead to an earlier referral to a paediatric tertiary centre [1,2]. The gold standard to diagnose PHT, defined as mean pulmonary artery pressure more than 25 mmHg, is right heart catheterization [3]. However, catheterization is an invasive test with recognized complications [1,3,4]. Computed tomography (CT) is commonly used in clinical practice to diagnose and evaluate patients who have congenital heart disease, pulmonary disease, and/or suspected PHT [1,4,5].
Several studies have suggested that a main pulmonary artery (MPA) diameter > 29 mm and MPA-toascending aorta (AA) ratio of more than 1 : 1 indicates PHT in adults [5-8]. However, the size of the MPA in children is affected by age, gender, and body weight [9-12]. Furthermore, unlike adults, in general, healthy children have an MPA/AA ratio of 1.09 [11]. A study by Caro-Domínguez et al. suggested that the MPA/AA ratio with a cut-off value of 1.3 can predict PHT in children [13]. However, the size of the AA also varies depending on the diseases of the aortic valve or aorta. For example, the AA can be small in patients with a hypoplastic aortic arch, or large in patients with aortic valve disease or collagen vascular disease. Therefore, a comparison of the MPA with the size of the descending aorta (DA) is more reliable than comparing MPA to AA size, and the MPA/DA ratio could be a good indicator for PHT [14]. The purpose of this study was to establish a cut-off value of MPA/DA and MPA/AA ratios by CT to suggest PHT in children and to evaluate the relationship between the size of MPA, AA, DA and the MPA/AA ratio, the MPA/DA ratio, and PHT in children.
Material and methods
Study design and patients
This case-control study was approved by the institutional Human Research Ethics Committee (HREC) (protocol no. 60-160-07-4). The study initially collected the records of 2301 children (up to 18 years old) who underwent right heart catheterization (RHC) between January 2007 and August 2018. PHT was defined as a mean pulmonary artery pressure of more than 25 mmHg by RHC. Forty-seven children were diagnosed as PHT and underwent thoracic computed tomography (CT). Two independent readers retrospectively reviewed the CT imaging. Two children were excluded from the study: one child in whom the duration between the RHC and CT was more than 9 months [13] and one child for whom the CT image quality was too poor to accurately measure vascular structures, leaving a total of 45 patients analysed in the case group. In the control group, we included a random selection of thoracic CTs of children who did not have pulmonary hypertension, with no intrathoracic vascular anomalies or intrathoracic abnormalities, age- and gender-matched to the case group. The control group did not undergo RHC, and it was assumed by clinical history and physical examination that there was no suspicion for PHT.
Computed tomography protocols
The 3 CT scanner models used during the study period were a single-slice Hitachi Pronto CT scanner, a 64-multislice Philips Brilliance CT scanner, and a 160-slice Toshiba Aquilion Prime CT scanner. Four cases in the control group and 10 cases in PHT group were scanned by a single-slice Hitachi Pronto CT scanner, 18 non-EKG-gated cases in the control group and 18 EKG-gated cases and 4 non-EKG-gated cases in PHT group were scanned by 64-multislice Philips Brilliance CT scanner, and 23 non-EKG-gated cases in the control group and 12 EKG-gated cases and 1 non-EKG-gated case in PHT group were scanned by a 160-slice Toshiba Aquilion Prime CT scanner. The CT parameters were calculated based on body weight, and the kilovoltage peaks (kVp) ranged between 80 and 120. The current in milliamperes (mA) was selected based on body weight using a dose-modulated technique in the Philips and Toshiba scanners. Intravenous non-ionic contrast medium was administered via an automated power injector in a peripheral vein. The contrast medium dose was 2 ml/kg, and the flow rate was adjusted between 1 and 4 ml/kg depending on the needle gauge. The images obtained from a single-slice CT scan (Hitachi Pronto CT scanner) were reconstructed at section widths of 5 mm axial for evaluation at the mediastinal window (3 mm in children younger than 2 years of age). The images acquired by the multi-slice CT scanners were reconstructed at section widths of 3 mm with 2-mm increments in children older than 2 years of age and 2 mm with 1-mm increments in children younger than 2 years of age.
Study instrument(s) and outcome measurement(s)
The patients’ clinical data were retrieved from the electronic medical records of the Hospital Information System (HIS) and recorded in Microsoft Excel. Images of thoracic CT scans stored by the Picture Archiving and Communication System (PACS) were used for analysis. The investigator, who did not participate in image interpretation, removed all patient identifying information on the CT scans and previous imaging findings and parameters.
The images were measured separately and independently by a paediatric cardiac radiologist with 13 years of experience, and by a third-year radiology resident, with agreement by consensus. The window width (W) and window level (L), adjusted for the evaluation of mediastinal soft tissues, were 350-450 HU (W) and 40-50 HU (W), respectively. The function of multiplanar reconstruction (MPR) was used to decide the perpendicular axis to the long axis of the vessel. Three measurements were performed by each investigator. The average measurement values of the 2 readers were used for analysis. All additional patient data, including any subsequent clinical, imaging, or surgical findings, were withheld during image interpretation.
Image analysis
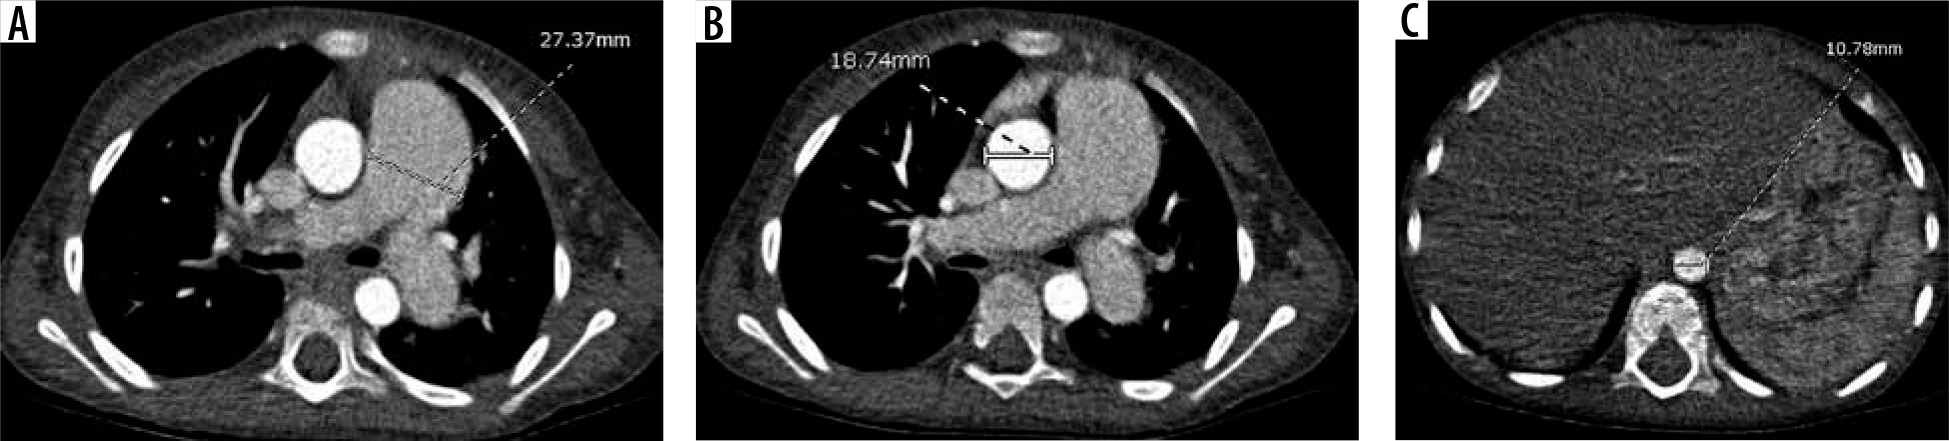
The widest short-axis diameter of the DA at the level of the diaphragmatic outlet, AA, and MPA at the level of the bifurcation were obtained, including only the luminal diameter and excluding the wall of the vessel (Figure 1). The angles of the measurements of the MPA, AA, and DA were drawn perpendicular to the long axis of the vessels at that level.
Statistical analysis
The quantitative parameters are presented as mean ± standard deviation (SD) for continuous variables with normal distribution, and median (interquartile range) (IQR) for variables without normal distribution, while the qualitative parameters are expressed as counted numbers and percentages. All analyses were done with R software version 3.3.3. Categorical variables were compared using the chi-square test and Fisher’s exact test. Continuous variables were compared using the Ranksum test and t-test. Inter-observer agreement was assessed with intraclass correlation coefficients (ICC). The ratio of MPA to descending aorta with a discriminatory value suggestive of pulmonary hypertension and its ROC area under the curve was calculated, and a p-value of less than 0.05 was considered to have statistical significance.
Results
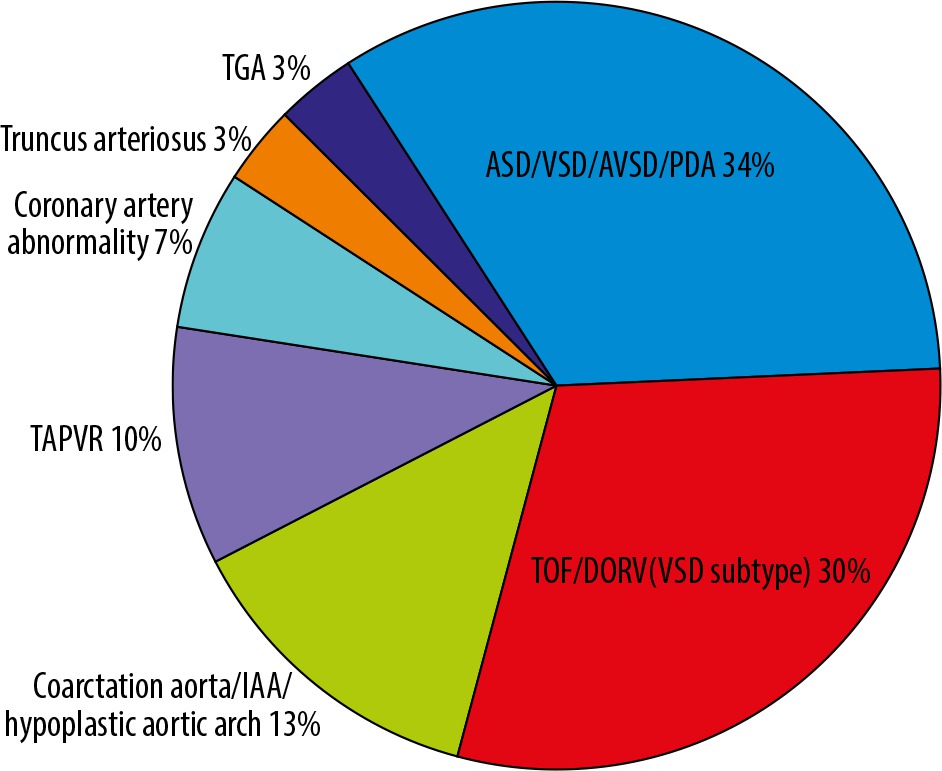
The patients’ and controls’ characteristics are summarized in Table 1. The mean age and age range (minimum-maximum) in the non-PHT group and PHT group were 6.4 months (7-213 months) and 6.9 months (6-215 months), respectively. There were no statistically significant differences in age, gender, or body surface area (BSA) between the 2 groups. The most common indication to perform CT in the PHT group was congenital heart disease (CHD) (n = 30, 66.7%), and in the non-PHT group it was metastatic workup without abnormal intrathoracic findings (n = 31, 68.9%). The median (IQR) of the mean pulmonary artery pressure by RHC in the PHT group was 34 (27-50) mmHg. The subtypes of congenital heart disease are shown in Figure 2. The majority of congenital heart disease cases were non-cyanotic with increased pulmonary blood flow (atrial septal defect [ASD], ventricular septal defect [VSD], atrioventricular septal defect [AVSD], and patent ductus arteriosus [PDA] [n = 10, 34%]). The second most common group was cyanotic heart disease (tetralogy of Fallot [TOF] and double outlet right ventricle [DORV] spectrum [VSD subtype] [n = 9, 30%]). The time between the RHC and CT study was 0 to 254 days with a mean of 71.64 days and a median of 23 days.
Table 1
Patient characteristics in PHT and non-PHT groups
The main pulmonary artery (MPA), descending aorta (DA), and ascending aorta (AA) diameters and the ratios of MPA to DA (MPA/DA) and MPA to AA (MPA/AA) between the children with and without PHT are shown in Table 2. In children with PHT, there were statistically significant differences in the MPA/DA and MPA/AA ratios between the CHD group and the non-CHD group (Table 3).
Table 2
The main pulmonary artery (MPA), descending aorta (DA), and ascending aorta (AA) diameters and ratio of MPA to DA (MPA/DA) and MPA to AA (MPA/AA) of children with and without pulmonary hypertension (PHT)
Table 3
The values of the main pulmonary artery (MPA), descending aorta (DA), and ascending aorta (AA) diameters and ratios of MPA to DA (MPA/DA) and MPA to AA (MPA/AA) in children with pulmonary hypertension (PHT) categorized into congenital and non-congenital heart disease
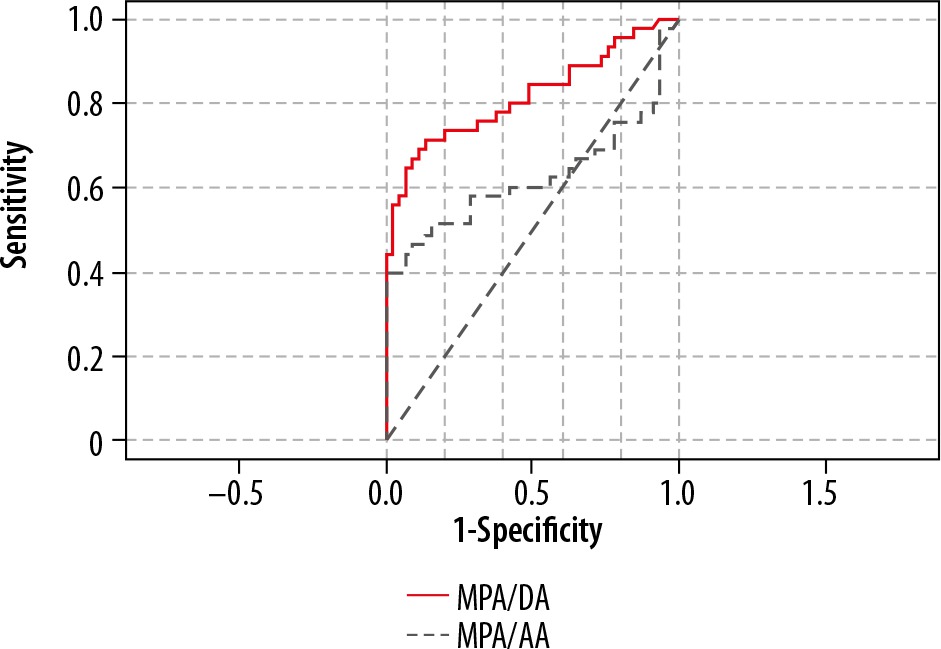
Multiple values of MPA/DA ratios were tested to identify the best positive predictive value (PPV) and the lowest false-positive in PHT patients. A ratio of MPA/DA of 1.8 carried a positive likelihood ratio (LR+) of 7.5 with a sensitivity of 66.67%, a specificity of 91%, PPV of 88%, and NPV of 73.21%. The receiver operating characteristic (ROC) area under the curve for the discriminatory value of 1.8 was 0.817 (Figure 3). A ratio of MPA/AA of 1.3 carried a positive likelihood ratio (LR+) of 6 with 40% sensitivity, 93% specificity, 85.7% PPV, and 61% NPV. The receiver operating characteristic (ROC) area under the curve for the discriminatory value of 1.3 was 0.667.
Figure 3
main pulmonary artery (MPA)/ descending aorta (DA) ratio of 1.8 carries a positive likelihood ratio of 7.5 with a specificity of 91% and PPV of 88%. The receiver operating chara cteristic (ROC) area under the curve for the MPA/DA value of 1.8 was 0.817. The ratio of MPA/ascending aorta (AA) of 1.3 carried a positive likelihood ratio (LR+) of 6 with a specificity of 93% and PPV of 85.7%. The receiver operating characteristic (ROC) area under the curve for the MPA/AA discriminatory value of 1.3 was 0.667
Intraclass correlation coefficient (ICC) for each mediastinal vessel ratio between the two readers was calculated (Table 4). There was an excellent agreement of MPA/DA and MPA/AA between readers (MPA/DA: 0.992 with 95% CI: 0.982-0.996 and MPA/AA: 0.946 with 95% CI: 0.794-0.995).
Discussion
This study found that MPA size was associated with pulmonary hypertension in children. The MPA was significantly larger in the PHT group compared with age-, gender-, and BSA-matched normal children. A previous study by Akay et al. found that the size of the pulmonary artery itself was affected by other factors, and the authors concluded that the ratio of MPA and other thoracic vessels was a more specific means of predicting PHT [10].
In our study, the ratios of MPA/AA and MPA/DA were also significantly larger in the group of 45 children with PHT than in the age-, gender-, and BSA-matched control children who had no risk factors of PHT. The ratio of MPA and AA in the non-PHT group was 1.1, and the cut-off to diagnose PHT was 1.3 with of a PPV of 85.7% and specificity of 93%, consistent with a previous study by Caro-Dominguez et al. in which the ratio of MPA to AA in normal children was 1.11 and the cut-off value of MPA to AA was 1.3 (PPV of 97%) [13]. However, the receiver operating characteristic (ROC) area under the curve for the discriminatory value in our study was 0.667, which was lower than that found in the previous study (0.94) [13]. This could be due to a high percentage of CHD in the PHT group in our study, which was 66.7%, while the CHD in the Caro-Dominguez study was 43.2% [13]. Furthermore, the AA size could be affected by aortic blood flow in patients with complex CHD, as described in the study of Langley et al. [14,15].
We also found that the median size of AAs in this study was significantly different between the PHT and non-PHT groups (19.3 mm and 15.9 mm, respectively), but DA sizes between the 2 groups were not significantly different. Therefore, the MPA/DA is a more accurate marker to indicate PHT in children, especially in CHD patients.
The MPA/DA ratio of 1.8 carried a positive likelihood ratio of 7.5 with a PPV of 88% and specificity of 91%. The receiver operating characteristic (ROC) area under the curve for the discriminatory value of 1.8 was 0.817. This ratio can be used to indicate PHT with minimal false positives, which can help to avoid invasive cardiac catheterizations. This ratio is not recommended for use in screening for PHT, but it is a suggestive value to alert physicians and radiologists to be aware of PHT in children who have risk factors of PHT.
There was excellent agreement in both the MPA/DA and MPA/AA ratios between the 2 readers with different levels of experience and skill, confirming that these parameters are easily reproducible and could be established as a valid tool for measurement of these values to diagnose PHT.
This study had a few limitations related to its retrospective nature, small sample size, heterogeneity of the types of CT scanner, and lack of right heart catheterization in the control group. Regarding the different CT scanners, most of the control cases underwent non-EKG-gated CT, and 33% of the PHT group underwent non-EKG-gated CT. However, the accurate thoracic great vessel or extracardiac vessel measurement was still acceptable in non-EKG-gated CT and we excluded only 1 case due to poor image quality. Moreover, the heterogeneity of the types of CT scanner did not interfere with the structural measurement, as proven by the excellent agreement between the 2 readers (0.992 in MPA/DA measurement and 0.946 in MPA/AA measurement).
Conclusions
Our study confirmed that having a larger MPA than thoracic aorta was associated with PHT in children. Because the DA is not affected by pulmonary pressure and aortic blood flow, the MPA/DA ratio is a more accurate measurement than the MPA/AA ratio, particularly in children with congenital heart disease. A cut-off value of the MPA/DA ratio equal to or more than 1.8 suggests PHT in children.