


Introduction
Differentiation between World Health Organisation (WHO) grade II and III gliomas is of upmost importance for selecting and developing appropriate treatment, detecting early treatment failure, and identifying accurate and clinically relevant biological endpoints for high-risk but potentially highly rewarding tumoural specific therapies tailored to the unique biology of an individual brain tumour [1-4]. Another benefit of imaging is the possibility of identifying the most malignant areas within a tumour in order to minimise the risk of biopsy sampling errors. Histopathology is the gold standard for grading of gliomas, but it carries sampling error due to the limited number of biopsy samples [5-8]. Conventional pre- and post-contrast MR imaging [9] and advanced magnetic resonance (MR) imaging techniques such as dynamic contrast enhancement and dynamic susceptibility contrast MR imaging [10-13], diffusion-weighted MR imaging [14,15], or combined MR pulse sequences [16,17] are used to differentiate grade II from grade III gliomas, but their results are overlapping [10-17].
Arterial spin labelling (ASL) is a non-invasive, perfusion-weighted MR imaging technique that calculates cerebral perfusion maps without administration of intravenous contrast agent [18-22]. The main principle of ASL is to use water protons of the arterial blood itself as a contrast agent to measure perfusion. The magnetisation of these inflowing protons is inverted in a region proximal to the scanned area by an external radiofrequency pulse [21-28]. Diffusion-weighted MR imaging has shown potential value in differentiating between glioma grades and in predicting the outcome of gliomas. It was reported that the histopathological grade of gliomas is inversely correlated with the apparent diffusion coefficient (ADC) value [29-32]. Few studies have discussed the role of ASL [21-24] and diffusion-weighted MR imaging [29-32] in the grading of gliomas. The novelty and uniqueness of this study is assessing combined tumour blood flow (TBF) and ADC of tumoural and peritumoural regions in the differentiation of grade II and grade III gliomas.
Its purpose is to assess ASL and DWI in the differentiation of grade II and grade III gliomas.
MATERIAL AND METHODS
Patients
This prospective study was approved by the Local Ethics Committee, and informed consent was obtained from each patient prior to the examination. The study included 39 patients provisionally diagnosed to have untreated diffuse gliomas based on conventional MR imaging. We excluded three patients from the study because two patients had metastasis and one patient had lymphoma. Finally, the study included 36 patients (20 male and 16 female). Their age ranged from 52-72 years (mean age, 62 years). The final diagnosis was based on histopathological examinations. Gliomas were classified according to world health organisation (WHO) classification into WHO grade II for 19 patients and WHO grade III for 17 patients.
Routine magnetic resonance imaging
The MR imaging of the brain was performed using a 1.5 Tesla MRI scanner (Ingenia, Philips) using a Stream Head Neck 20 channel coil. T1-weighted (TR/TE = 600/25 ms), T2-weighted (TR/TE = 6000/90 ms), and FLAIR (TR/TE/TI = 10000/115/2700 ms) sequences were obtained. The scanning parameters were matrix = 80 × 80, field of view (FOV) = 250 × 170 mm2, and slice thickness = 5 mm. Post-contrast T1-weighted images were obtained after intravenous administration of gadoterate meglumine, 0.5 ml/kg (0.1 mmol/kg) body weight, with maximum dose of 10 ml using a 20-22 G venous cannula with flow rate of 2 ml/s.
Arterial spin labelling imaging
ASL perfusion imaging was performed with pseudo-continuous labelling. Multiple time points were acquired after the label pulse. Fast spin echo single-shot EPI parallel imaging sequence SENSE was used with reduction of P 2.3 to reduce echo train length susceptibility-related distortions. The following parameters were used: slice thickness = 8 mm, inter-slice gap = 1.5 mm, FOV = 240 × 240 mm, data matrix = 68 × 68, voxel size = 3.6 × 3.5 × 3 mm, TR/TE = 250/20 ms, slice number = 6, scan duration = 4 min, and post-labelling delay time = 1.5 s.
Diffusion-weighted imaging
Imaging was done in the axial plane using multiple b values (b values of 0 and 1000 s/mm2). It was performed before administration of contrast medium by using a single-shot, spin-echo, echo-planar imaging sequence with the following parameters: slice thickness = 8 mm, inter-slice gap = 1.5, FOV = 240 × 240 mm, voxel size = 1.51 × 2.17 × 5 mm, TR/TE = 3004/88 ms, and scan duration = 1 min.
Post processing
Image analysis was performed by one radiologist expert in neuroradiology with 10 years’ experience, who was blinded to the histopathological results. The DICOM images were transferred to a workstation (extended MR Workspace 2.6.3.5, Philips medical systems Nederland BV) supplied by the vendor. The post processing of arterial spin-tagging data typically involves initial subtraction of alternating tag and control image pairs and motion correction. The regions of interest (ROIs) were placed within tumoural and peritumoural regions (within a 1 cm distance from the outer enhancing tumoural margin). The ROIs were drawn in an area with maximum signal enhancement on an ASL map and the lowest signal on ADC. Necrotic tissue and large vessels were avoided by comparison with T1Gd and T2-weighted images. The TBF was calculated as previously described [20].
Statistical analysis
Statistical analyses were carried out using Statistical Package for Social Sciences version 20 (SPSS, Chicago, IL). The data was normally distributed. Quantitative data were presented as mean ± standard deviation (SD). Normally distributed data were compared between the two major groups using independent samples t test and between other groups. Probability (p) values < 0.05 were considered statistically significant. The receiver operating characteristic (ROC) curves of different matrices of the tumoural and peritumoural regions were done with calculation of the area under the curve (AUC). The optimum cut-off values of different metrics of tumoural and peritumoural regions with the highest accuracy were selected to differentiate grade II from grade III gliomas were calculation of accuracy, sensitivity, and specificity. The multivariate linear regression analysis was done for variables that reached a p value of 0.05 for the best combination of TBF and ADC metrics in the tumoural and peritumoural regions used to differentiate grade II from grade III gliomas.
RESULTS
Based on histopathological results, the patients were divided into grade II gliomas (Figure 1) (n = 19) and grade III gliomas (n = 17). Table 1 shows the mean, standard deviation, minimum, maximum, TBF, and ADC of tumoural and peritumoural regions of grade II and grade III gliomas. Table 2 shows the ROC results of TBF and ADC of tumoural and peritumoral regions of grade II and grade III gliomas.
Table 1
Mean, SD, minimum, maximum, p value of TBF and ADC of tumoural and peritumoural regions of grade II and III gliomas
Table 2
ROC of ASL, ADC, and combined parameters at tumoural and peritumoural regions of grade II and grade III gliomas with calculation of AUC, accuracy, specificity, and sensitivity
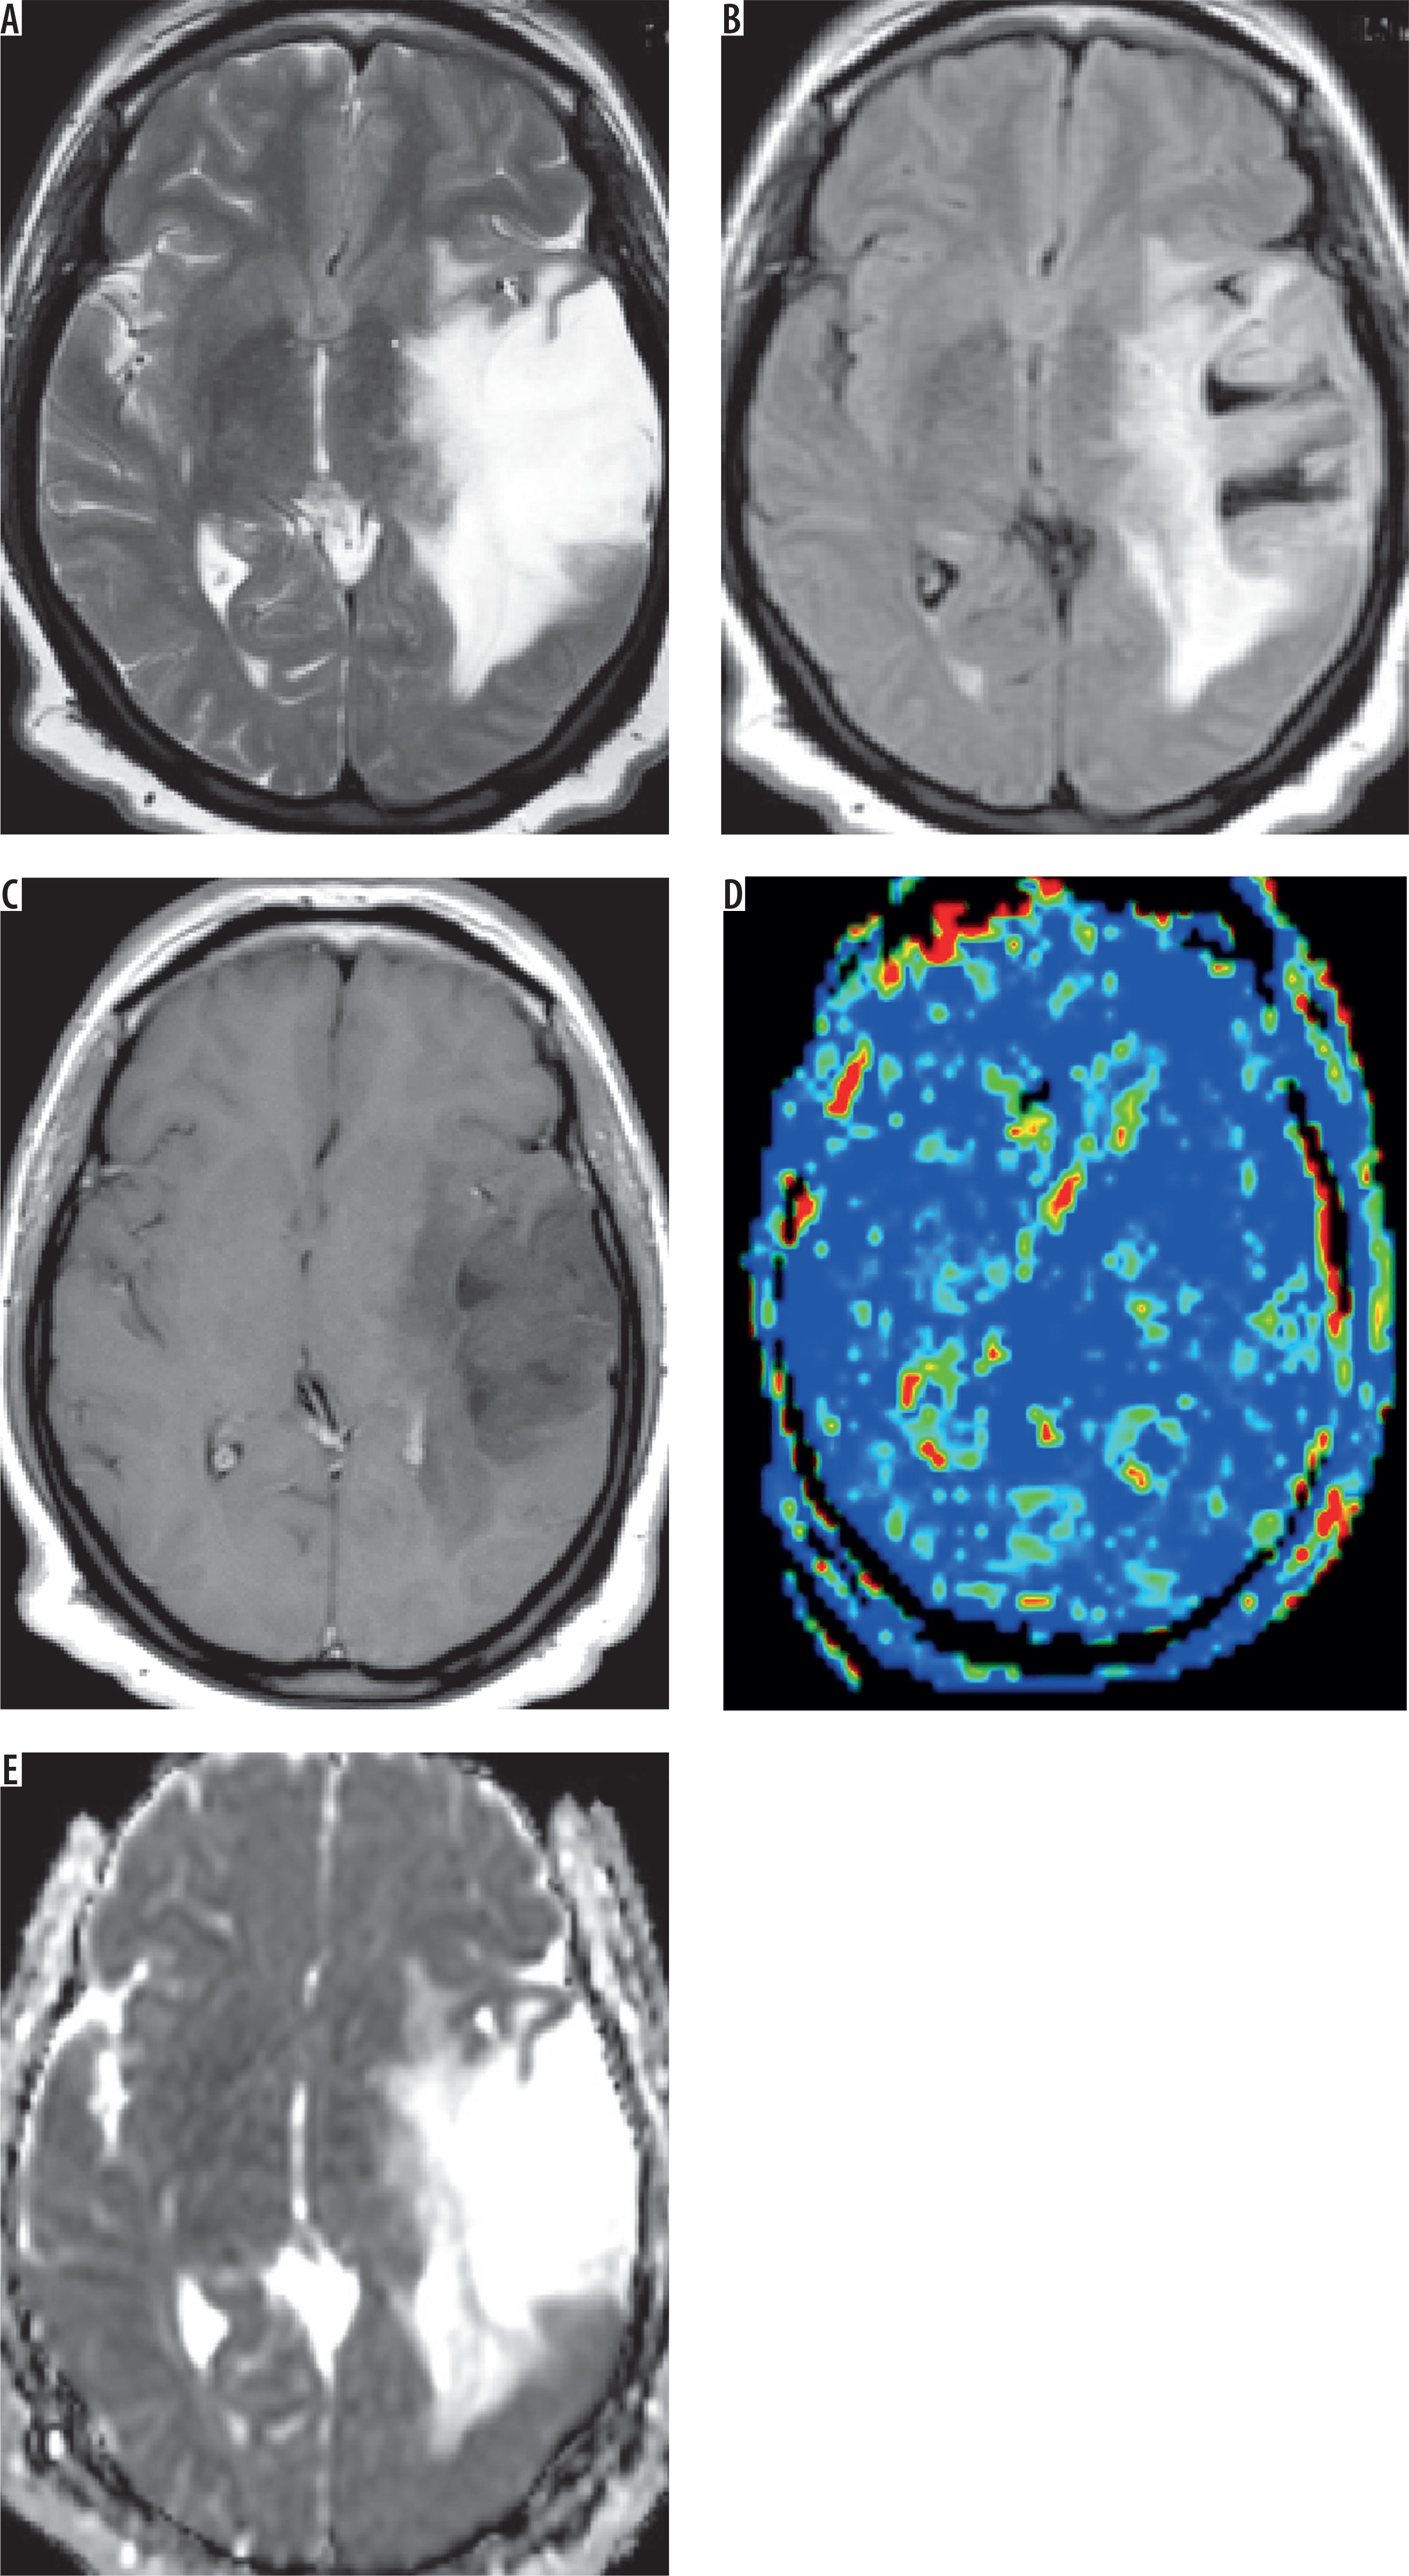
Figure 1
Grade II astrocytoma. A) Axial T2-weighted image shows intraaxial space occupying lesion of abnormal signal intensity seen in the right thalamic region with hyper-intense peritumoral region. B) Axial FLAIR image shows the difference between tumoural and peritumoural region. C) Axial post-contrast T1-weighted image shows faint diffuse enhancement. D) Arterial spin labelling perfusion map show scattered nodular areas of increased signal, and the calculated tumour blood flow of the tumoural and peritumoural regions were 26.3 and 12.7 ml/100 g/min, respectively. E) ADC map shows restricted diffusion, and the calculated ADC value of the tumoural and peritumoural regions were 1.23 and 1.43 × 10⁻³ mm>2/s, respectively
The mean TBF of tumoural and peritumoural regions of grade II glioma were 25.56 ± 3.34 and 13.54 ± 1.48 ml/100 g/min, and for grade III glioma they were 27.98 ± 2.98 and 16.54 ± 1.06 ml/100 g/min, respectively, with a significant difference (p = 0.02 and p = 0.001). Selection of 26.1 and 14.8 ml/100 g/min as the cut-off values of TBF of the tumoural and peritumoural regions to differentiate between the two groups revealed AUC of 0.69 and 0.957, accuracy of 77.8% and 88.9%, sensitivity of 82.4% and 94.1%, and specificity of 73.7% and 84.2%, respectively (Figure 2).
Figure 2
ROC curve of tumour blood flow (TBF). Selection of 26.1 ml/100 g/min as a cut-off point of TBF at the tumoural region to differentiate grade II from grade III gliomas revealed AUC of 0.69 and an accuracy of 77.8%. Selection of 14.8 ml/100 g/min as a cut-off point of TBF at the peritumoral region to differentiate grade II from grade III gliomas revealed AUC of 0.957 and an accuracy of 88.9%

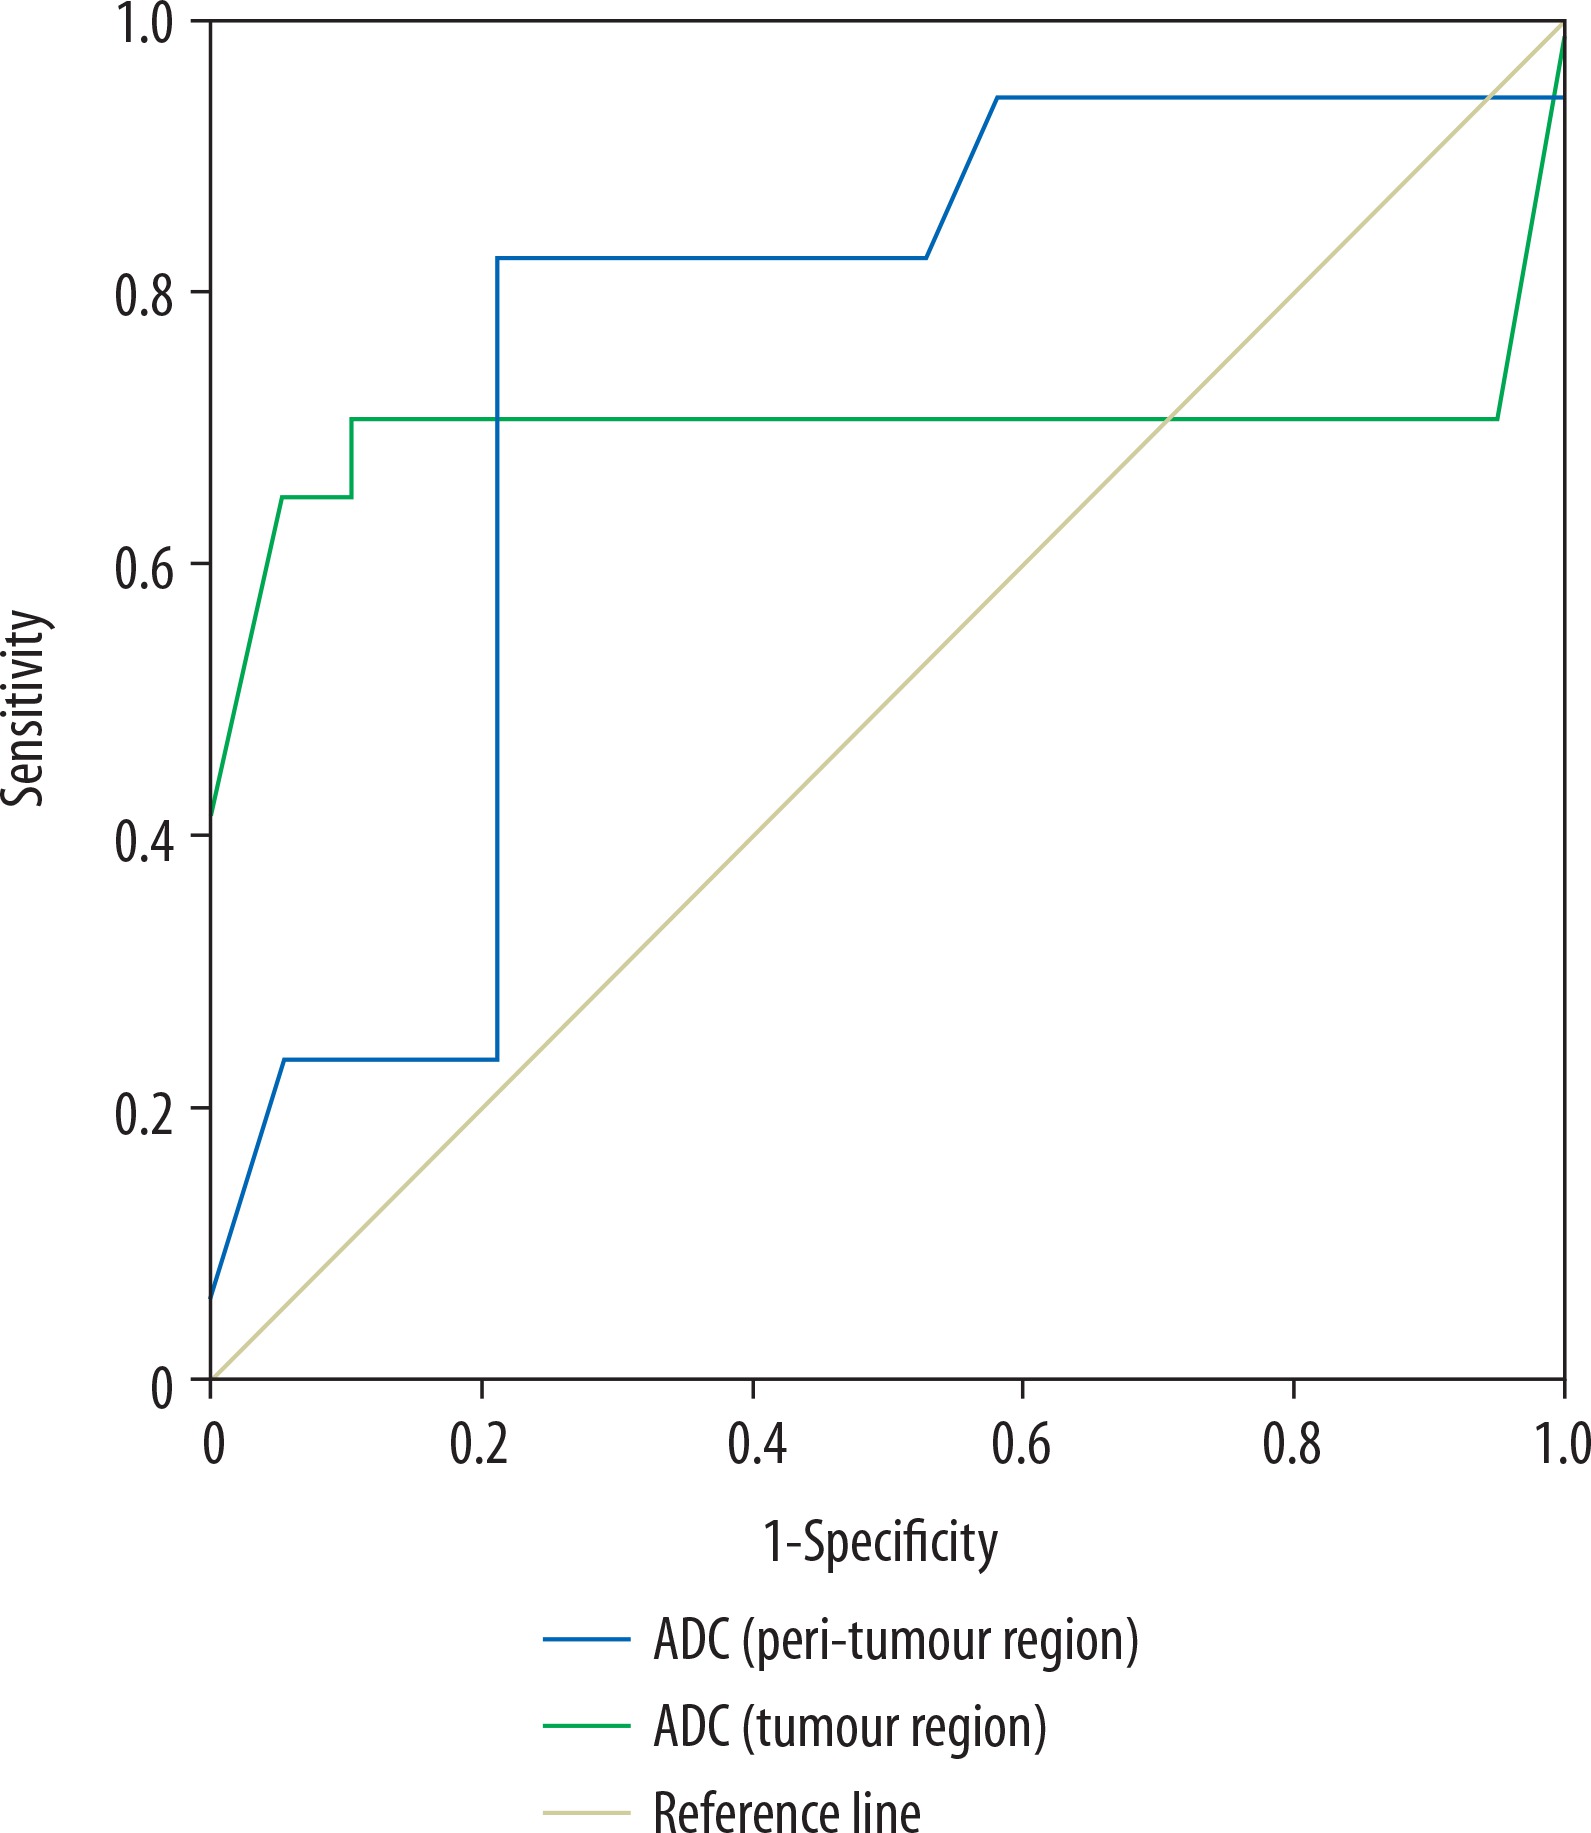
The mean ADC of tumoural and peritumoural regions of grade II gliomas were 1.18 ± 0.11 and 1.52 ± 0.21 × 10⁻³ mm2/s, and for grade III gliomas they were 1.05 ± 0.22 and 1.37 ± 0.16 (10-3 mm2/s), respectively, with a significant difference for both regions (p = 0.02). Selection of 1.06 and 1.36 × 10⁻³ mm2/s as cut-off values of ADC of the tumoural and peritumoural regions to differentiate between grade II and III gliomas revealed AUC of 0.701 and 0.748, accuracy of 80.6% and 80.6%, sensitivity of 70.6%, 82.6%, and specificity of 89.5% and 78.9%, respectively (Figure 3).
Figure 3
ROC curve of apparent diffusion coefficient (ADC). Selection of 1.06 × 10⁻³ mm2/s as a cut-off point of ADC of tumoural region to differentiate grade II from grade III gliomas revealed AUC of 0.701 and accuracy of 80.6%. Selection of 1.36 × 10⁻³ mm2/s as a cut-off point of ADC of peritumoural region to differentiate grade II from grade III gliomas revealed AUC of 0.748 and an accuracy of 80.6%
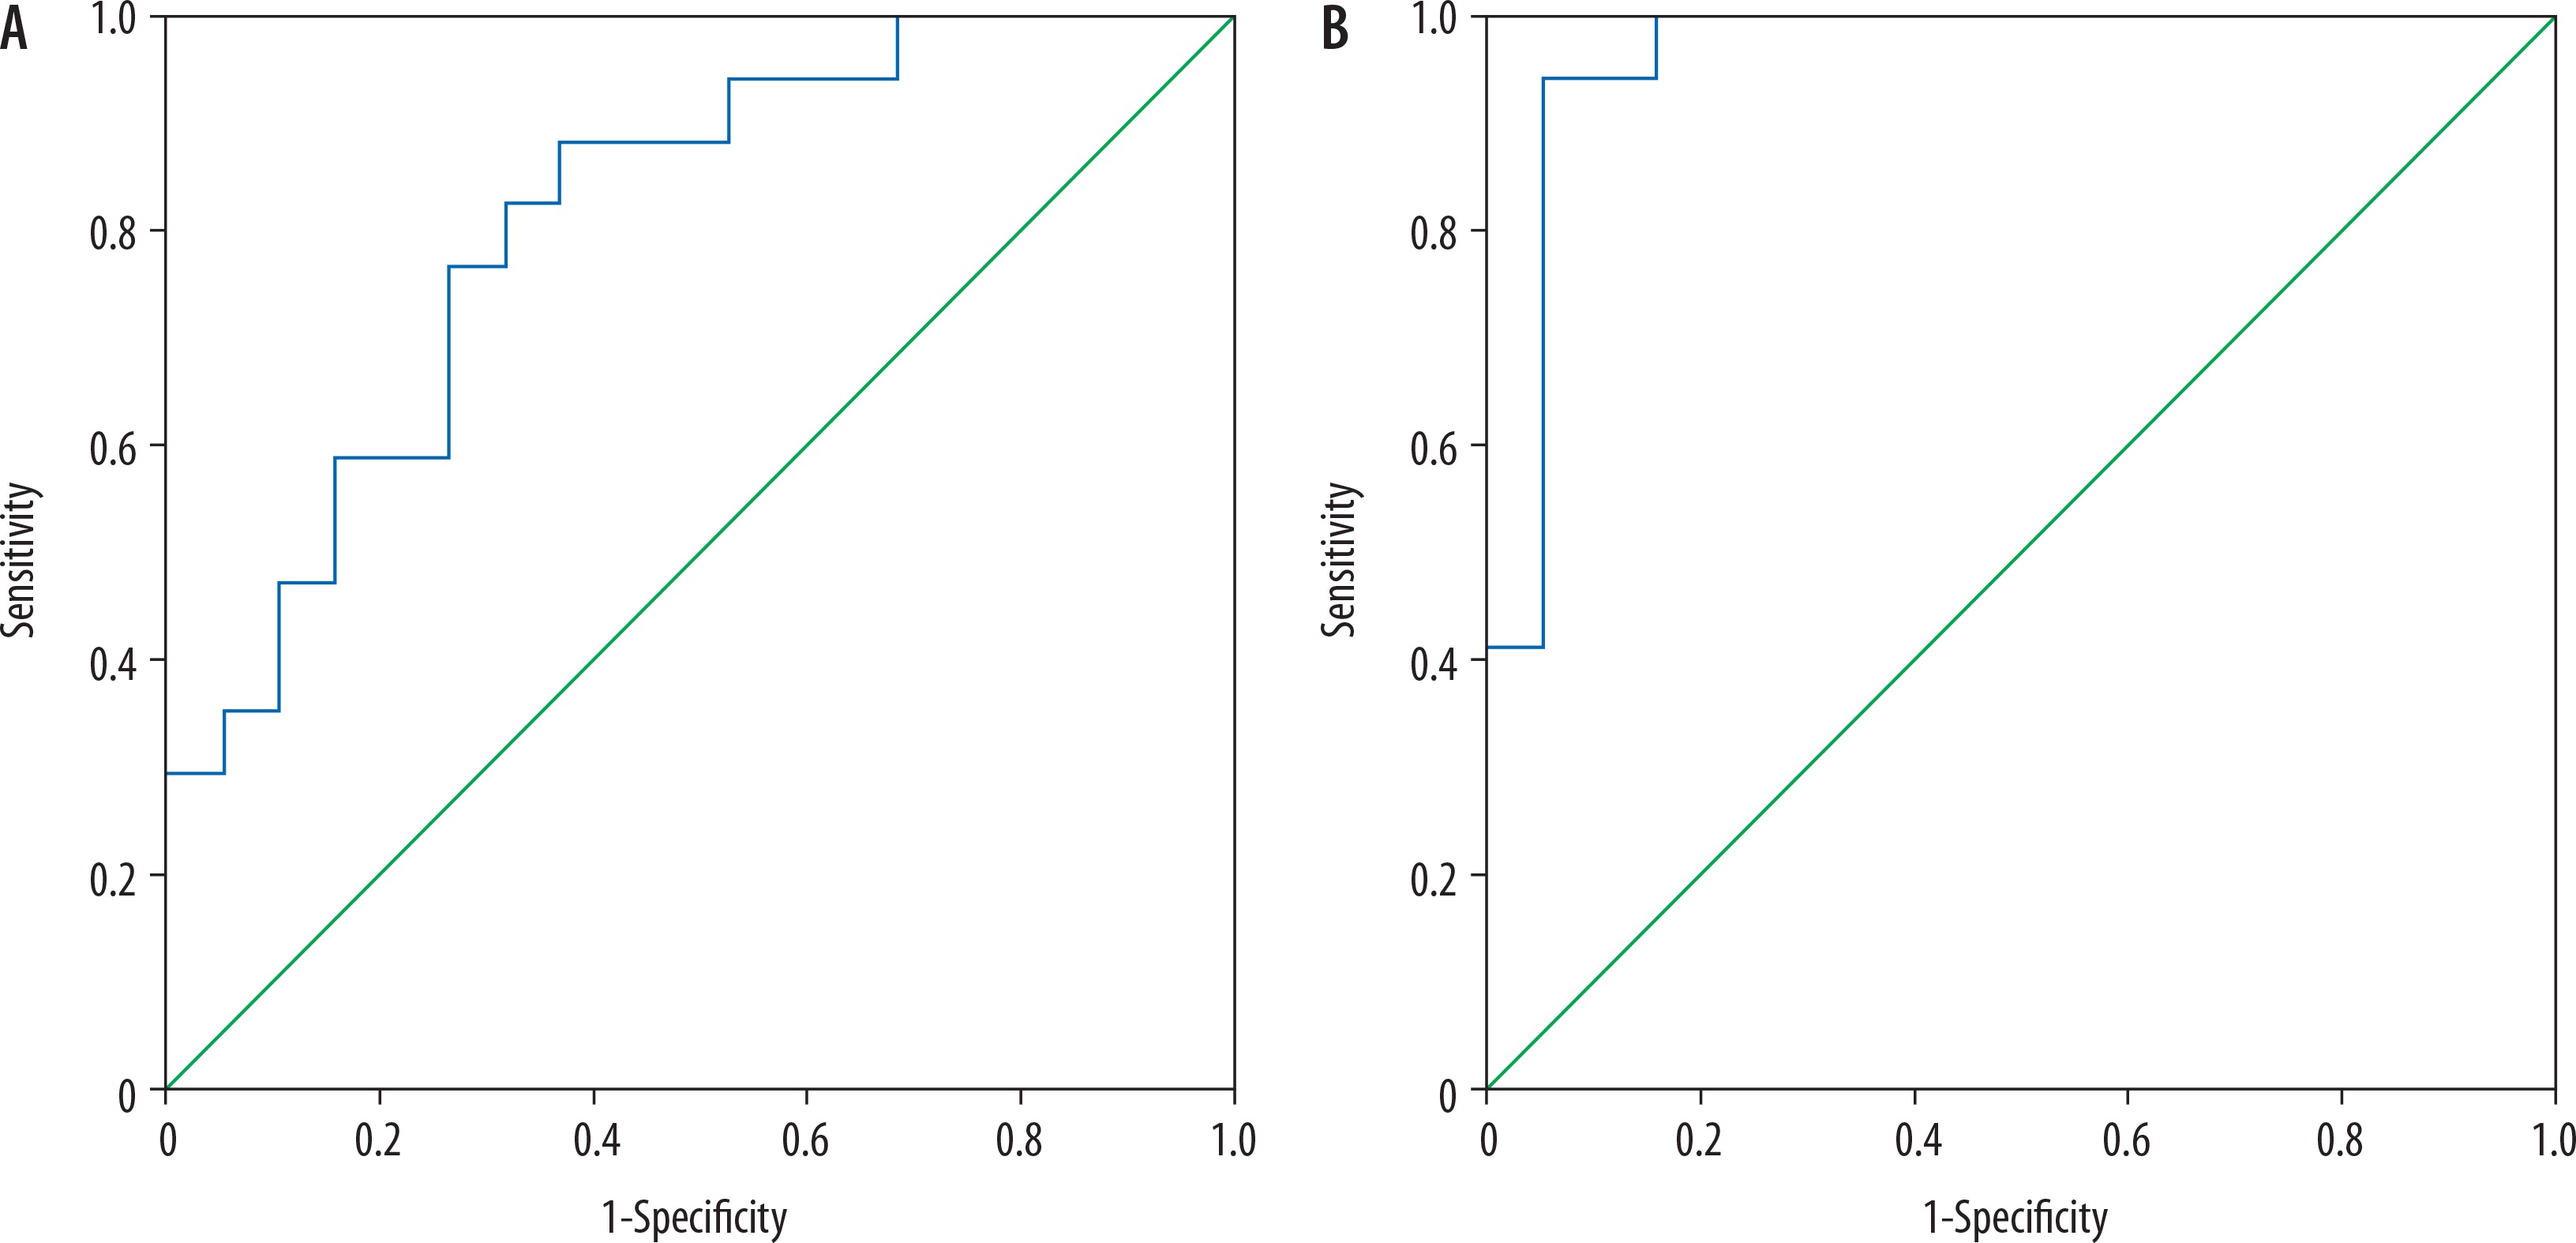
Combined TBF and ADC of the tumoural region used for differentiation of grade II from grade III gliomas revealed AUC of 0.808, accuracy of 2.7%, sensitivity of 70.6%, and specificity of 73.7%. Combined TBF and ADC of the peritumoural region used for differentiation of grade II from grade III gliomas revealed AUC of 0.96, accuracy of 94.4%, sensitivity of 94.1%, and specificity of 94.1% (Figure 4).
Discussion
The main findings in this study are that there is significant difference in TBF of tumoural and peritumoural regions of grade II and grade III gliomas (p = 0.02 and p = 0.001, respectively). There is a significant difference in ADC of tumoural and peritumoral regions between grade II and grade III gloms (p = 0.02). Multi-parametric TBF and ADC of the tumoural and peritumoural regions increased the diagnostic performance of MR imaging in differentiation of grade II and grade III gliomas. This study is different from other multi-parameter studies because we used two advanced MR sequences without the application of contrast medium, which reflects the cellularity and vascularity of the gliomas.
In this study, there was slightly significant difference of TBF of the tumoural region differentiating grade II from grade III gliomas (p = 0.02), while the peritumoural region TBF measures revealed a highly significant difference between both groups (p = 0.001). Other studies done using ASL techniques distinguishing high- from low-grade gliomas based on tumoural region measurements revealed higher CBF in high-grade than in low-grade gliomas with highly significant difference [20,22,24]. Another study added that the use of ASL-normalised vascular intratumoural signal intensity values allows differentiation between low-grade and high-grade gliomas and thus may serve as a new, non-invasive marker for astrocytoma grading [23]. One study revealed that TBF by ASL enabled discrimination of astrocytomas with and without IDH mutation (p = 0.014) and trial for discrimination astrocytomas with IDH mutation from oligodendrogliomas (p = 0.074) [21].
In this study, there was a lower ADC value of the tumoural and peritumoural regions of grade III gliomas compared to grade II, with a slightly significant difference of ADC values measured in the tumoural region differentiating grade II from grade III gliomas (p = 0.02). One study reported that the ADC value calculated from ADC maps obtained from high b values is a better imaging biomarker in the grading of gliomas [29]. Other studies reported that lower ADC values are used to discriminate high- from low-grade gliomas [30,33]. Another study using DTI technique showed a significant difference in ADC measured at the tumoural region (p = 0.001), while measurements at the peritumoural region showed only a less significant difference (p = 0.042) [32].
In this study, multi-parametrics of TBF and ADC measured at tumoural and peritumoural regions of gliomas increased the diagnostic performance of grading of gliomas. The best combination for differentiation between grade II and III gliomas is the TBF of the peritumoural regions, showing an accuracy of 94.4% with AUC 0.96. Another study reported that the combination of ASL and conventional MR imaging gave good performance, with a diagnostic accuracy of 81.40% [24].
The advantages of ASL are the absolute values of perfusion of tissue by blood, without injected contrast agent or ionising radiation [20-28]. The advantages of diffusion-weighted MR imaging are its non-invasive, rapid nature, which gives information about cellularity of the tumours, and without injection of contrast agent [34-39].
There are some limitations to this study. First, the small number of patients limits the statistical results. We recommended further studies with larger numbers of patients. Second, this study was done using a 1.5 Tesla scanner. Further studies using a 3 tesla scanner are recommended to improve the results. Third, this study used ASL and ADC; further studies with application of diffusion tensor imaging [40-42], perfusion MR imaging [43-47], and proton MR spectroscopy [48-50] will improve the grading of gliomas. Fourth, there was no genetic correlation. Further studies with correlation of genetic studies and the molecular classification introduced by the 2016 WHO classification will help to better characterise diffuse gliomas.