


Introduction
The greater trochanter (GT) is a unique anatomical site, which provides attachments to hip abductors and lateral rotators; namely, gluteus medius, gluteus minimus, piriformis, superior and inferior gemelli, and obturator externus and internus. Additionally, it is covered by 3 large bursae: the greater trochanteric bursa, subgluteus medius bursa, and sub gluteus minimus bursa [1,2]. Insertional tears, enthesopathy, and bursitis involving the aforementioned bursa are a prevalent cause of lateral hip pain, collectively referred to as greater trochanteric pain syndrome [3-5]. Furthermore, the GT is a common site for tendinopathy, including calcific tendinitis [6-8].
Although soft tissue pathologies around the GT predominate as a causative factor of lateral hip pain, the greater trochanter is also a common anatomical site to be involved by a myriad of bony lesions.
The GT lesions can be divided into traumatic, inflammatory, infective, and neoplastic, including primary bone tumours ranging from benign to aggressive and metastases. Imaging, in the form of radiographs and MRI in particular, is crucial in narrowing down the differential diagnosis of GT lesions. In some cases, imaging methods, as mentioned earlier, can provide a final diagnosis; however, in most of the cases, the final diagnosis can only be ascertained with an image-guided biopsy.
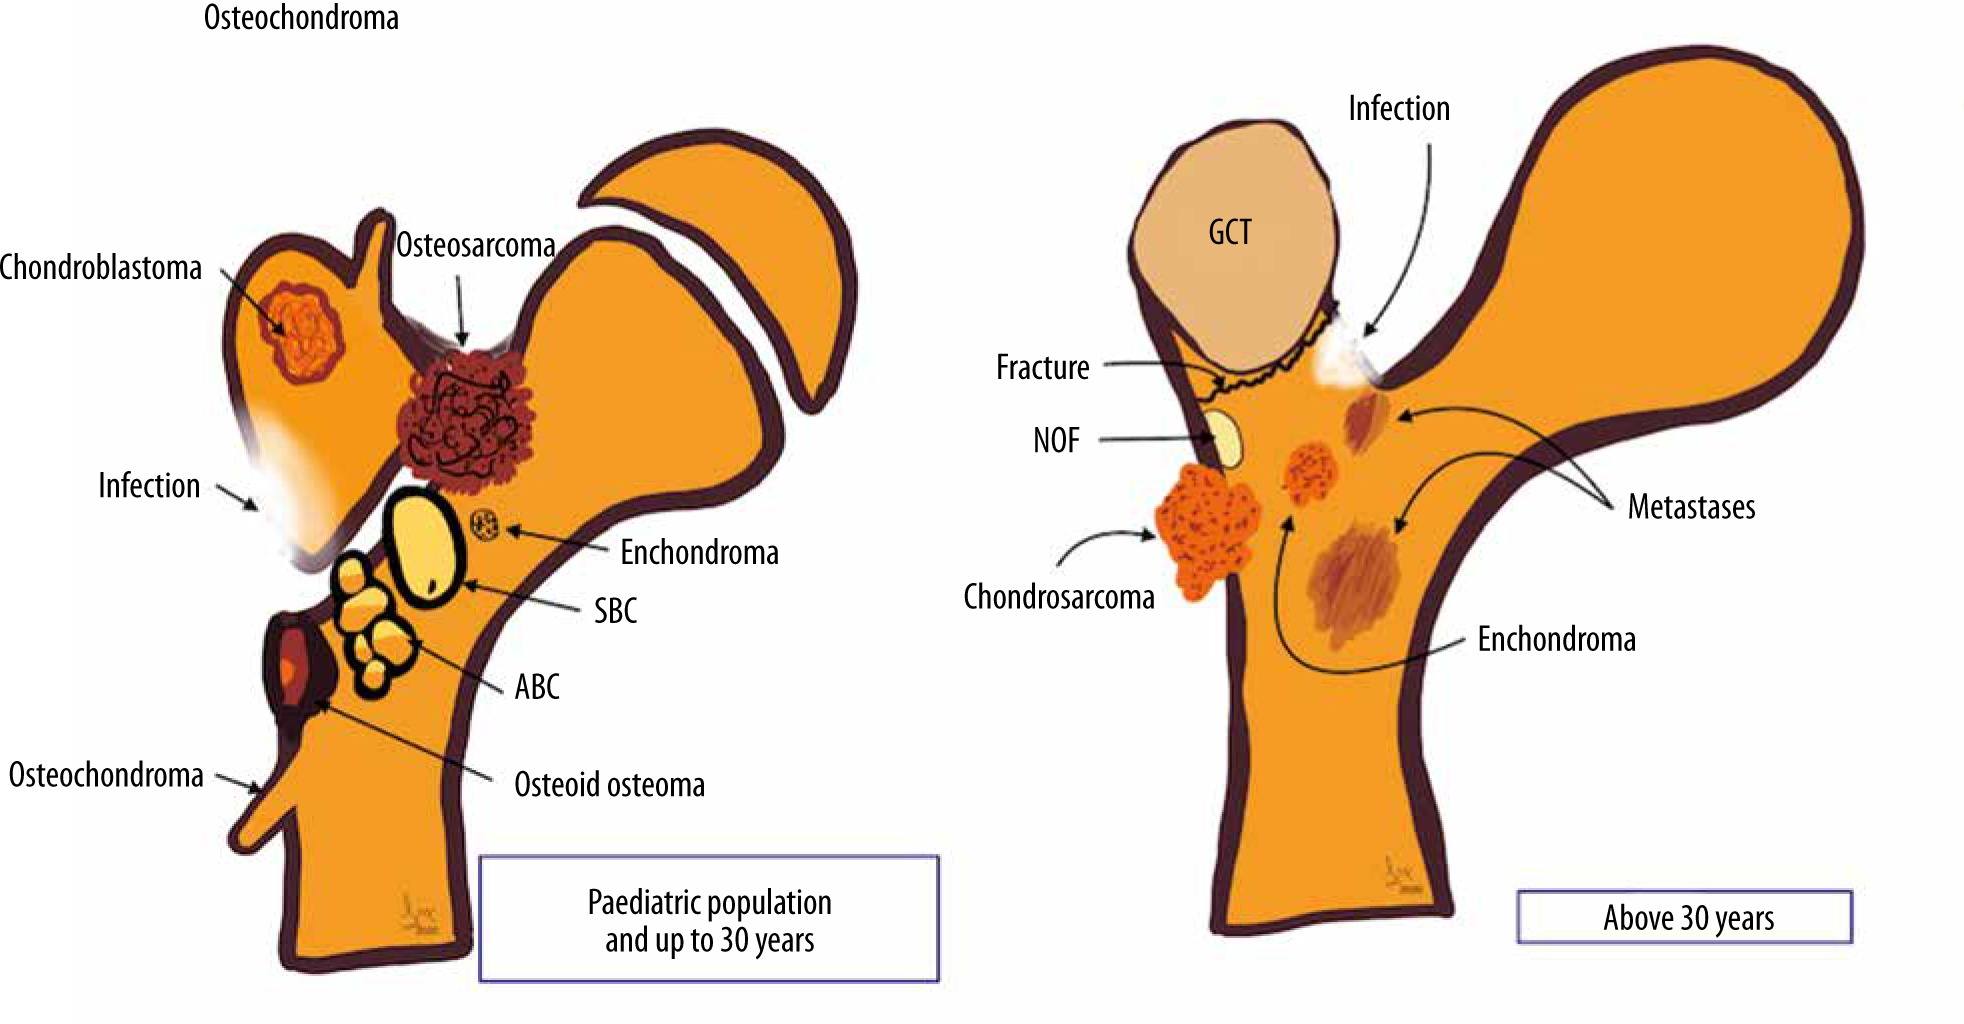
In this article, we review a spectrum of osseous pathologies, primarily affecting the greater trochanter. We illustrate the imaging appearance of different GT lesions with an emphasis on radiographs, which were supplemented with further imaging as necessary. Furthermore, we have provided a graphical representation of various GT lesions (Figure 1).
Material and methods
After institutional review board approval as a service evaluation, a retrospective search was performed using ‘greater trochanter’ and ‘GT’ as keywords of the computerised radiology information system (CRIS) database of our tertiary orthopaedic oncology centre spanning the preceding 12 years (2007-2019). This revealed 6019 reports involving these keywords. Various pathologies were identified involving the GT, including 101 neoplasms. We used the WHO classification of bone tumours [9] to describe the GT lesions. A musculoskeletal radiologist with a special interest in bone and soft tissue oncology reviewed the imaging features of all cases where neoplasms were identified. Demographic data, diagnosis, imaging features, and histology (where available) were also collected and analysed.
Results
We identified 101 patients with a spectrum of pathologies involving the GT. The mean age of the cohort was 51.5 years (range 6 to 85 years). There was a female predominance of 1.2 : 1, with 46 (45.54%) males and 55 (54.46%) females.
We divided the patients according to age at presentation into age above or below 30 years for further simplification because neoplasms diagnosed in the first 3 decades differ significantly from those occurring in the over 30 age group. 26 (25.74%) lesions were found in patients with age less than 30 years with the remaining 75 (74.26%) lesions seen in patients over 30 years of age.
Of the 26 lesions found in those less than 30 years of age, diagnoses included 6 patients with chondroblastoma, 3 each of chronic recurrent multifocal osteomyelitis and Ewing’s sarcoma, 2 each of osteomyelitis, Brodie’s abscess, and fibrous dysplasia, and 1 patient each with tuberculous osteomyelitis, sickle cell osteitis, aneurysmal bone cyst, giant cell tumour, osteoid osteoma, osteosarcoma, and soft tissue sarcoma. The diagnosis was inconclusive in 1 patient (Table 1).
Table 1
Different pathologies in the patient cohort below (and including) 30 years of age (n = 26)
Of the 75 lesions involving GT in patients over 30 years of age, 38 were metastases from various primaries (lung being the most common followed by breast) (Table 2B) and the remaining 37 showed a plethora of neoplasms including 6 lymphomas, 5 chondrosarcomas, 4 giant cell tumours (including one with secondary aneurysmal bone cyst), 4 reactive lesions, 2 cases each of osteomyelitis, fibro-osseous lesion, and myeloma. One case of fibrous dysplasia, melanoma, soft tissue sarcoma, osteosarcoma, dermatofibrosarcoma protuberans, and pseudolucency were also found. For 7 cases, the final histology was inconclusive (Table 2A).
Table 2A
Different pathologies in the patient cohort above 30 years of age
Discussion
The greater trochanter, although anatomically unique, is surprisingly similar in its osseous contours moulded according to the attaching muscles to the humeral head where attachment of the rotator cuff tendons shapes the contours of the greater and the lesser tuberosity. The greater trochanter has 4 distinct facets, 3 of which show specific tendon attachment sites. MR axial images are the best with which to evaluate GT anatomy in detail. The anterior facet on axial MR image lies just lateral to the hip capsule attachment, which gives attachment to the gluteus minimus tendon. Posterosuperior and lateral facets are more laterally oriented, and one can usually follow them craniocaudally on axial images. They give attachment to a large gluteus medius tendon, which demonstrates significant overlap with the gluteus minimus anterior, as seen with supraspinatus and infraspinatus conjoined tendon formation at the greater tuberosity attachment. The posterior facet, on the other hand, is completely devoid of tendon attachment and appears curved on axial MR images. It is covered by the greater trochanter bursa and is the usual anatomical site for greater trochanter pain syndrome in addition to subgluteus minimus and subgluteus medius bursa and subsequent injections [2]. A complete spectrum of degenerative pathologies including tendinosis, partial-thickness and full-thickness tear can be seen involving glutei entheses. The GT is also a common site for crystalline enthesopathy, such as calcific tendinitis.
For the purposes of this pictorial review, GT lesions can be divided into traumatic, infective, inflammatory, and neoplastic. Although most of the imaging features of the lesions are similar to those occurring at other anatomical sites, there are a number of salient features that are worthy of mention. Infective lesions are usually associated with typical clinical features of high-grade fever, malaise, redness, restriction of joint movements, supported by high leukocyte count and blood cultures. Inflammatory lesions generally involve enthesis organ and have a symmetrical appearance with features of bone erosion or proliferation at the entheses. It is not unusual to find other anatomical sites demonstrating similar imaging appearances in inflammatory pathologies. One should give careful consideration to the patient’s age, associated previous medical history, mode of presentation, and haematological-microbiological findings whilst evaluating the imaging of the suspected tumour. Benign lesions, on imaging, are generally well-defined and show a narrow zone of transition, no aggressive periosteal reaction or cortical destruction or soft tissue tumoral component. Conversely, aggressive tumours usually demonstrate poor definition, a wide zone of transition, permeative pattern, aggressive periosteal reaction, cortical destruction, and adjacent soft tissue masses. When in dilemma, one should have a low threshold for MRI and image-guided biopsy if required following multidisciplinary discussion. In this article, we will revisit the salient features of a variety of lesions involving the GT.
Infective
Osteomyelitis involves the GT by 1 of 3 possible routes: haematogenous spread, direct implantation, and continuity. Haematogenous spread is the most frequent cause of GT osteomyelitis in the paediatric population. Amongst adults, the haematogenous spread is usually seen in immunocompromised individuals such as intravenous drug abusers, immunosuppressed individuals (AIDS or congenital immunodeficiency syndromes), or those receiving systemic chemotherapy. Typically, haematogenous osteomyelitis involves metaphyses and GT involvement in children by virtue of the unfused apophy-seal centre and extension from the adjacent metaphysis. In adults, orthopaedic interventions such as total hip replacement or the treatment of femoral neck fractures may lead to direct implantation of infection as a complication of surgery.
Acute bacterial osteomyelitis
Acute bacterial osteomyelitis is a clinico-haemato-radiological diagnosis. The most common organism involved is Staphylococcus aureus, followed by beta-haemolytic streptococci. Imaging is crucial in planning appropriate management.
In early cases, radiographic findings are usually limited to often-overlooked soft tissue swelling followed by bone rarefication and periosteal reaction. In unfused GT, widening of the apophysis can also be seen.
MR imaging can be considered the gold-standard imaging for acute osteomyelitis for diagnosis and whilst evaluating specific circumstances such as response to antibiotic treatment, suspected abscess formation, and pelvic or spine involvement. T2 fat-suppressed, or short-tau inversion-recovery (STIR) images are particularly helpful in detecting extensive signal changes which are a combination of infected bone marrow and surrounding reactive oedema. Additionally, MRI can also detect soft tissue inflammatory changes and help to differentiate phlegmon from abscess formation [10] (Figure 2).

Subacute osteomyelitis (Brodie’s abscess)
If inadequately treated, acute osteomyelitis may evolve into subacute osteomyelitis (Brodie’s abscess). Although Brodie’s abscess typically involves the medullary cavity of the metaphysis of a long bone, it may primarily arise from or involve the GT.
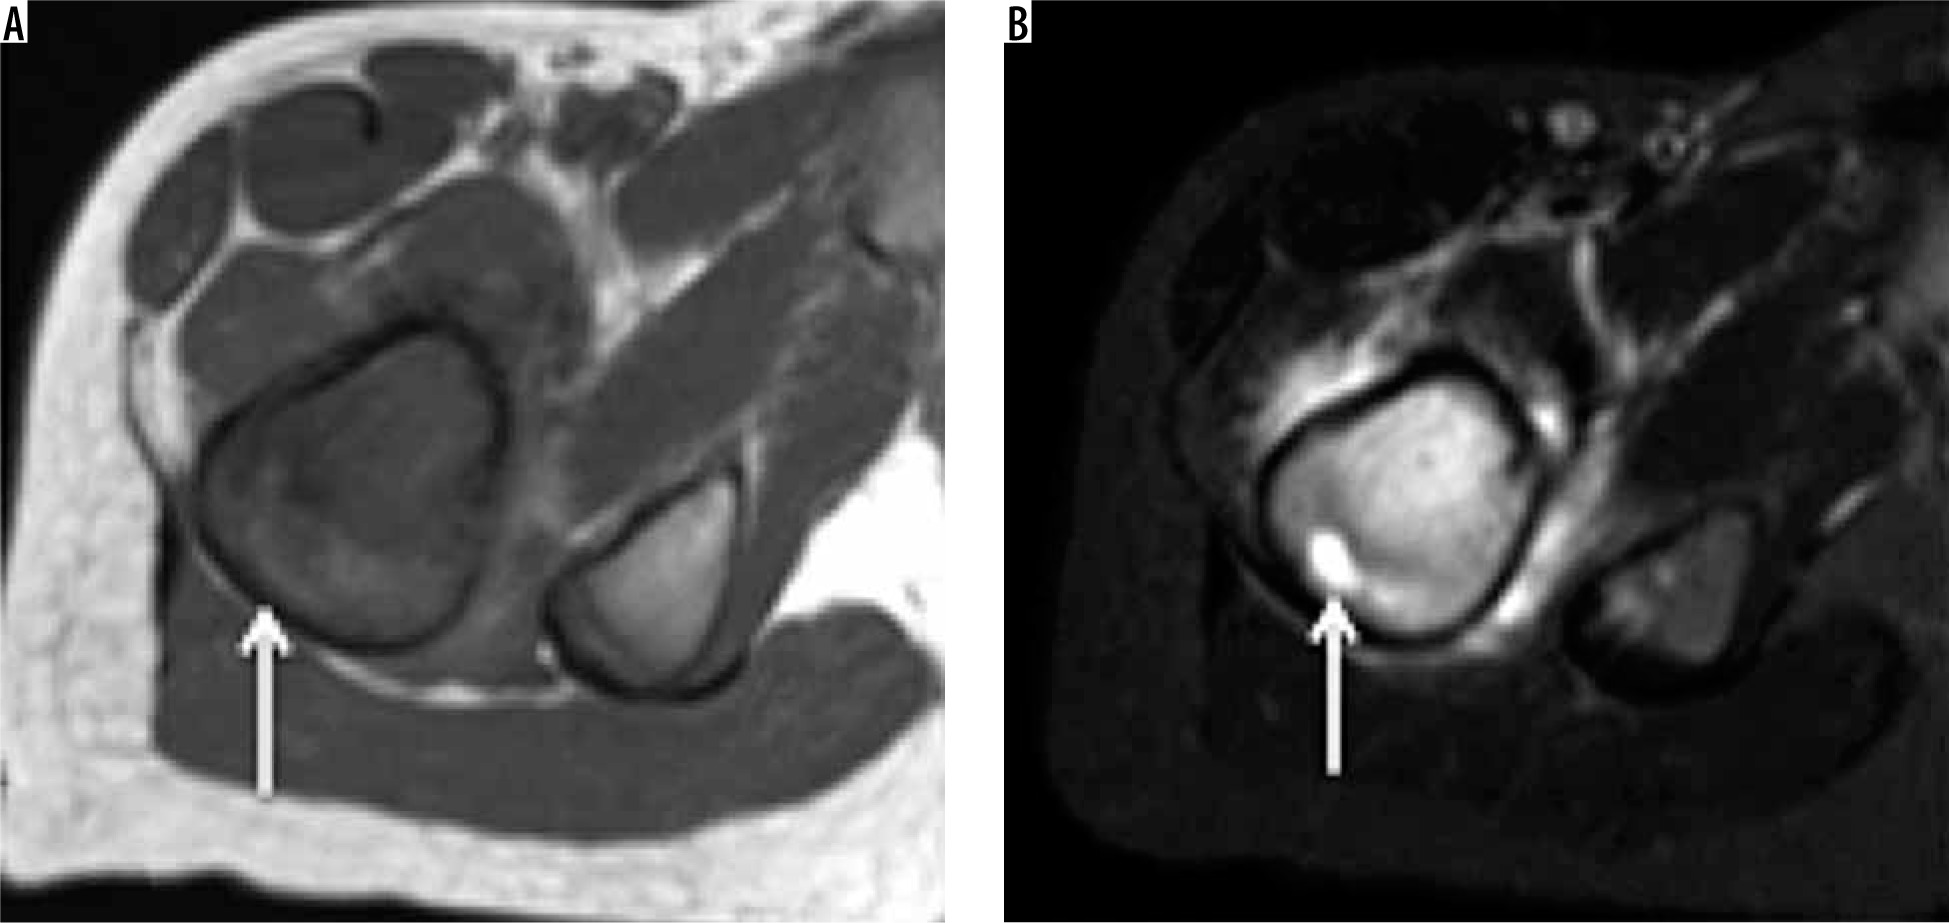
On radiographs, it usually presents as a well-defined osteolytic lesion with a surrounding rim of sclerosis. On MRI, it can show a four-layered structure [11] with a ring of T1 shortening known as the ‘penumbra sign’ [12] (Figure 3).
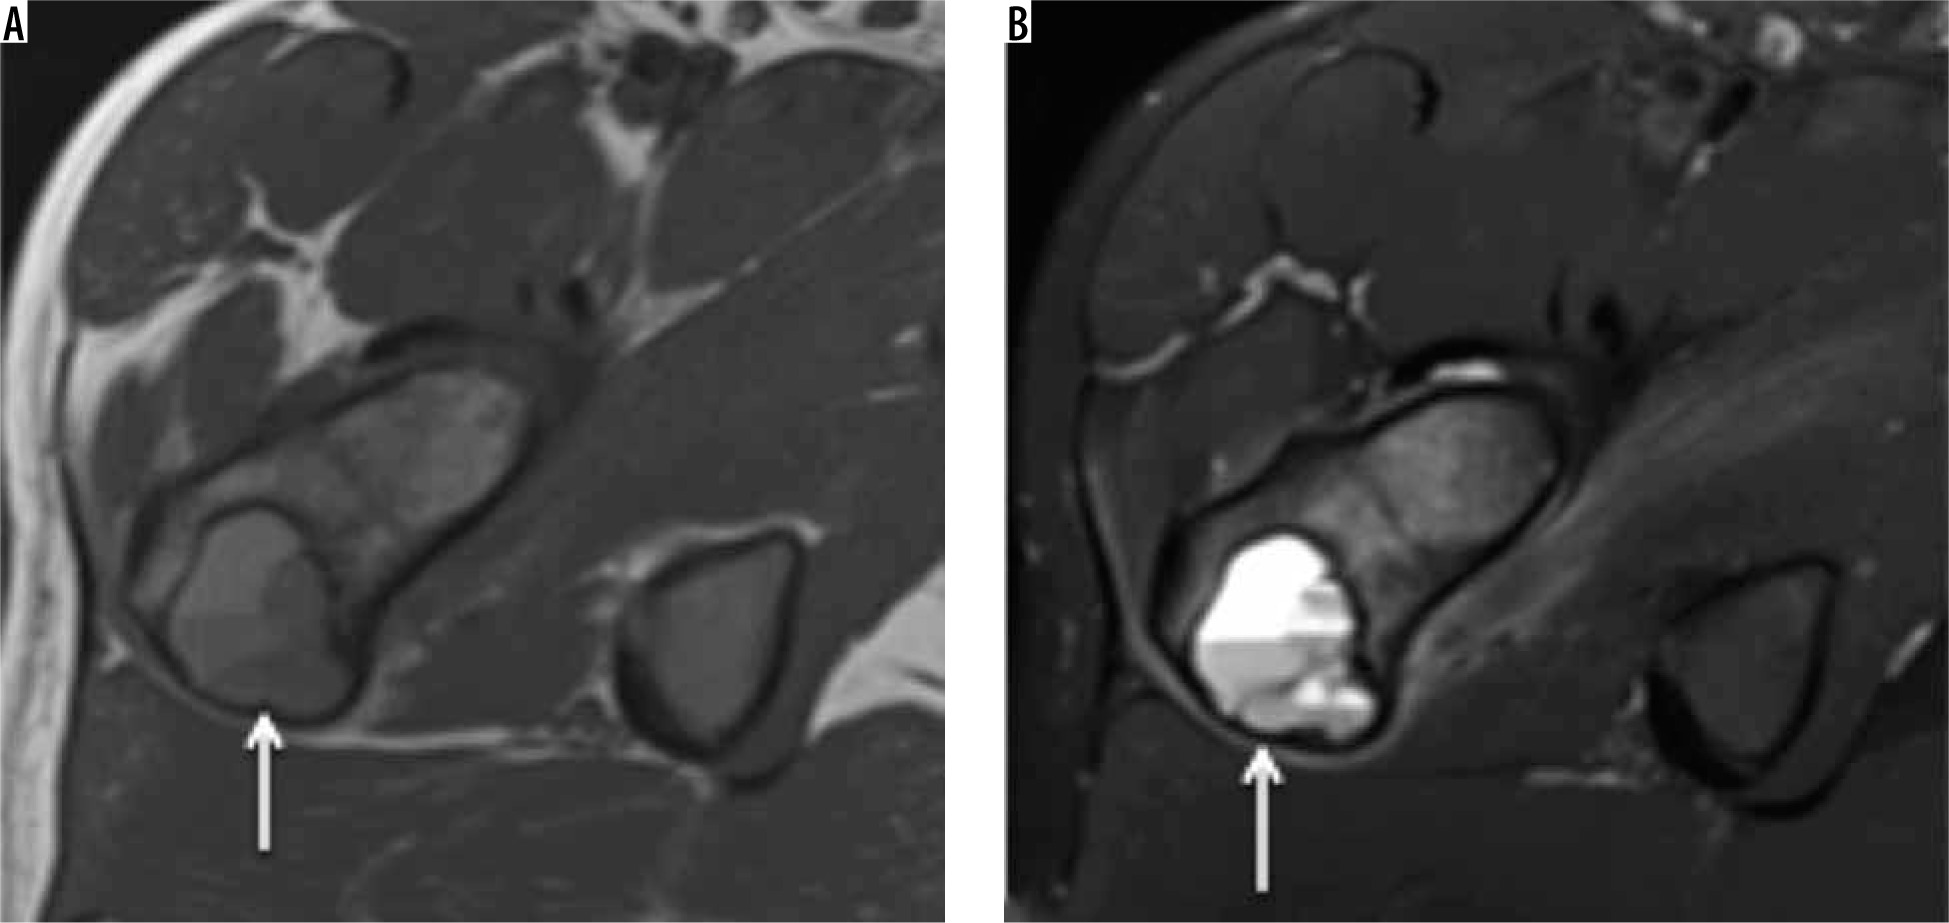
Figure 3
Brodie’s abscess: Axial T1-weighted (A) and STIR (B) showing Brodie’s abscess as a well-formed focus of liquified centre (arrow) surrounded by marked bone marrow oedema which spills over to adjacent muscles attaching onto the greater tuberosity. Please note that there is no soft tissue component on the T1-weighted image, and the surrounding cortex is also maintained on T1-weighted and STIR images
Tuberculosis
Tubercular involvement of the GT is a rare occurrence mostly as a part of multifocal osteoarticular tuberculosis, and this constitutes only 0.2-2% of the total occurrence. Haematogenous seeding of M. tuberculosis to the trochanteric bursa with secondary bony involvement or direct osseous seeding from a primary source may occur in trochanteric tuberculosis [13].
Imaging findings of GT tuberculosis are non-pathognomic. Radiographs may demonstrate osteopaenia of the GT in early cases and cortical erosions or osseous destruction in advanced cases mimicking a neoplasm. Chronic tuberculous osteomyelitis may show flecks of irregular calcification within the GT (Figure 4) and sequestra which are better demonstrated on CT. MRI is the imaging method of choice to evaluate the site and extent of the disease, osseous and soft tissue extent, and antitubercular treatment response and as preoperative imaging in refractory cases [14]. The final diagnosis is by microbiological/histological findings, i.e. tubercular culture, synovial or bone biopsy.
Figure 4
Tuberculosis (TB): AP radiograph showing destruction of the greater trochanter with few of the trabeculae showing reactive sclerosis and amorphous calcification along the muscular planes. It is extremely difficult to differentiate from tumour based on radiographic appearances alone or even on MRI. Biopsy was performed, which confirmed TB (Image courtesy of Dr Parang Sanghvi, Jankharia Imaging Centre, Mumbai, India)
Chronic recurrent multifocal osteomyelitis
Chronic recurrent multifocal osteomyelitis (CRMO) is a multifocal syndrome of unknown pathogenesis primarily affecting the immature skeleton. Characteristic features of CRMO include clinical course (chronic, intermittent, or recurrent symptoms), imaging findings (metaphyseal lesions), histologic findings (chronic inflammation without liquefaction), and microbiological findings (lack of pathogen detection).
Whole-body MRI (WB-MRI) is considered as the imaging of choice for diagnosis of CRMO. Typical WB-MRI findings of CRMO include multifocal, geogra-phic, T2-weighted fat-suppressed, or STIR hyperintense lesions centred over the metaphyses of the lower extremity growth plates (including GT apophyses) (Figure 5) showing either bilateral symmetrical involvement or additional involvement in the spine, pelvis, clavicle, and/or sternum [15].
Benign
Simple bone cyst
Simple bone cyst (SBC) is a benign osseous lesion, showing male predominance (M:F = 2-3 : 1) seen in the first or second decade of life. SBC has a predilection for long bones, and the proximal femur is the second most common site after the proximal humerus for SBC. These 2 anatomical sites account for more than 80% of the cases. The lesions are usually asymptomatic and are found incidentally. Pathological fracture through the lesion is the most common complication and a frequent cause of presentation.
On radiographs, the appearance of SBC is usually classic, depicted as a metaphyseal, solitary, radiolucent, expansile lesion with marked cortical thinning, oblong lesion along the longitudinal axis of the long bone, demonstrating a narrow zone of transition without periosteal reaction. Some SBCs may show partial septations. There may be a small bone fragment gravitated at the bottom of the lesion through intracystic fluid, considered as a pathognomic ‘fallen fragment’ sign if there is an associated fracture [16]. CT may be useful in demonstrating thin-walled lesions with a pseudo-septum. The primary use for CT is to measure cyst wall thickness and to assess the risk of pathological fracture. If uncomplicated by fracture, SBC follows fluid signal (T1 hypointensity and T2 hyperintensity) on MRI.
Aneurysmal bone cyst
Rarer than SBC, aneurysmal bone cyst (ABC) demonstrates a slight female predominance. ABC are locally aggressive neoplasms that can be primary or secondary. Primary ABC most frequently affects patients in their second decade of life, uncommon beyond 30 years and rare beyond 50 years of age. It is usually solitary. The proximal femur is the most common anatomical site for ABC.
On radiographs, ABC can be seen as metaphyseal, eccentric, expansile, radiolucent, multiloculated lesion containing fine cystic cavities. Loss of cortical contours, soft tissue extension, and periosteal reaction suggest an underlying neoplasm or more aggressive form.
MRI is the investigation of choice for the evaluation of ABC, which usually demonstrates an expansile, multiseptated lesion containing fluid-fluid levels on T2-weighted images due to internal haemorrhage (Figure 6). Gadolinium-enhanced MR imaging may be helpful to differentiate ABC from telangiectatic osteosarcoma [17,18].
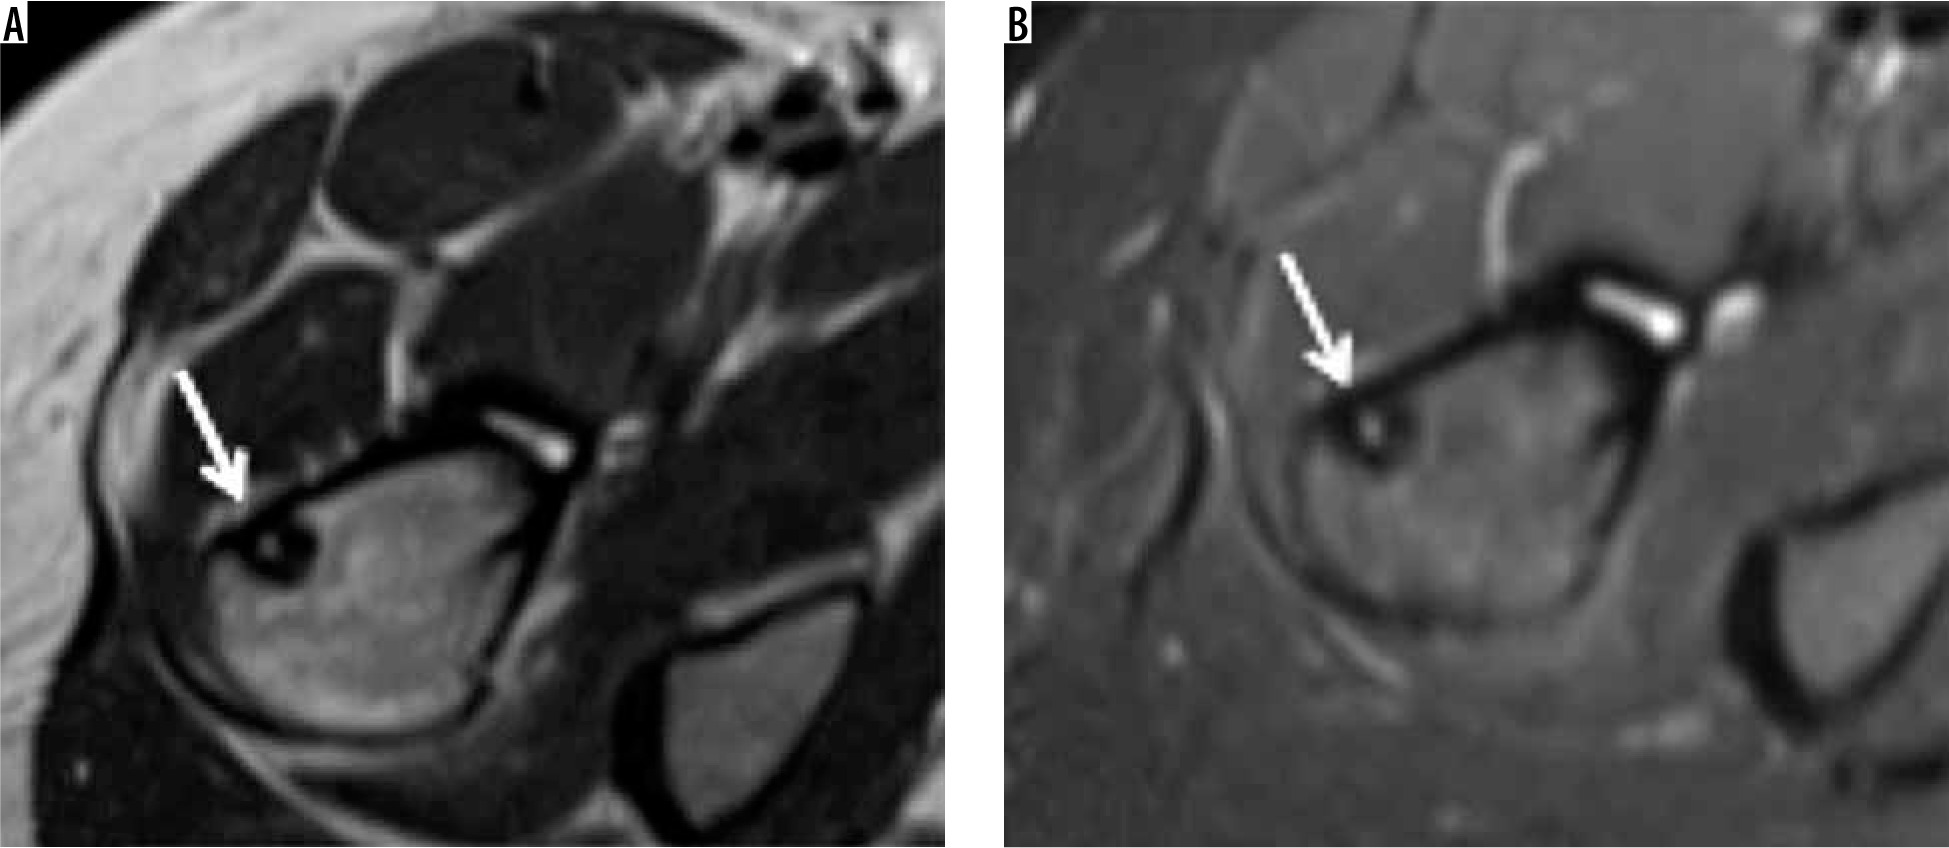
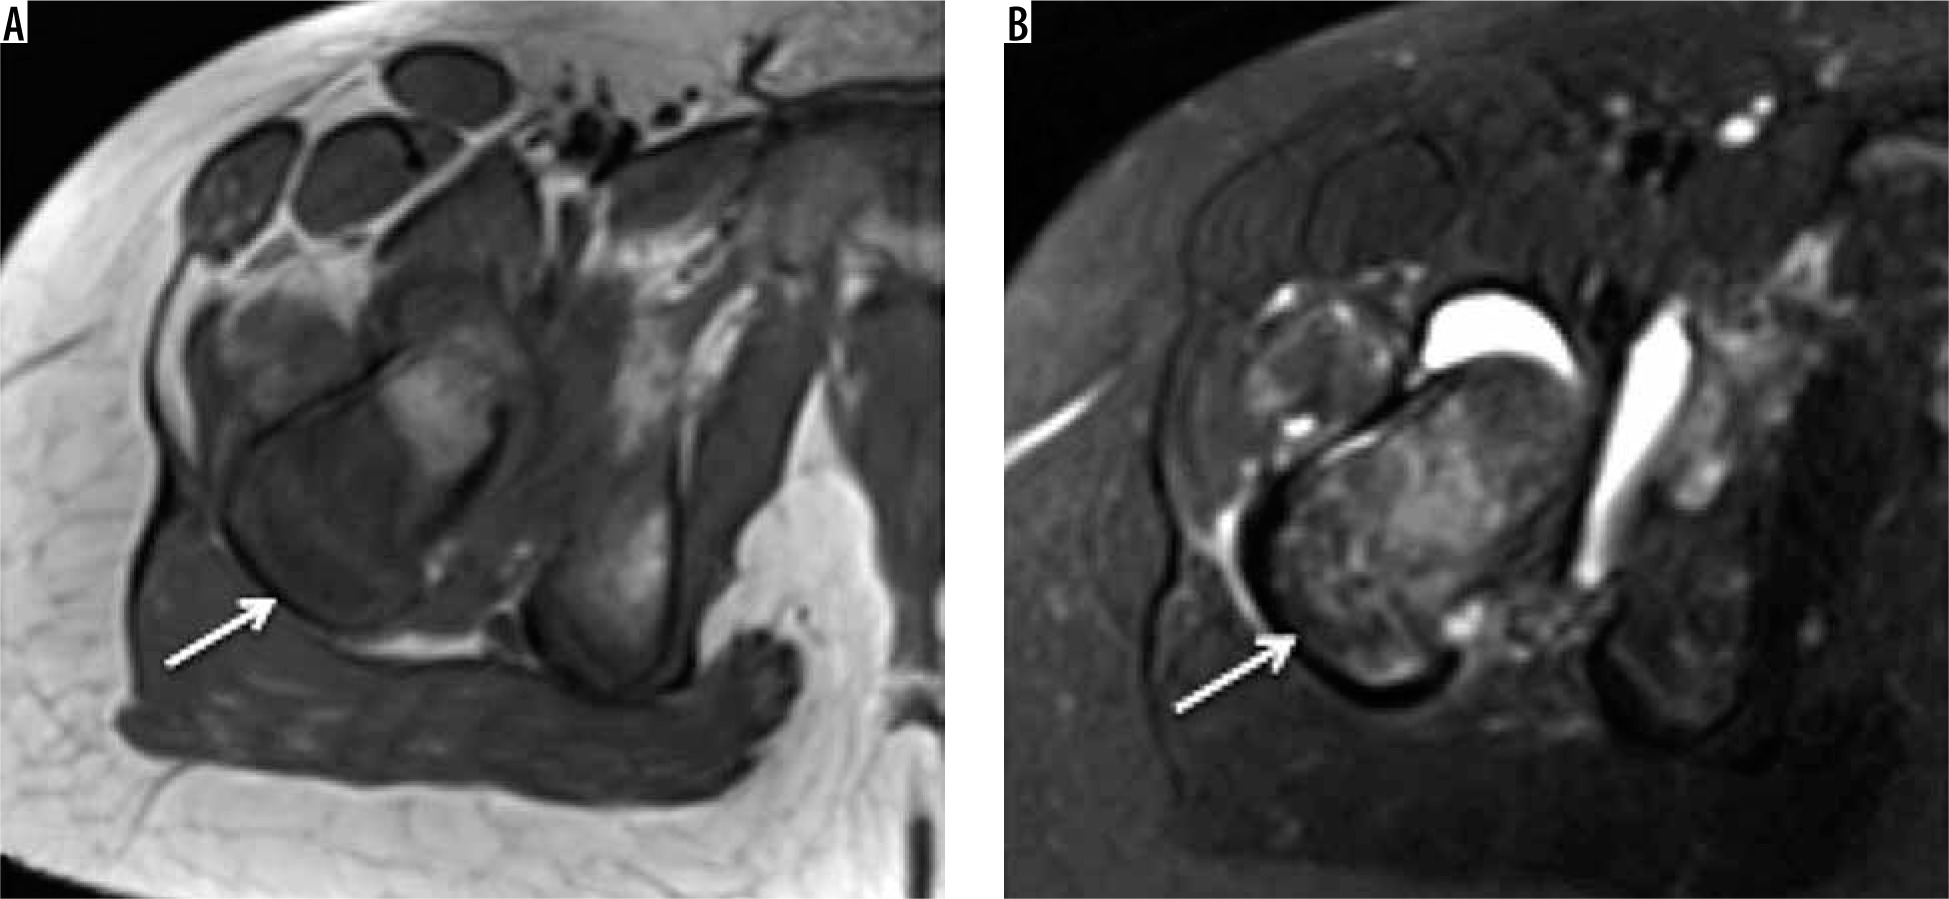
Figure 6
Aneurysmal bone cyst: Axial T1-weighted (A) and STIR (B) showing well-defined corticated cystic appearing expansile lesion showing fluid-fluid levels on STIR and variable fluid signal on the T1-weighted image but no overt soft tissue component. Aneurysmal bone cyst (arrow) involving the greater tuberosity
Osteoid osteoma
Osteoid osteoma is a frequent benign osseous neoplasm representing approximately 12% of all benign skeletal neoplasms. The average age of presentation is 19 years, with the usual age range of presentation from 10 to 35 years. There is a male predominance with a ratio of 1.6-4.1 : 1. Presenting almost invariably with nocturnal pain typically relieved by salicylates, osteoid osteoma can involve virtually any bone in the body. Depending upon its location within the bone, osteoid osteoma can be medullary, cortical, or subperiosteal. Amongst particularly affected long bones, involvement of the femur is the most common anatomic location.
Osteoid osteoma usually appears as a lesion showing a characteristic radiolucent ‘nidus’ of less than 1 cm surrounded by a rim of reactive bony sclerosis. If subperiosteal in location, it can show the periosteal reaction of solid or laminated variety depending upon its activity. CT scan can detect the nidus with a higher accuracy compared to radiographs and is vital if radiofrequency ablation is attempted. Bone scintigraphy shows a pathognomic ‘double-density’ appearance [19]. MRI, considered inferior to CT in the diagnosis of osteoid osteoma, can show marrow oedema and soft tissue changes (Figure 7). However, MRI should not be interpreted without reference of radiographs or CT to avoid misinterpretations [20].
Giant cell tumour
Giant cell tumour (GCT) is a benign tumour affecting all races with an unusually high prevalence in China and southern India. Benign GCT shows a female predominance with female to-male ratios in the range 1.1-1.5 : 1, whereas malignant GCT is more common in males. GCTs affect skeletally mature patients, with majority of cases being between 20 and 50 years of age. The distal femur is the most common site for GCT, whereas the proximal femur, including the GT, constitutes only 4% of cases [21].
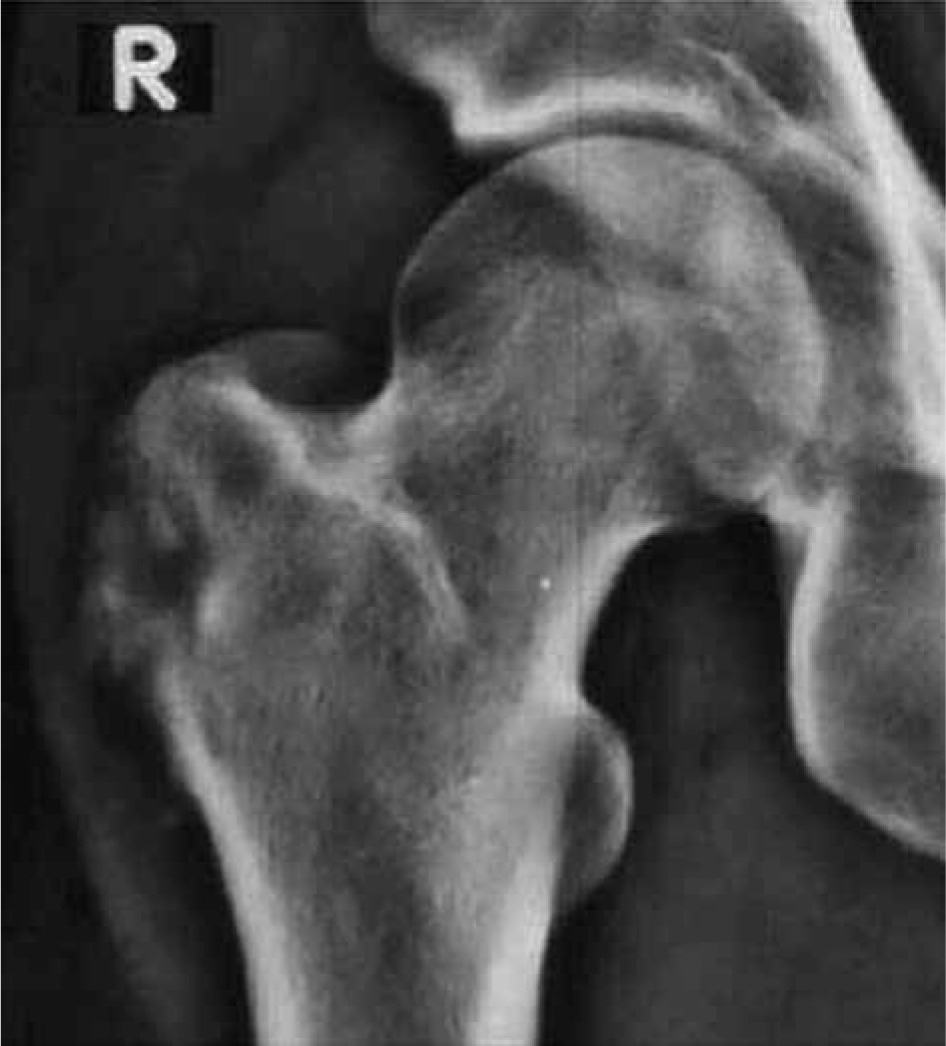
GCT typically demonstrates a geographic pattern of osteolysis, narrow zone of transition and lack of surrounding bony sclerosis on radiographs. GCT is subarticular/epimetaphyseal in location, with marked cortical thinning, and expansion with prominent trabeculation giving a multiloculated appearance (Figure 8). Periosteal reaction is an uncommon feature. Pathological fracture, whether complete or incomplete, can be seen on radiographs. CT is better in detecting cortical thinning, pathological fracture, expansile osseous remodelling, and periosteal reaction, as well as depicting the absence of matrix mineralisation.
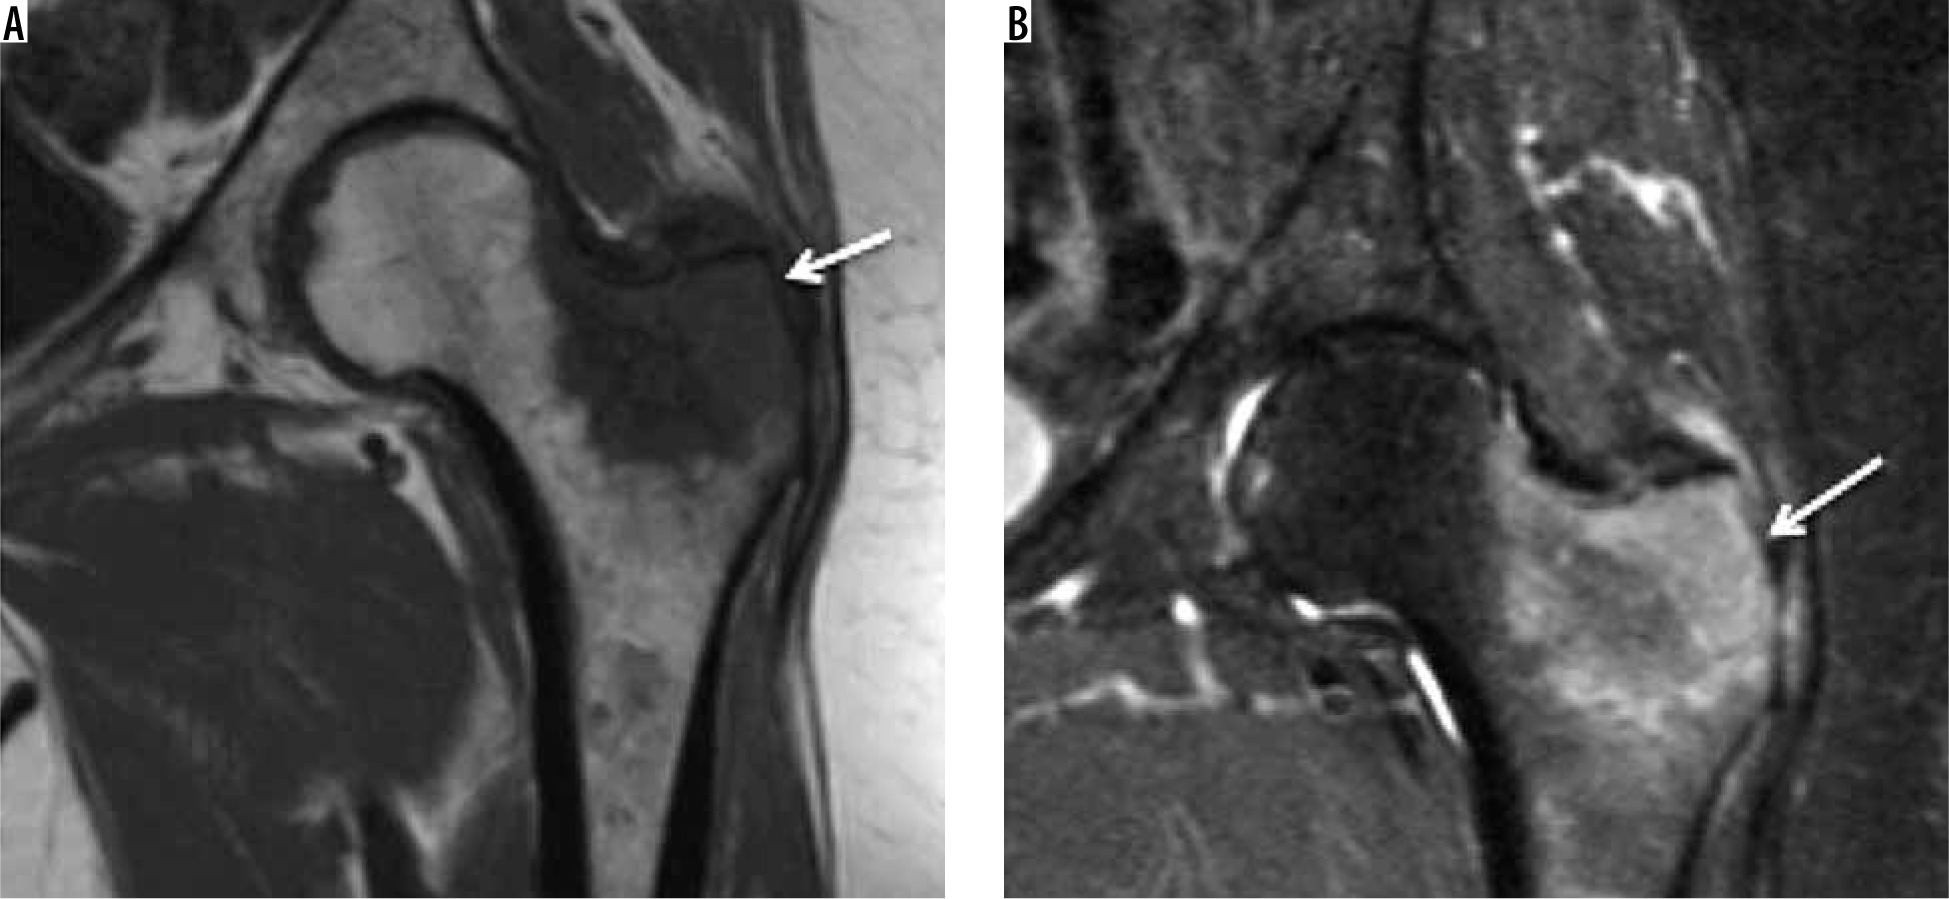
Figure 8
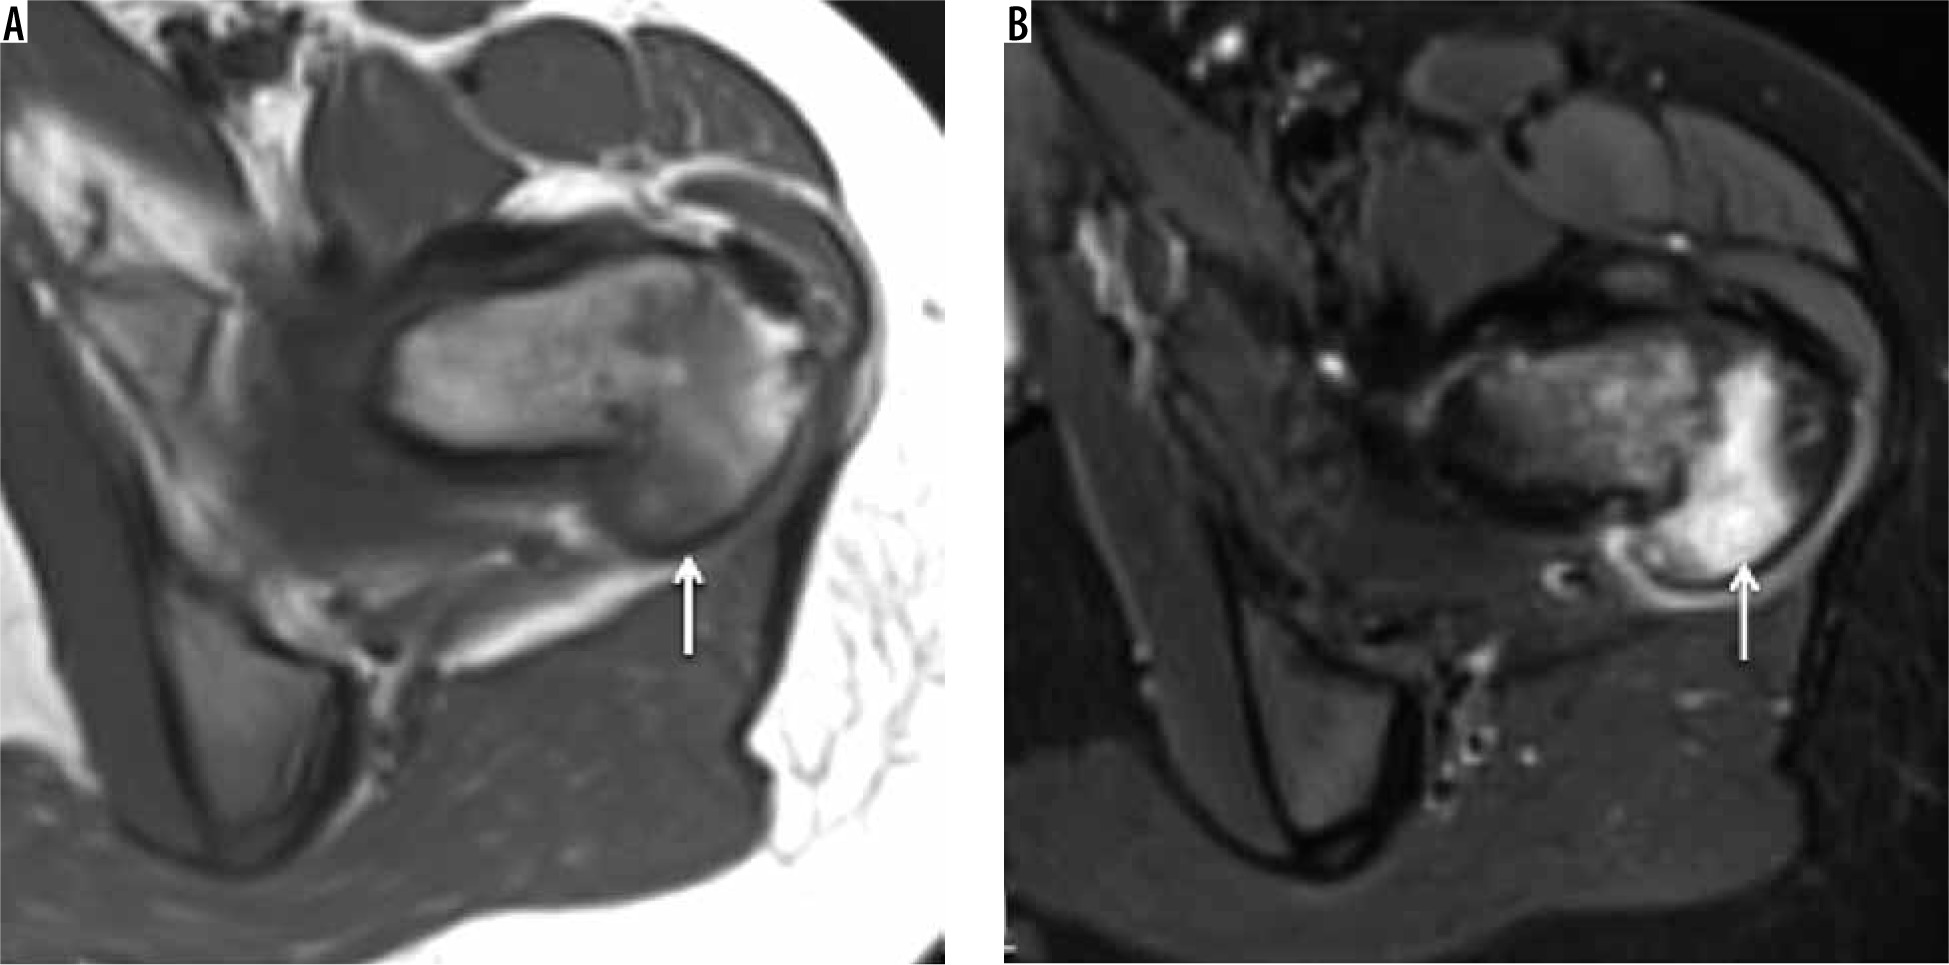
Giant cell tumour: AP radiograph (A) demonstrating mildly expansile lytic lesion involving the greater trochanter and the subtrochanteric region of the femur causing endosteal thinning but no overt cortical breach. Coronal T1-weighted (B) and STIR (C) showing intermediate to hyperintense soft tissue tumour (arrow) involving the greater tuberosity causing its mild expansion along with endosteal scalloping. No appreciable extraosseous soft tissue component or cortical destruction. Mild reactive hip effusion can also be seen on STIR images
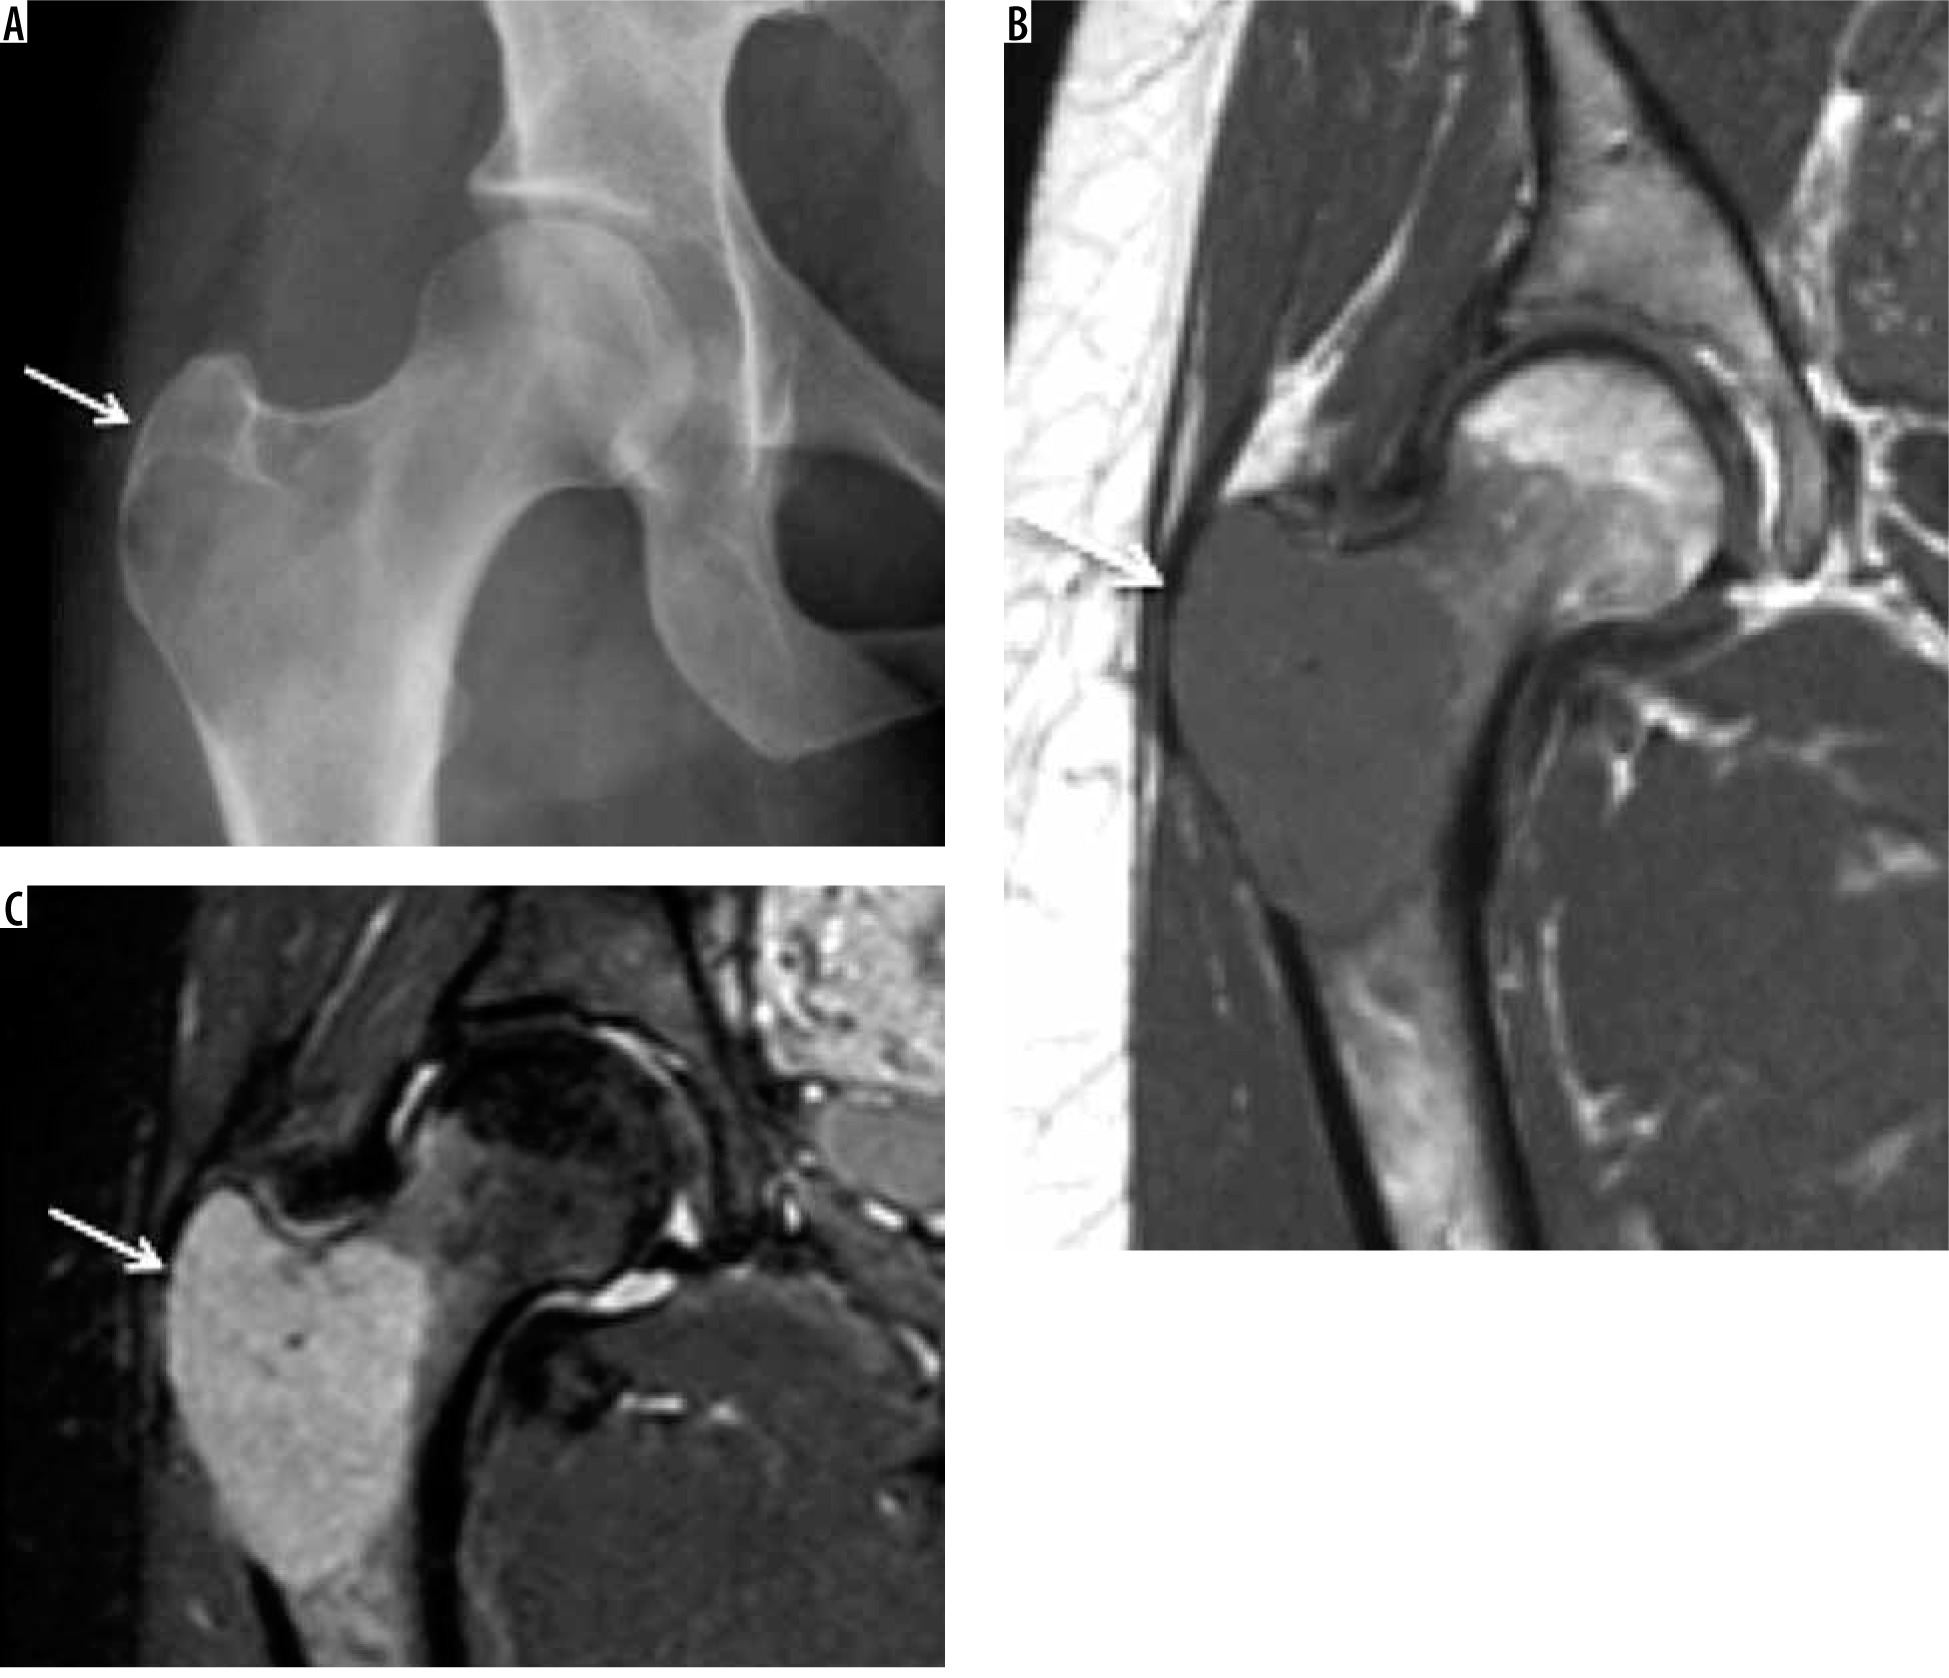
MRI reveals well-defined subarticular lesion showing characteristic T1- and T2-weighted low-to-intermediate signal intensity surrounded by a low signal intensity margin representing either bony sclerosis or a pseudo-capsule. Signal intensity characteristics are particularly helpful in differentiating GCT from other subarticular lesions like subchondral cyst, Brodie abscess, or chondrosarcoma (clear cell variety) [21] (Figure 8).
Enchondroma
Solitary enchondroma is the second most common chondral tumour following osteochondroma. The exact prevalence of enchondroma is underestimated because most enchondromas are asymptomatic. There is no sex predilection, and the lesions are predominantly diagnosed in the third and fourth decades. Tubular bones are the second most common site for enchondroma after the hands. The femur is the most common tubular bone involved, followed by the humerus and the tibia [22].
Radiographic features of femur (tubular bone) enchondroma differ slightly from those of hand enchondromata. Lesions appear centrally or eccentrically in the metaphysis or diaphysis, demonstrating characteristic ‘rings and arcs’ calcification, which may vary according to the extent of chondroid matrix mineralisation. These are less than 6 cm in length and may show shallow endosteal scalloping, mild expansion, and cortical thickening. Periosteal reaction, soft tissue extension, and cortical remodelling and destruction are rare and should raise suspicion of chondrosarcoma [23].
Contrary to enchondroma, tubular bone (GT) enchondroma usually requires cross-sectional imaging like CT or MRI. CT is the imaging method of choice to detect chondroid mineralisation when it is very subtle on radiographs [23].
On MRI, enchondromas appear as a lobular tumour with intermediate signal intensity on T1-weighted images with interspersed high signal intensity within, suggesting surrounded fatty marrow. T2-weighted images, whether fat-suppressed or not, are the best to depict the lobulated nature of the lesion, demonstrating high signal intensity hyaline cartilage separated by low signal thin septae. Foci of T1- and T2-weighted hypo intensities within the lesion represent mineralised matrix, which can be correlated with radiographs or CT [24] (Figure 9).
Figure 9
Enchondroma: AP radiograph (A) showing ill-defined lesion involving the greater trochanter with internal rings and arcs calcification (arrow) and corresponding coronal STIR (B) showing a lesion with variable signal suggesting fluid, soft tissue, and calcified components (arrow) but no overlying cortex destruction or soft tissue component

Chondroblastoma
Chondroblastoma is a rare, benign chondral lesion affecting the paediatric population, involving centres of endochondral ossification, most commonly seen at epiphyses and apophyses of long bones.
On radiographs, chondroblastomas appear as sharply delineated lucent lesions with sclerotic margins limited to epiphyses of the immature skeleton (Figure 10). Matrix mineralisation can be seen in over 50% of such cases and less commonly periosteal reaction. MRI features of the chondroblastoma are characteristic, which include extensive peritumoural inflammation-related marrow oedema without a significant soft tissue component or periosteal reaction [25] (Figure 10).
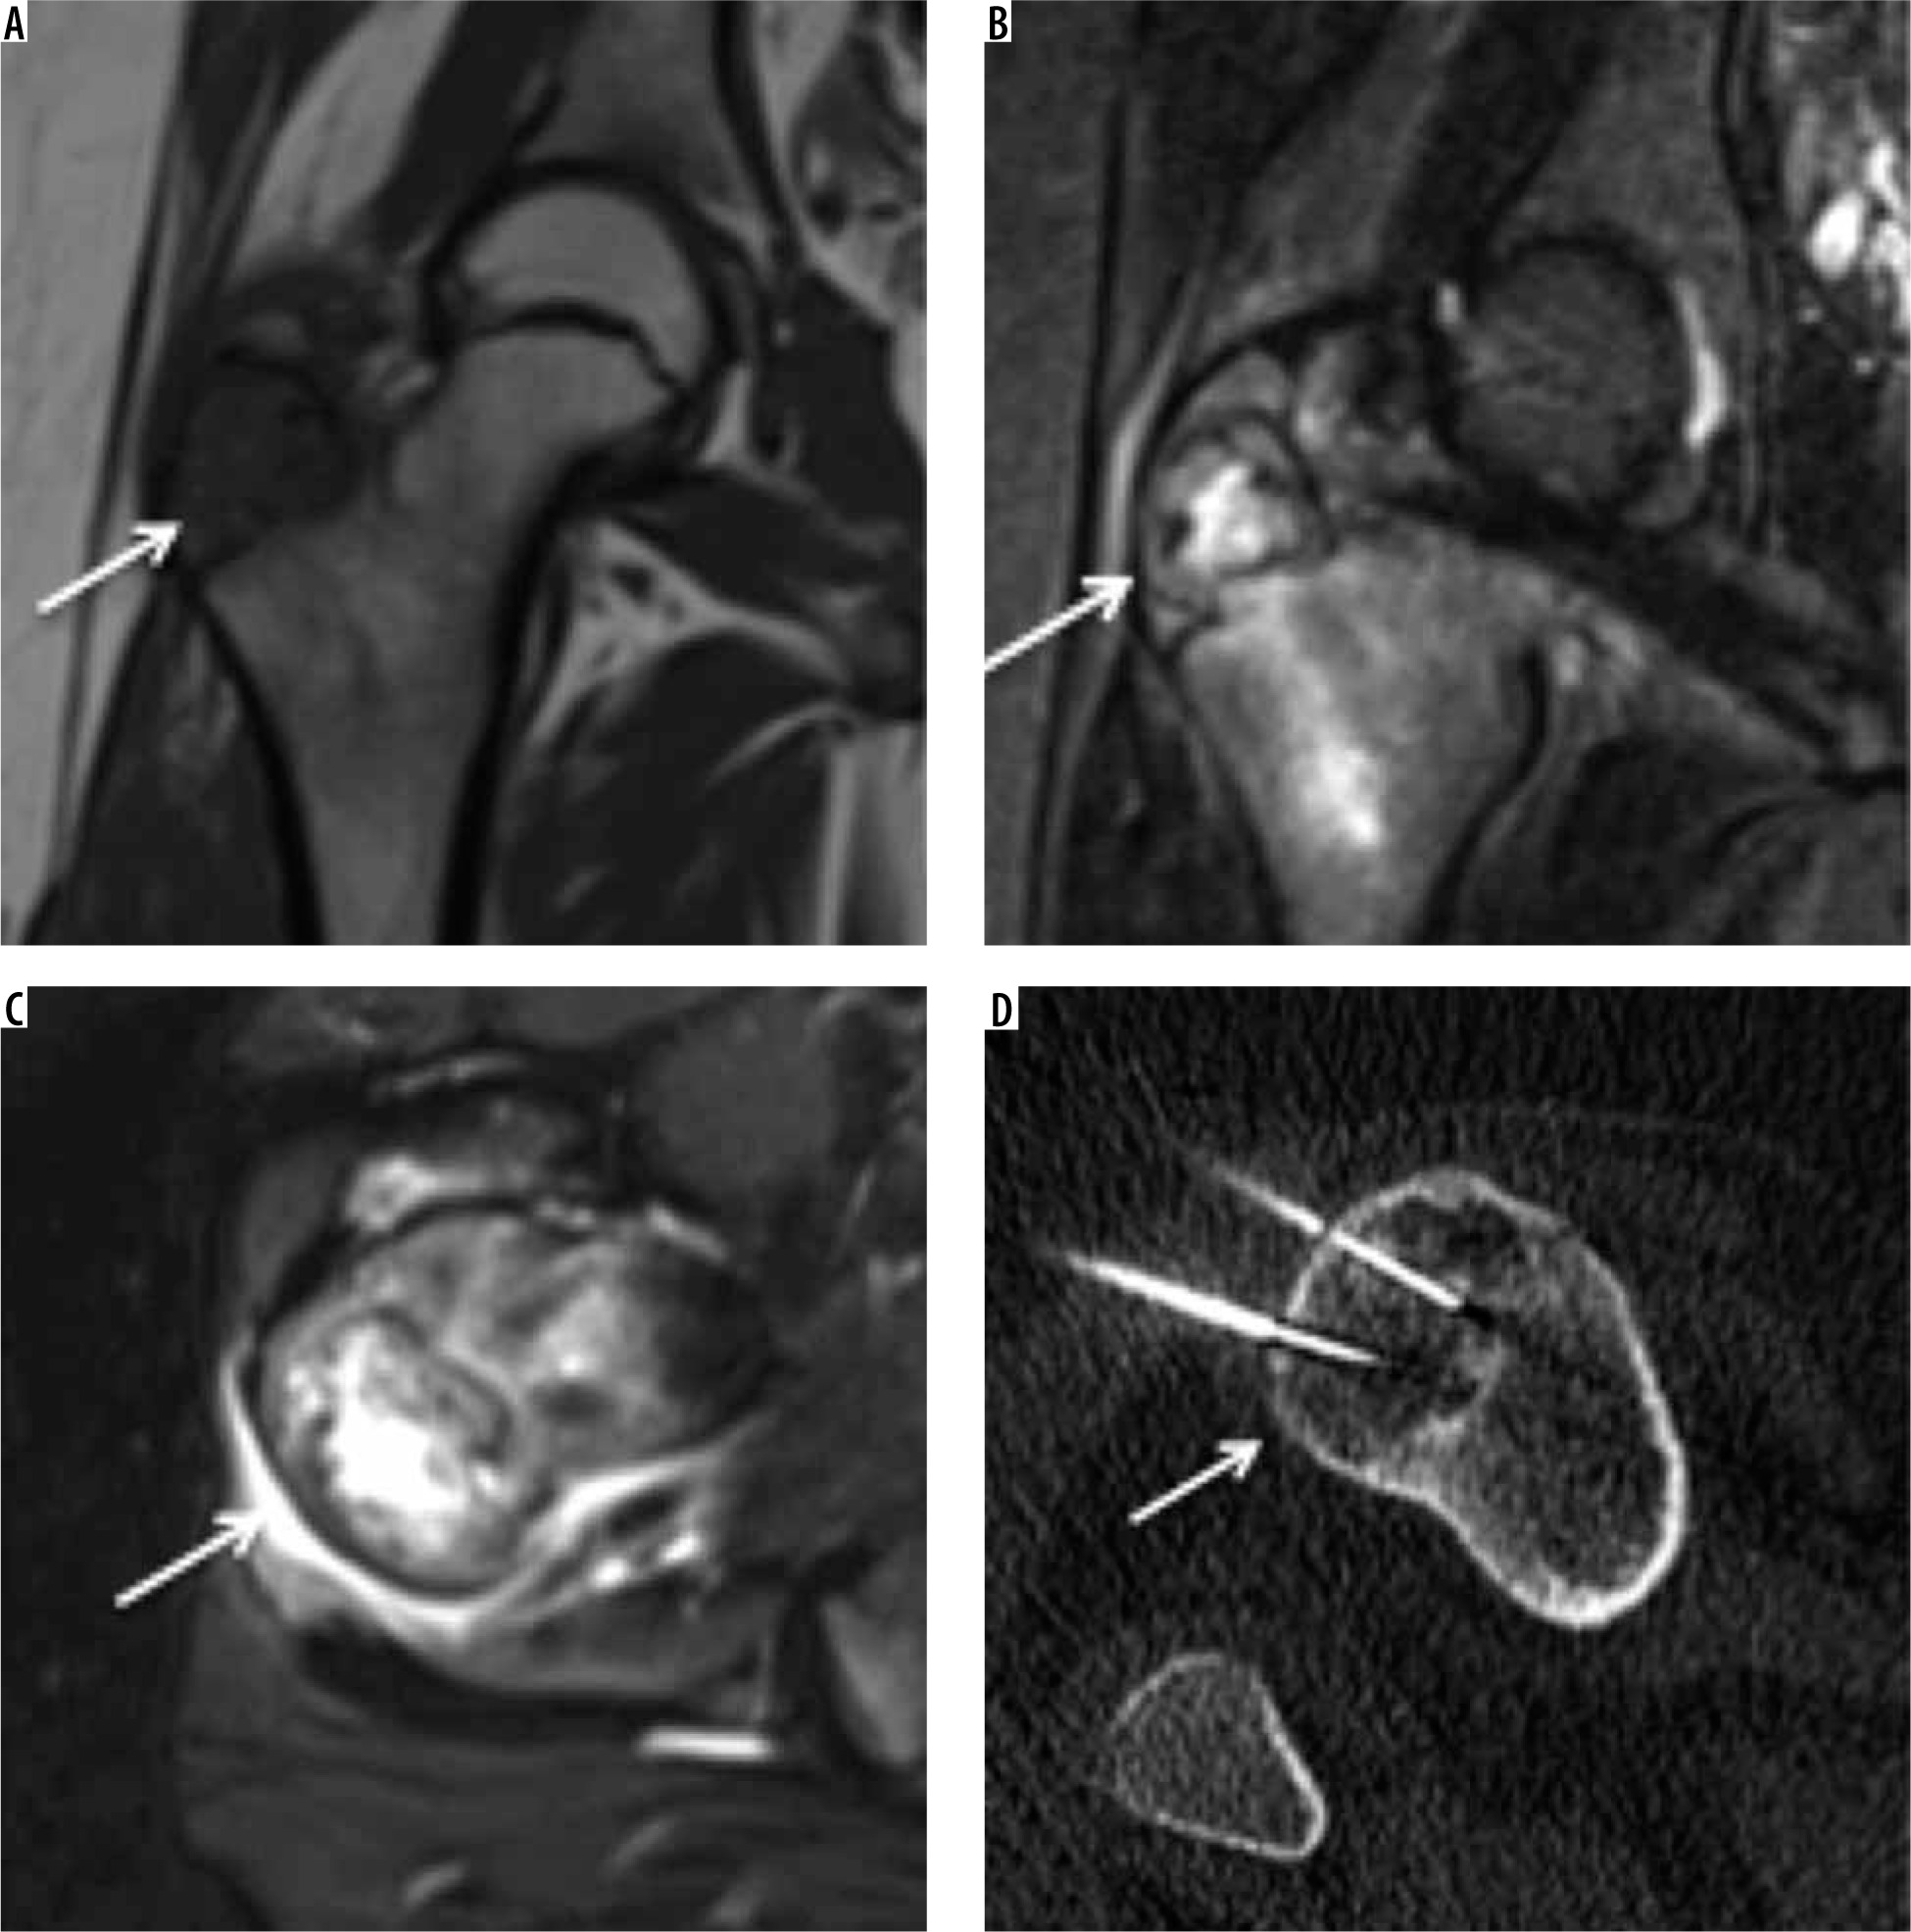
Figure 10
Chondroblastoma: In an immature skeleton, coronal T1-weighted (A), coronal STIR (B), and axial STIR (C) showing hypointense lesion on T1-weighted image and variable hyperintensity on STIR images. Also note the hypointense foci on both T1-weighted and STIR images representing chondral matrix. On axial STIR image, soft tissue oedema involves adjacent soft tissue. Axial CT (D) showing chondroblastoma involving the greater trochanter being treated with radiofrequency ablation
Clear cell chondrosarcoma is a potential differential diagnosis for chondroblastoma. Although the imaging features of both lesions can overlap, chondroblastoma is less commonly associated with a soft tissue mass component and periosteal reaction than the latter and involves a younger population.
GCT is ano-ther mimicker of chondroblastoma and can readily be differentiated by the patient’s age and extension into the metaphysis.
Eosinophilic granuloma
Eosinophilic granuloma is a rare bone lesion typically affecting children before the age of 10 years. It is the mildest and most localised variant of Langerhans’ cell histiocytosis.
Early radiographic features of eosinophilic granuloma include osteolysis with a poorly defined margin and perio-steal reaction, whereas in later stages the lesion may appear more benign, showing well-defined borders, sharp margination, and solid periosteal reaction (Figure 11). Differentials in the early stage include round cell tumours like Ewing’s sarcoma and lymphoma. MRI, although non-specific, helps ascertain the extent of marrow in-filtration before a biopsy. Eosinophilic granuloma demonstrates T1-weighted low signal intensity and T2-weighted high signal intensity surrounded by marked mar-row and soft tissue inflammatory oedema (flare pheno-menon) [26].
Figure 11
Eosinophilic granuloma: In a paediatric patient, AP radiograph (A) and radiograph with hip internal rotation (B) showing lucent lesion (arrow) involving the greater trochanter showing cortical break, lytic appearance, and surrounding variable sclerosis (Image courtesy of Prof. K Subbarao, NIMS, Hyderabad, India)

Malignant
Chondrosarcoma
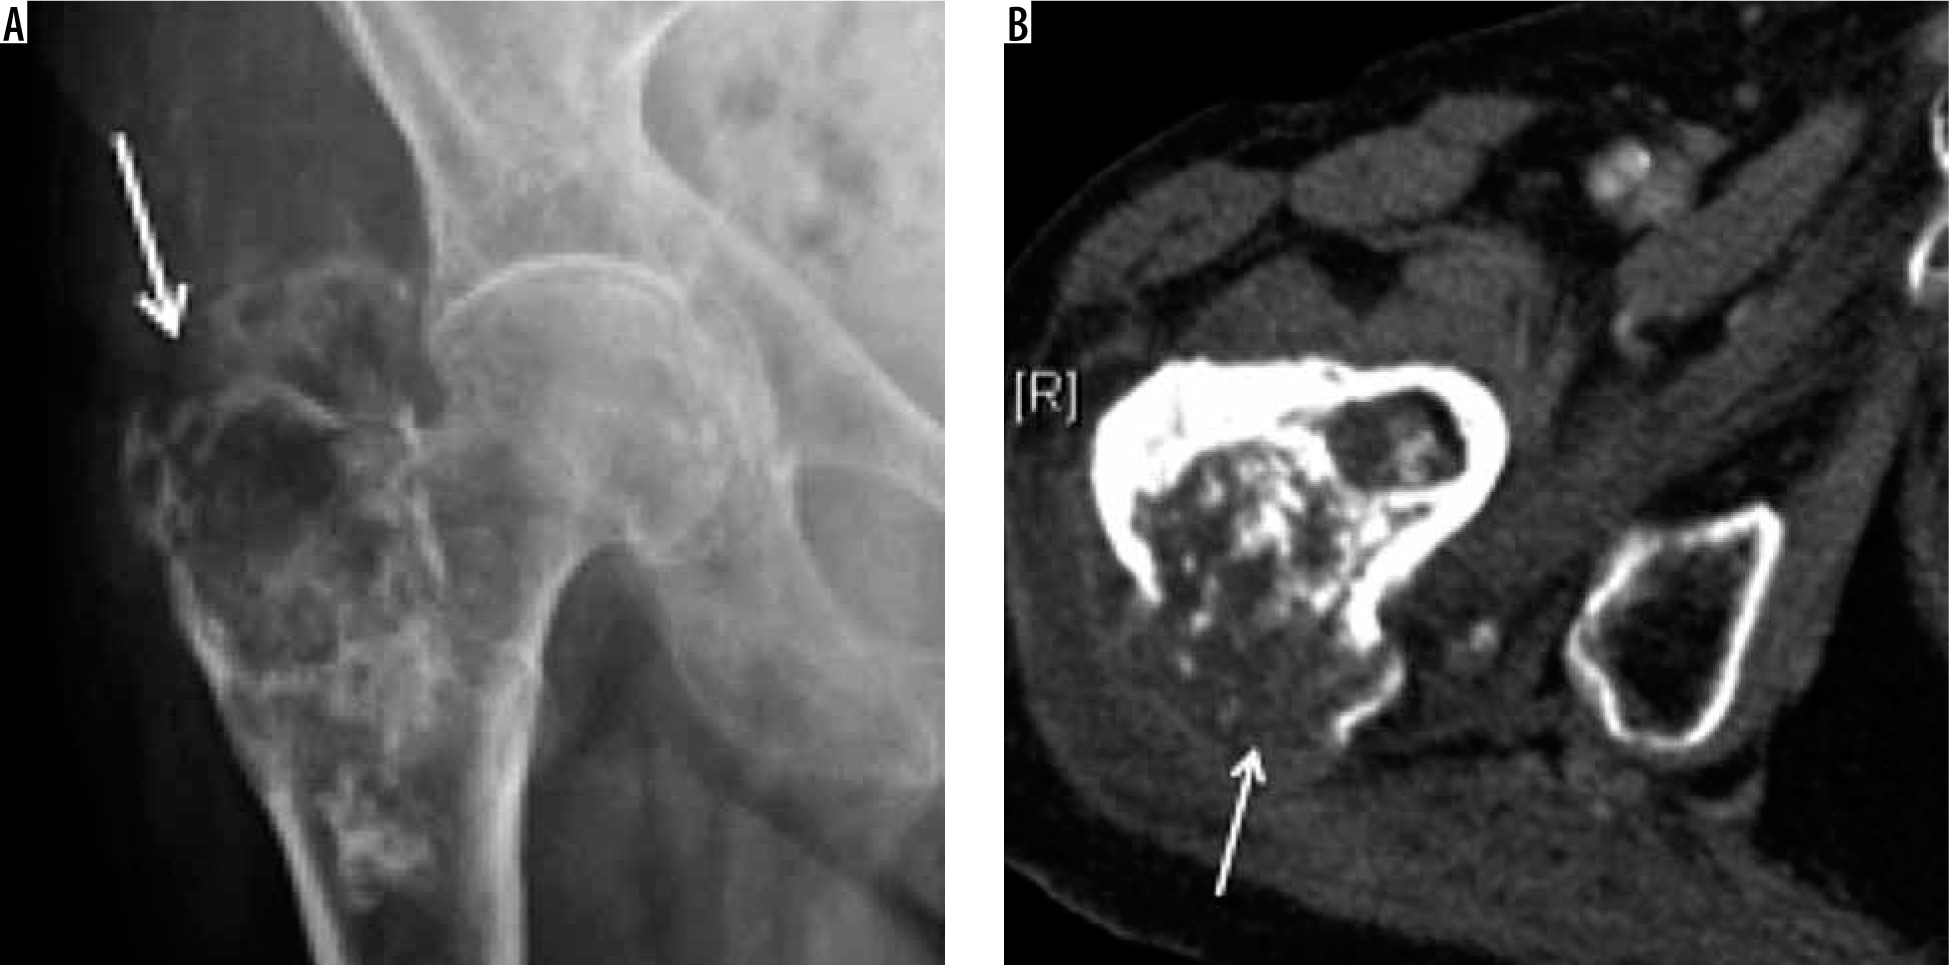
Chondrosarcoma shows a different clinical presentation than enchondroma. Patients are usually a decade older (40-50 years) compared to those with enchondromas. Pain is almost always present and usually insidious and progressive and sometimes associated with an underlying mass. Males are predominantly affected with a male to female ratio of 1.5-2. The femur is the second most common site after the pelvis [27].
The radiographic appearance of chondrosarcoma demonstrates variable amounts of matrix mineralisation in a lobulated lytic lesion with poorly defined margins. The appearance of mineralised matrix varies with the grade of the tumour [28]; well-differentiated lesions demonstrate classic ring and arc calcification, whereas less well-differentiated lesions demonstrate less conspicuous stippled or amorphous classification. The recent destruction of previously visualised mineralised matrix increases the likelihood of de-differentiation or higher histological grade. Extensive endosteal scalloping and expansile bony remodelling, cortical destruction, and a soft tissue component reflect increased biological activity in chondrosarcoma [23].
CT is extremely valuable in evaluating chondrosarcoma by readily demonstrating the matrix mineralisation, and cortical remodelling and destruction (Figure 12). MRI offers the best imaging method to analyse chondrosarcoma. Signal characteristics of chondrosarcoma are similar to those of enchondroma but are more aggressive and associated with a higher degree of cortical destruction, soft tissue extension, and occasionally peritumoural oedema [29].
Osteosarcoma
Osteosarcoma is the most common primary neoplasm of bony origin. Osteosarcoma accounts for approximately 20% of aggressive bony neoplasms, affects patients younger than 20 years, and involves the long bones of the lower extremities (most commonly distal metaphysis of the femur). The proximal femur is also a well-documented site for osteosarcoma as well as the proximal tibia and proximal humerus. Although there are many histologic subtypes of osteosarcoma depending upon their de-novo appearance (primary) or due to de-differentiation from underlying conditions such as Paget’s disease of the bone, which dictates its radiological appearance, intramedullary/central high-grade osteosarcoma otherwise known as conventional osteosarcoma is the most common [30]. Hence, we are limiting our discussion to the radiological features of primary central high-grade osteosarcoma. Discussion of the radiological appearances of other osteo-sarcoma subtypes is beyond the scope of this article.
Radiographically, osteosarcomas show typical site predilection with sun-burst or other variants of aggressive periosteal reaction, Codman’s triangle, permeative type of bony destruction, and new bone formation [30]. A CT scan can demonstrate periosteal reaction, osteoid formation, and pathological fracture better than radiographs. CT is also helpful in staging and detecting pulmonary metastases. MRI is the most useful imaging technique (Figure 13) to detect intramedullary and soft tissue spread of the lesion, skip lesions, intra-articular involvement, soft tissue component, and neurovascular bundle infiltration [31]. Amongst nuclear scans, the 99mTc-methylene diphosphonate scan is used to detect bone metastases, and the 16F-FDG PET scan is used for metastatic workup and to detect local recurrence or metastases post-treatment. Radiological features of other osteo-sarcoma subtypes that can involve greater trochanter are thoroughly described by Yarmish et al. [32].
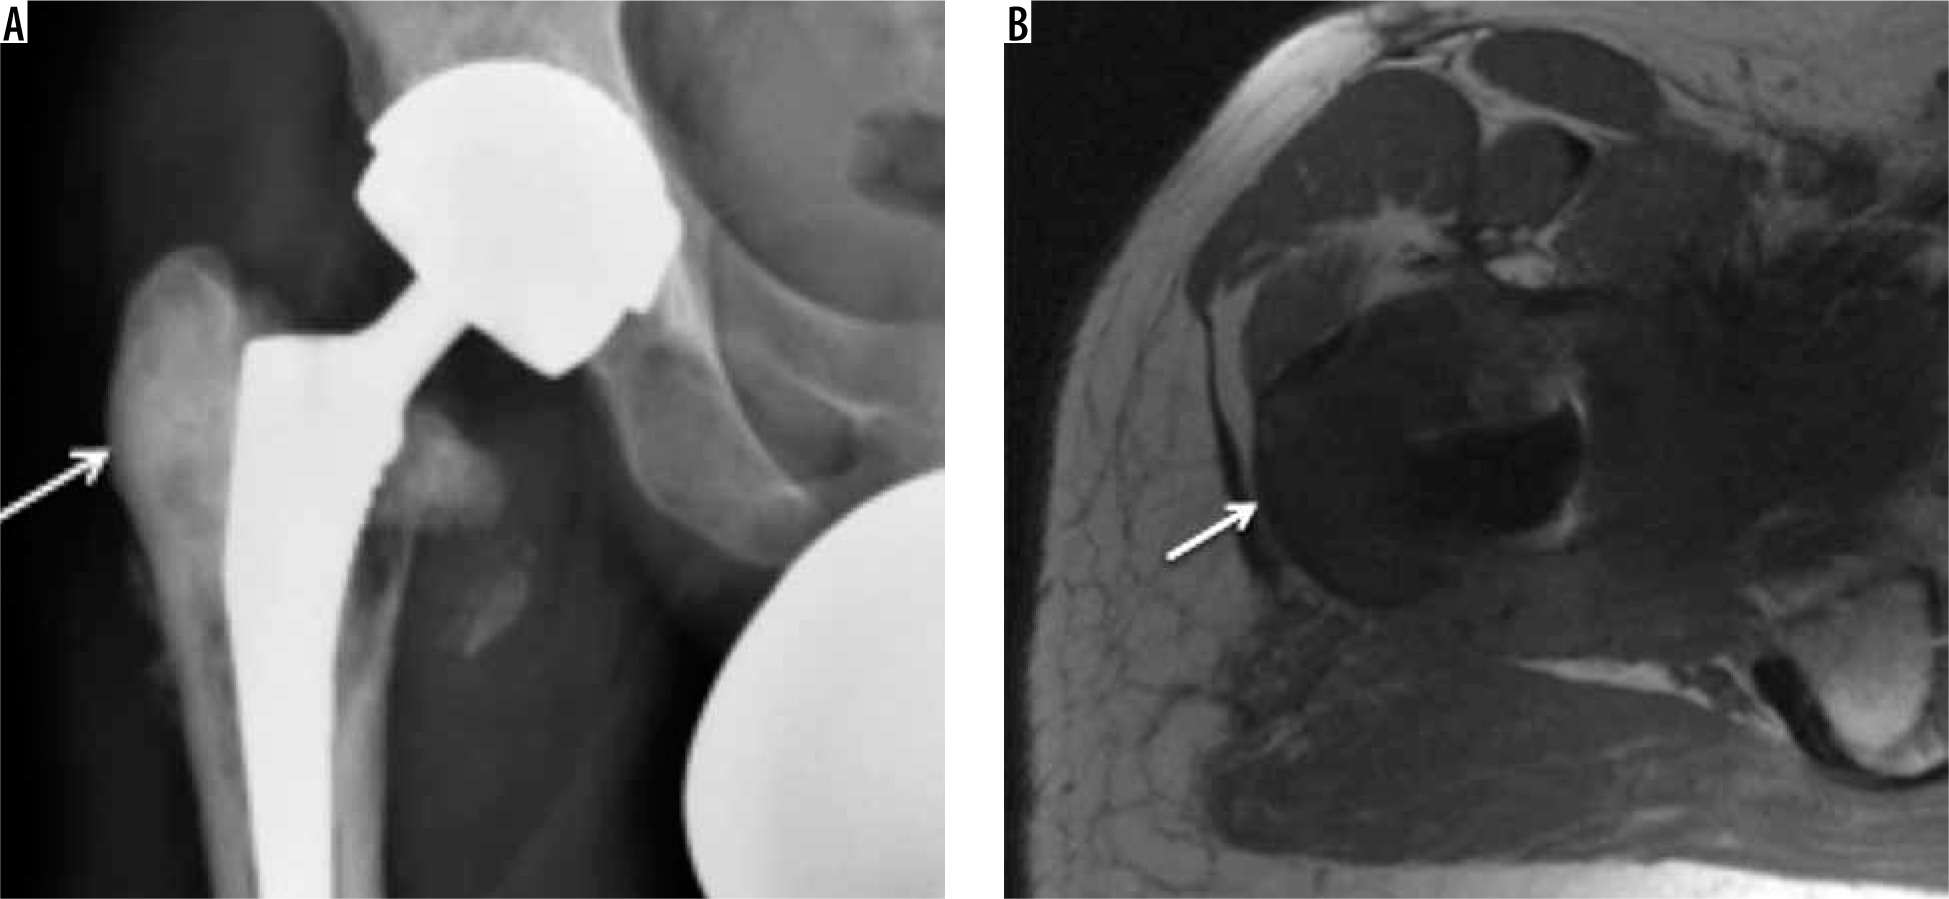
Figure 13
Osteosarcoma. AP radiograph (A) showing marked sclerosis (arrow) involving lateral aspect of the greater trochanter in a previously implanted hip. Subtle periosteal reaction can also be appreciated along the lateral proximal femoral cortex. Calcar resorption involving medial femoral cortex is expected due to altered weight-bearing. Axial T1-weighted image (B) showing extensive hypointense soft tissue (arrow) involving the greater tuberosity corresponding sclerosis on radiograph and a large medial soft tissue component. Biopsy of this confirmed osteosarcoma
Metastases
Skeletal metastases form approximately 70% of all malignant bone tumours. Although seen in relation to a variety of primaries, lung, breast, prostate, and renal cell carcinoma account for more than 80% of bone metastases. Isolated involvement of the GT is a rare phenomenon. GT involvement usually raises concern for more extensive axial metastatic involvement. Following the vertebrae and pelvis, the proximal femur is one of the most common sites for secondaries.
Depending upon the primary, skeletal metastases can be lytic, sclerotic, or mixed appearing as radiolucent or radiopaque, and as mixed radiopacities on radiographs, respectively, and more readily on CT. MRI is the investigation of choice to evaluate metastatic marrow infiltration. Osteolytic metastases are usually hypointense on T1-weighted images with corresponding hyperintensity on T2-weighted, fat-suppressed images. Conversely, osteoblastic metastases are hypointense on T1-weighted, T2-weighted, fat-suppressed, and STIR images. Additionally, MRI is also the imaging method of choice to evaluate treatment response and to detect complications like pathological fractures [33] (Figure 14).
Figure 14
Breast metastasis. In a patient with history of breast carcinoma and hip pain. Coronal T1-weighted (A) and STIR (B) images showing hypointense (on T1W) and hyperintense (on STIR) lesion in keeping with metastasis (arrow) involving the greater trochanter
Ewing’s sarcoma
Ewing’s sarcoma represents the second most common bone neoplasm amongst children and adolescents following osteosarcoma. There is a slight male predilection (the male-to-female ratio is 1.5 : 1). The femur is the most common site of involvement (21%) [24].
On radiographs, Ewing’s sarcoma shows aggressive features, a moth-eaten to permeative pattern of bone destruction, florid aggressive laminated (onion-skin) or spiculated (sun-burst) periosteal reaction, and a wide zone of transition. Soft tissue mass is usually associated with it, and it is better visualised on CT and MRI. CT findings are usually similar to, but more conspicuous than, those on radiographs. MRI, being the most sensitive and showing excellent contrast resolution, reveals marrow replacement and cortical destruction with an associated circumferential soft tissue mass. MR signal characteristics of the soft tissue are characteristic but not pathognomic: homogenous and intermediate on T1-weighted images and homogenous and low-to-intermediate on T2-weighted images [34] (Figures 15).
Figure 15
Ewing’s metastasis. Axial T1 (A) and STIR (B) showing tumour (arrow) involving the greater trochanter showing hypointense soft tissue on T1-weighted images, which demonstrates variable signal on STIR images. Also note nodular extraosseous soft tissue component of Ewing’s sarcoma and reactive hip joint effusion
Miscellaneous
Neoplasms involving the GT are not limited to pathologies, as mentioned earlier. We also found GT involvement by less frequent neoplasms like lymphoma or myeloma; however, they are usually multifocal, and GT involvement usually occurs as part of systemic involvement. We found a single case of secondary involvement of the GT by dermatofibrosarcoma protuberance resulting from a direct extension.
Conclusions
Greater trochanter lesions can be traumatic, infective, inflammatory, or neoplastic in aetiology. Radiographs, when used in conjunction with advanced imaging techniques like CT, MRI, and nuclear scans, help narrow down the differential diagnosis. An imaging guided biopsy is required if a diagnostic dilemma persists.