


Introduction
One of the major challenges faced in the medical imaging field is to segment an organ and the suspected lesions found in it. The liver is one of the vital organs that has a very important function in vertebrates. Liver lesions are very common and may be asymptomatic, or the clinical symptoms may be mild at first. Hence, accurate and fast diagnosis is often based on medical imaging [1]. Liver cancer and tumour is one of the foremost reasons for mortality among other diseases all over the world. Around 745,000 deaths were caused due to liver cancer and tumour throughout the world in 2012 [2,3]. Many of these deaths could have been prevented by fast and early diagnosis. There is a shortage of radiologists even if proper imaging equipment is available. In India there are only 10,000 radiologists, while the population is 1.3 billion. Hence, many patients have a delayed diagnosis. Computer-assisted diagnosis (CAD) is used by many radiologists to get a second opinion [4].
In recent years a few attempts have been made to provide an artificial intelligence (AI)-based, computer-assisted diagnosis. An attempt was made to classify skin cancer based on convolutional neural networks (CNN). It showed the possibility of classification of images based on the appearance of skin lesions and disease labels as input. CNN classifies diseases in much less time, and thus different types of skin cancer were classified easily [5-9]. Another method, called deep neural network or DNN, deconstructs the image into pixels and then reconstructs it, revealing the different shapes and features that can be used to recognize lesions in computed tomography (CT) scan images [10,11]. Researchers have also classified liver lesions into 4 categories using texture features as a distinguishing factor [12]. Another attempt to classify liver lesions into 3 categories was made using the texture, shape, and kinetic curvature of the lesion as distinguishing factors [13].
Focal liver lesions observed in CT images can be benign (e.g. hepatic cyst [CYS] or haemangioma [ANG]) or malignant (e.g. hepatocellular carcinoma [HCC] or metastases [MET]) [14]. The liver is one of the 3 most common sites of metastases, next to the lungs and bones [15]. At present, an unquestionable diagnosis of malignant or benign liver lesions can only be made after the histological examination, which is possible with an invasive procedure. Therefore, there is a need to develop a system that can provide this crucial characteristic as pre-histological findings and thus improve patient management, making the diagnosis faster and less invasive.
The prime objective of the research presented herein is to segment the liver and classify and locate liver lesions accurately using the CNN network and a multi-channel deep learning CNN (MDL-CNN) from CT images. Many medical imaging studies have recently used CNNs to increase the performance of various kinds of medical applications [16].
The contributions of the study proposed in this research are as follows:
An effective yet simple way to segment an organ from a CT image using the CNN architecture model.
Designing and training a novel MDL-CNN architecture to simultaneously locate liver lesions and classify them into 4 diseases under malignant or benign sections, with comparable performance results to other state-of-the-art AI models.
A completely automated system for computer-aided diagnosis to assist radiologists with diagnostic procedures.
Material and methods
Proposed method
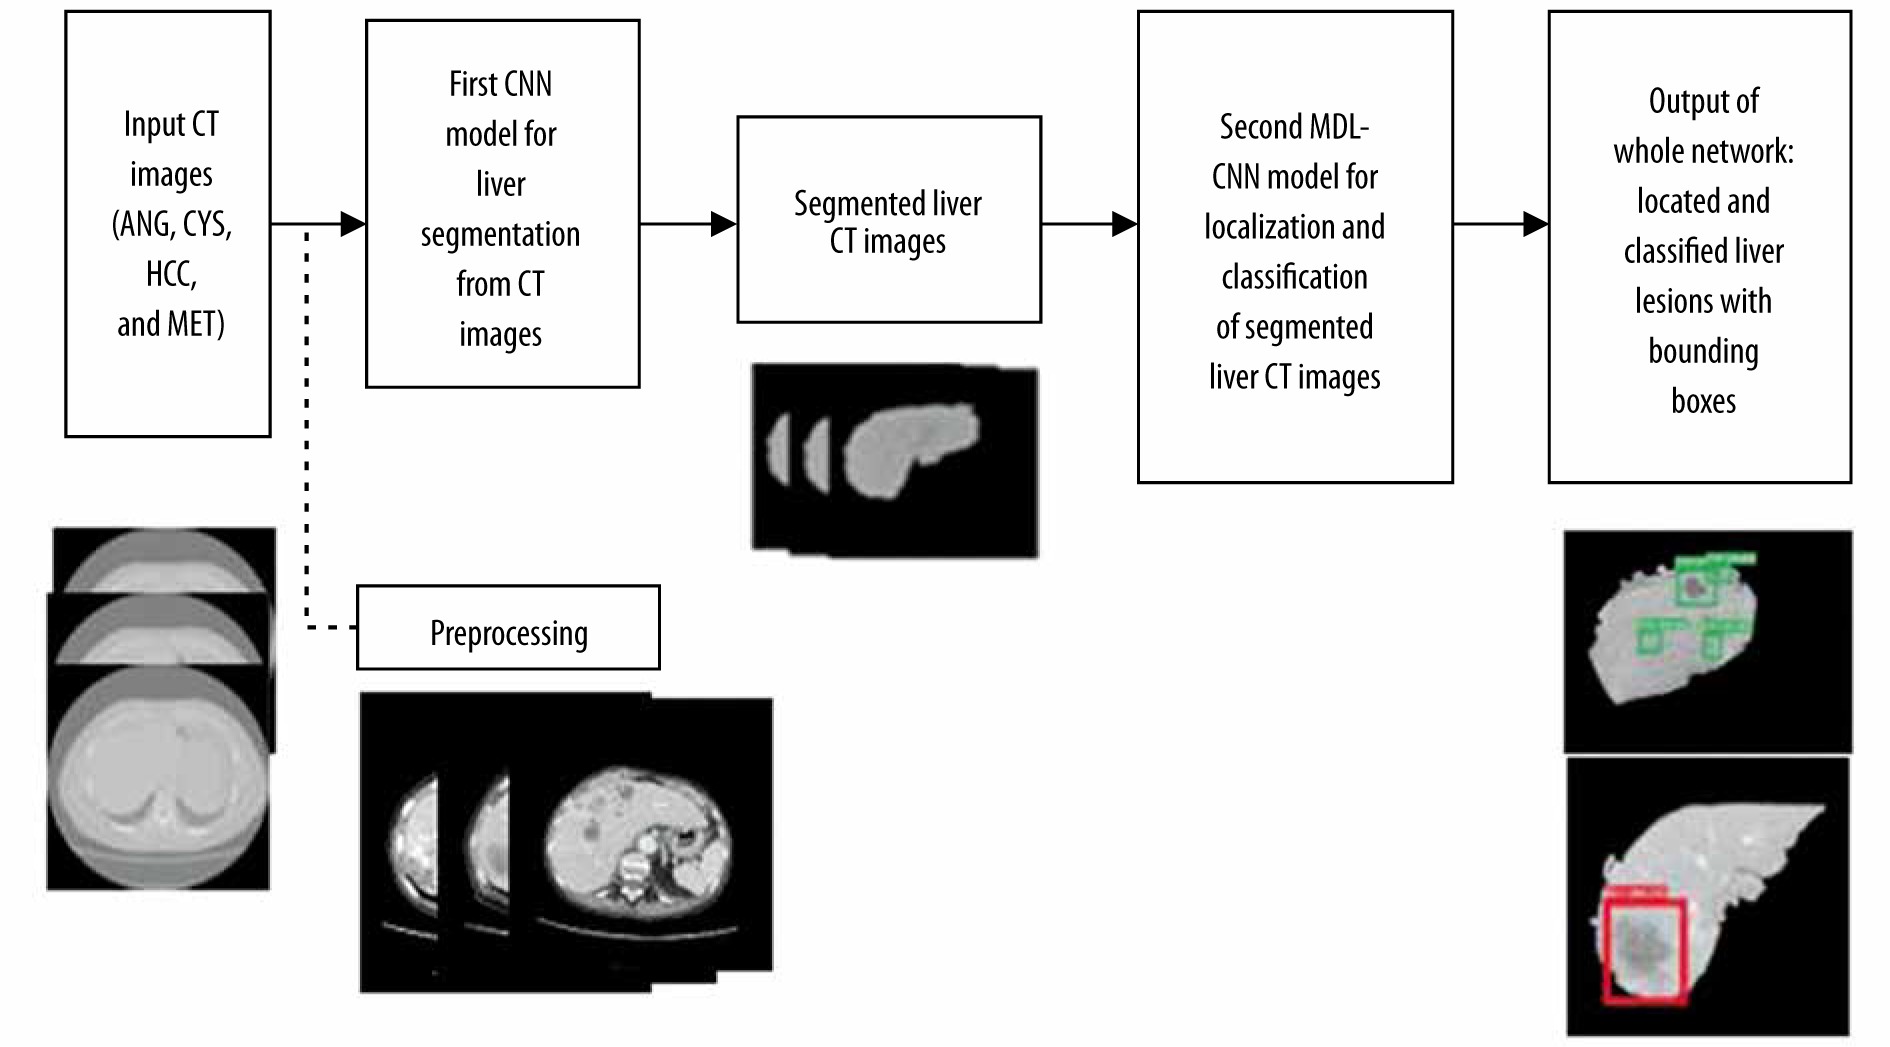
The flowchart in Figure 1 represents the steps involved in training the proposed network architecture. Initially, the raw CT image was preprocessed to enhance the image. Preprocessed images were then labelled and divided into training and testing datasets. These datasets were then fed as input to the first CNN model for liver segmentation. After the model was trained and all the liver regions were segmented from their respective CT images they were used as input for training the second MDL-CNN model. This model was used for the location of liver lesions and their classification into 4 types of disease of malignant or benign category. The weights and biases of these models were then saved for further use with other unlabelled data.
Material
Many online websites offer CT images, but there is no definite way to verify the truthfulness of such data. Imagesavailable online are often not suitable for the desired research study. One of the difficulties faced by researchers in developing an advanced CAD system is the availability of labelled datasets [17-19]. While making the use of supervised learning it is essential to have an abundant amount of training dataset. Although many medical images are available online, they are still limited in size, and only specific medical problems are addressed. Expert radiologists are also required to label the data manually and verify the CAD system [16]. Therefore, collaboration with the Department of Radiology of Wroclaw Medical University, Poland, which has 13 years’ experience in CT liver imaging, helped to obtain the necessary medical CT image data and expert radiologist guidance.
Four classes: benign CYS, benign ANG, malignant HCC, and malignant MET, were prepared according to the current medical information. For each class, 50 patients aged 12 to 76 years, random gender and ethnicity, were selected so as not to pollute the labelled training dataset. The radiologists (Dr. M.G. and Dr. A.S.) randomly selected another 50 patients from all 4 categories and unlabelled it for the testing dataset. This way the testing dataset remained random for the trained model during validation. The prevalence of heart failure in the group was assumed to be the same as in the general population. In the case of MET, the primary diseases were colorectal cancer, breast cancer, gastric cancer, and renal cancer. The primary diseases prevalent in patients were histologically confirmed. Metastases were assumed by the known primary disease. Because ANG cannot be biopsied, it was confirmed by 2 radiologists. Atypical haemangiomas were excluded from the study. Radiologists manually marked the liver and liver lesions and labelled them with appropriate disease names in order to train the liver segmentation model and liver lesion location model, respectively. Lesions that covered less than 40% of the liver area in a CT image were included in this study. Contrast-enhanced CT images were used in this study for all purposes. A total of 1800 images were used to train the first CNN model, and 4212 images were used to train the second MDL-CNN model.
Preprocessing
Computed tomography images contain a lot of unwanted objects in their raw form. Therefore, preprocessing was done to make it more suitable for segmentation using CNN. The Hounsfield units were limited to the range of [−100, 400] to reject unwanted objects. To increase the contrast of the abdomen, CT image histogram equalization was utilized [21]. Images of the abdomen CT slice before and after preprocessing are shown in Figure 2. It was observed that the liver region was properly contrast-enhanced. The machine that was available for this study was a 64-slice General Electric CT machine. The slice thickness of the CT images was 0.625 mm. Arterial and portal venous contrast-enhanced phases were used in this study for data training and testing. The contrast media (CM) type was iodine low-osmolar with a dose of 1.0 to 1.2 ml/kg. The parameters of the itera-tive reconstruction algorithm in CT imaging were taken as a 60% filtered back-projection FBP and 40% adaptive statistical iterative reconstruction ASIR.

Liver segmentation
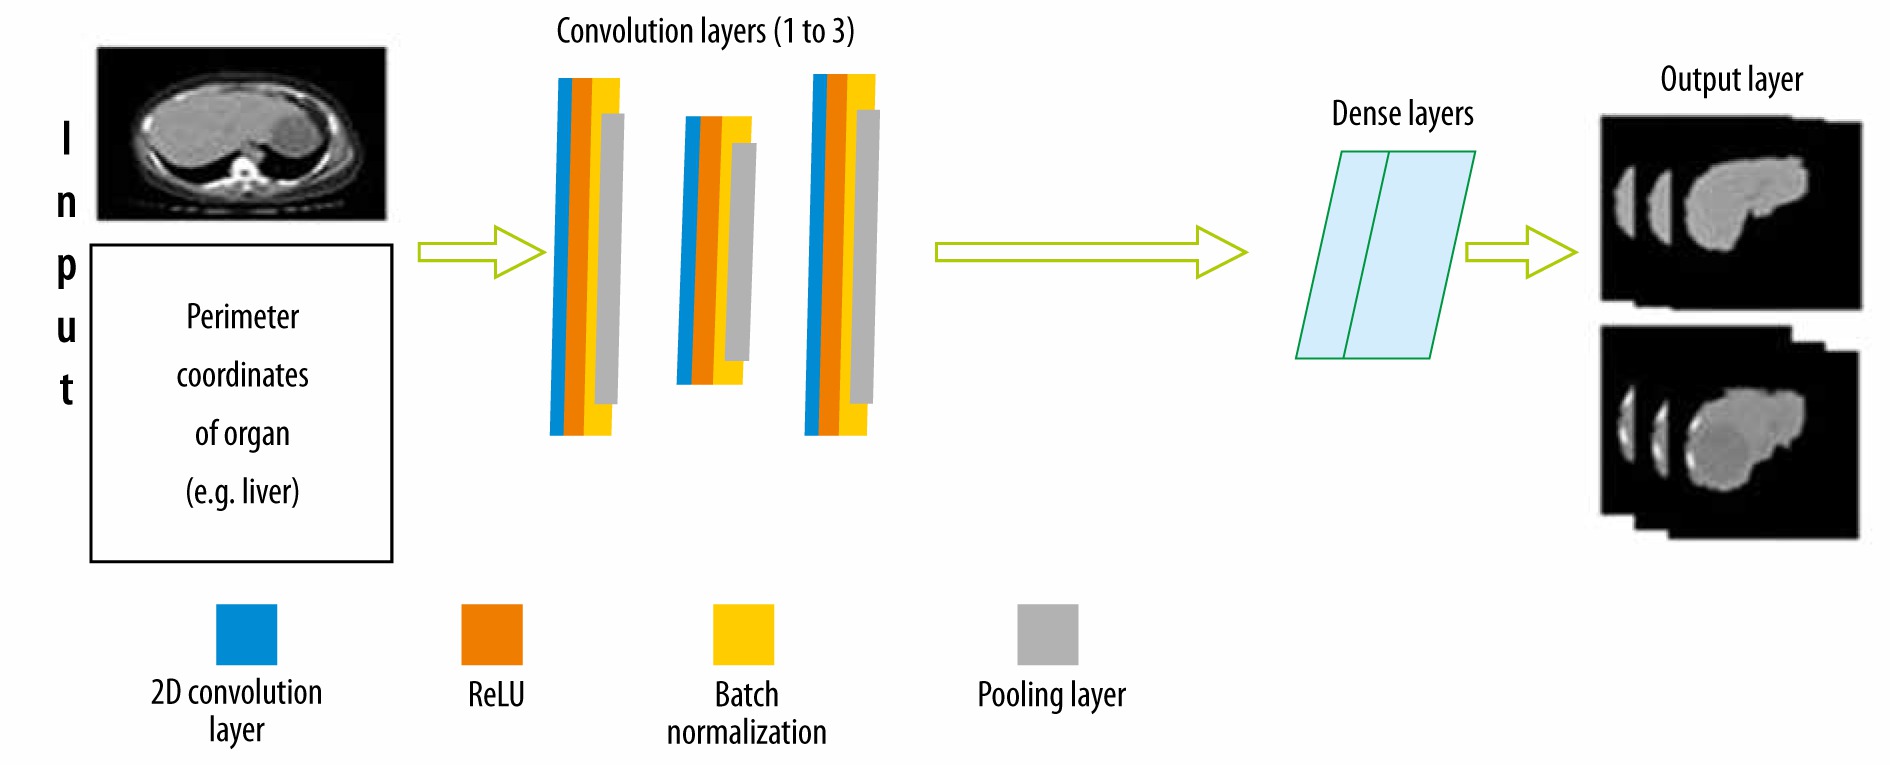
To classify lesions in the liver, segmentation of the liver from the abdomen CT image was required. The CNN architecture designed for this is shown in Figure 3. There is an input layer that takes the perimeter coordinates of the liver as the input and the preprocessed CT image as the base frame of the input. The preprocessed CT image along with labelled perimeter coordinates was fed to a convolutional filter layer, which was then used to extract feature maps that were batch normalized afterward. There were 3 convolutional layers with 128 filters in the first layer, 64 filters in the second layer, and 128 filters in the third layer. The convolution process with filters applied to the image produces dense feature maps. Batch normalization was also employed for each of these feature maps. A layer-by-layer rectified linear non-linearity (ReLU) unit was utilized as an activation function following the batch normalization. Lastly, max-pooling was attached to the ReLU function, which was preceded by sub-sampling. A 3 × 3 matrix with stride 1 was applied in the max-pooling layer. To confirm translation invariance over a small stride in the input image, max pooling and sub-sampling were employed. The last output layer produces a fully connected dense feature map, which resembles the input CT image. This fully connected dense feature map was then utilized as input for the Softmax classifier function to label every pixel of the input images.
Liver lesion location and classification
To locate and classify liver lesions simultaneously, parallel channels of convolutional layers and other sub-layers corresponding to it were employed. We call this design an MDL-CNN. The working principle of this network model is that different types of input were fed to a different channel of layers for training. ResNet101 was used as a pre-trained base for this network with 7 convolutional features mapping layers. For classification of 4 diseases (CYS, ANG, HCC, or MET) under benign or malignant sections another channel of convolutional layers was employed; there were 7 layers in this channel. The first convolutional feature layer had 256 filters, the second layer had 128 filters, the third layer had 64 filters, the fourth layer had 32 filters, the fifth layer had 64 filters, the sixth layer had 128 filters, and the seventh layer had 256 filters. The MDL-CNN network architecture is shown in Figure 4.

Formulas and equations
In order to teach both models, a well-known leaning algorithm, ADAM, was used. ADAM is an adaptive learning rate optimization algorithm. It utilizes exponentially moving averages, computed on the gradient evaluated on a current mini-batch. Equations 1 and 2 show the moving average vectors of the ADAM optimization function [24].
where moving averages are represented by a and b, and the gradient is γ on the current mini-batch. The mini-batch size is set to 32 for this research. t is the number of each mini-batch. δ1 and δ2 were hyperparameters of the algorithm. The default values of hyperparameters were 0.9 and 0.999, respectively. The first iteration of the moving average vectors started from zero.
To calculate the loss during training, a cross-entropy loss function was employed. An increase in cross-entropy loss increases suggested that the predicted probability was diverging from the actual label provided during input. Because 4 classes of diseases were being classified, the function of cross-entropy loss is represented by Equation 3.
where N is the number of diseases that were being classified (CYS, ANG, HCC, or MET from benign or malignant category), x is a binary indicator if the class label, i is the accurate classification for observation o, and the predicted probability is represented as p for observation of class c [25].
To evaluate the performance of liver segmentation and liver lesion location, 3 parameters were used; namely, dice score, volumetric overlap error (VOE), and relative volume difference (RVD). The dice similarity coefficient is a parameter frequently applied for valuation in image segmentation [22,23]. Equation 4 shows the equation for the calculation of the dice score [24]. The DICE score is the parameter that quantifies the accuracy of the area of overlap between the liver segmented by the CNN architecture and the actual area of the liver.
where TP means true positive, TN means true negative, FP means false positive, and FN means false negative. Values for these were found from the confusion matrix.
VOE, which was derived from the Jaccard coefficient, is shown in Equation 5 [24].
RVD is a criterion that measures a non-symmetricity of 2 segmented areas, and it is defined in Equation 6 [24].
The performance of the classification of the second model was evaluated using 3 different parameters: accuracy, sensitivity, and specificity. Confirmation from histological findings after CT scans were taken as references for TP, TN, FP, and FN in this study. Histological findings were also corroborated by the medical experts involved in the study.
Results
CT images of 200 patients were taken, with 50 patients in each class (CYS, ANG, HCC, or MET) of disease. In total there were 4212 CT slices with manually labelled liver lesions. For training, the first CNN model patients with complete abdomen CT slices were used. Perimeter coordinates were manually marked and saved in the .json file format. The dataset for both networks was randomly divided into 70% and 30% for training and testing, respectively. Data augmentation was not performed.
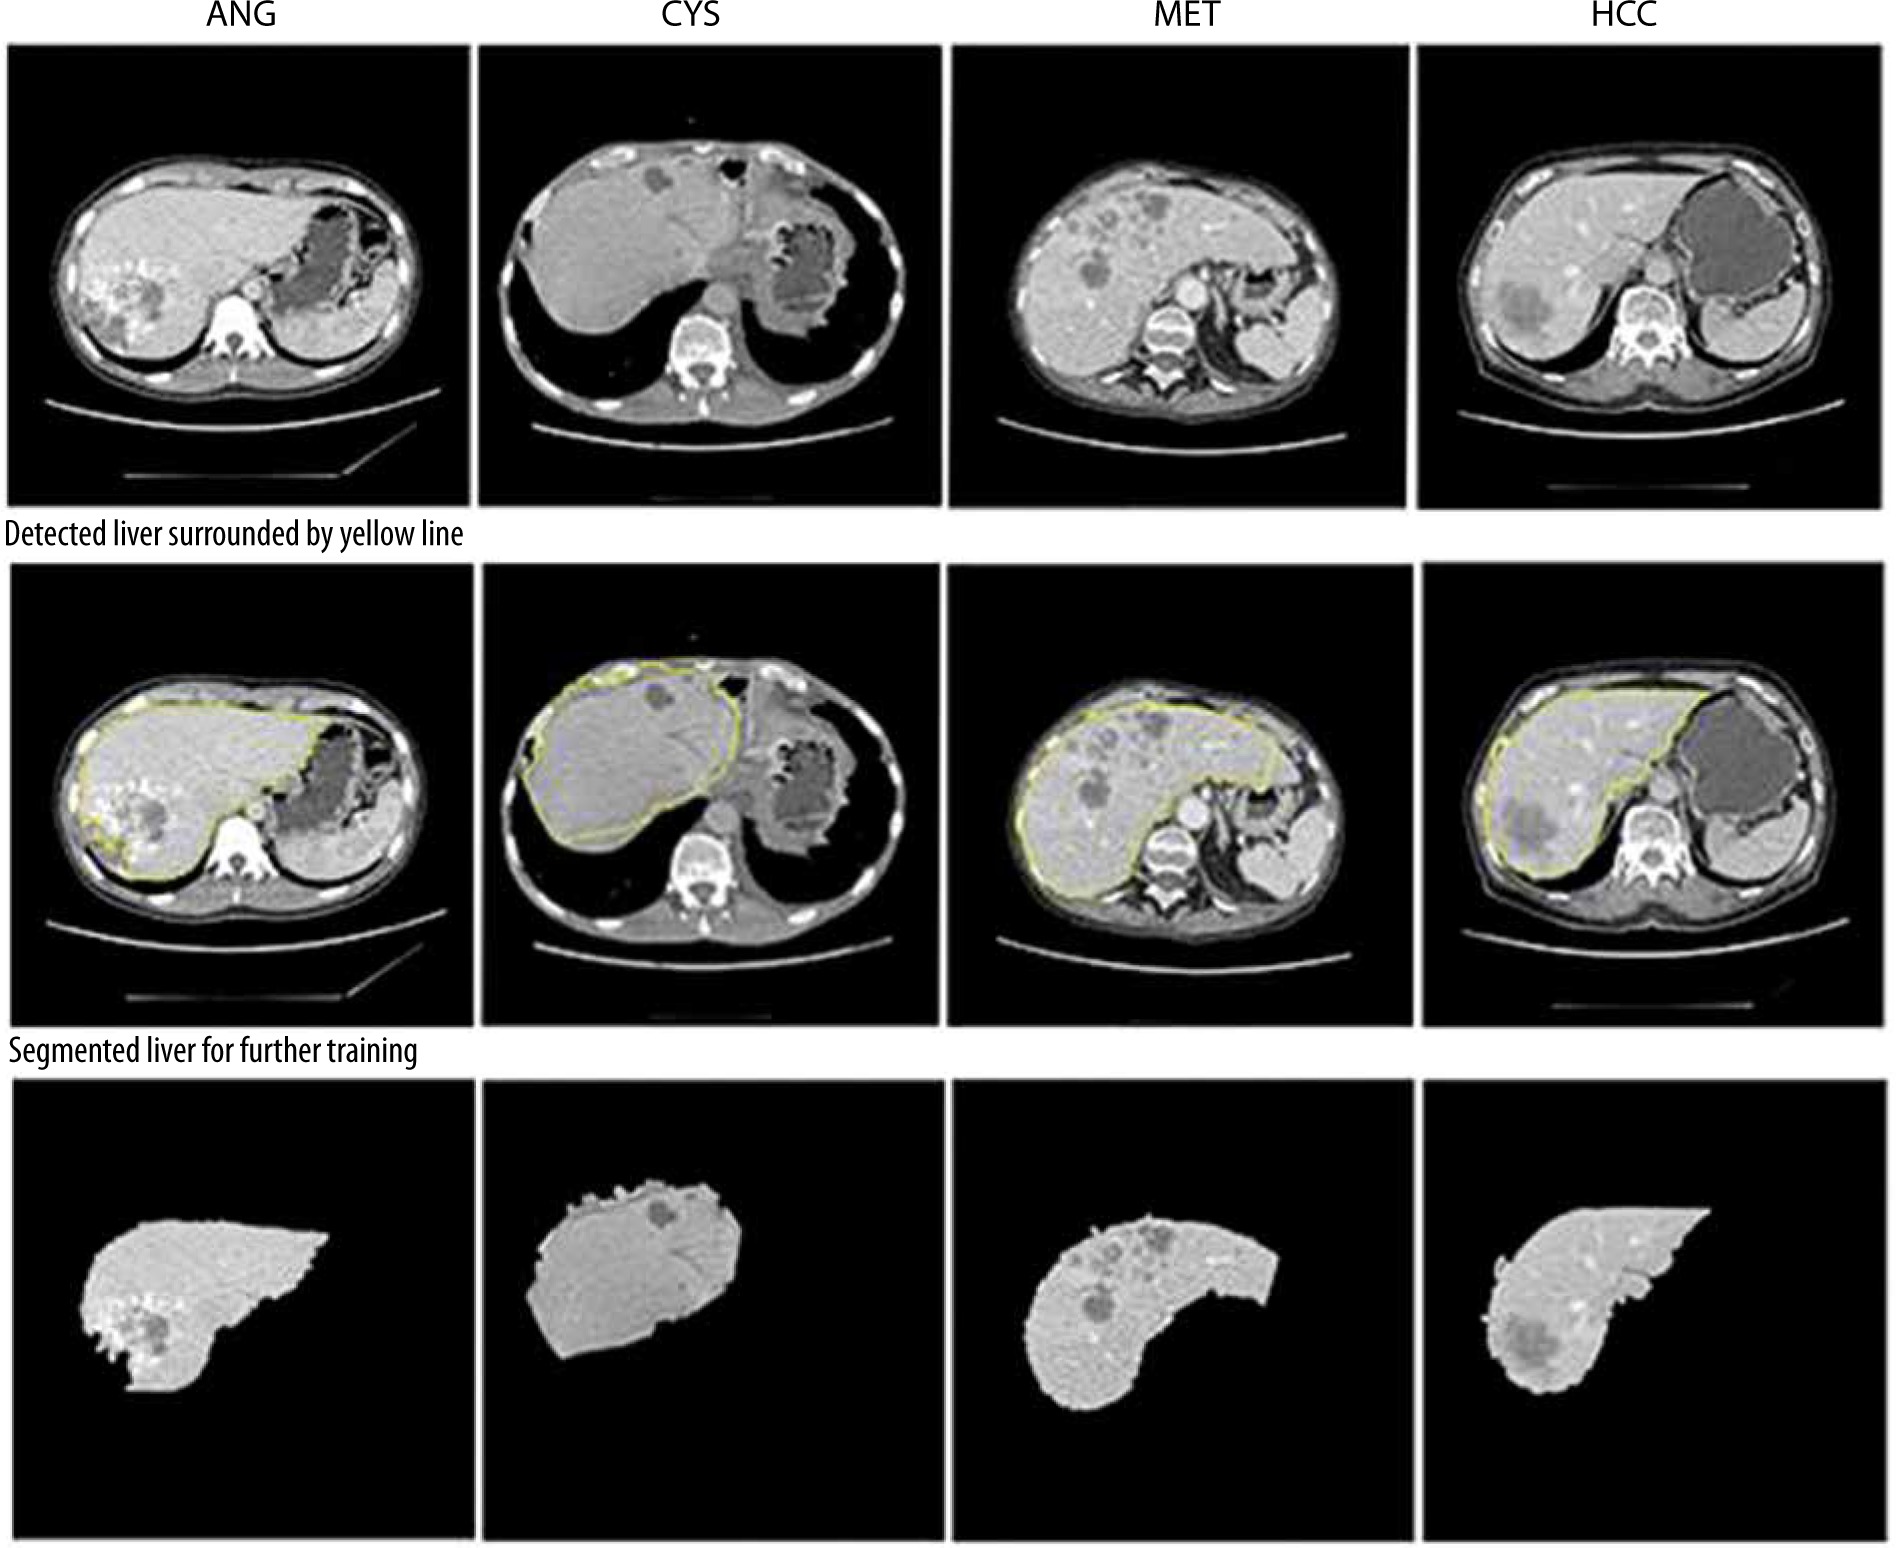
An NVIDIA graphics processing unit (GPU) with 16 GB of memory and CUDA cores was used for the training process on an MS Windows 10 platform with a 32 GB RAM computer. An ADAM optimizer was employed for optimization. The training was done over the base filters of ResNet101. The first CNN network for segmenting the liver from the CT image was trained for 200 epochs with a batch size of 32. The first CNN model predicted the perimeter of the liver region. This perimeter was then used to segment the region of interest (ROI) – in this case, the liver using basic image processing techniques. Figure 5 shows the segmentation of the liver from the abdomen CT image. The yellow line seen around the liver is the predicted perimeter. These segmented livers were used as inputs for training the second MDL-CNN model. A few liver segmentation results are shown in Figure 5.
Performance of liver segmentation was measured using confusion matrix values in Equation 4, 5, and 6 for dice score, VOE, and RVD, respectively. It is visible in Figure 5 that there was a slight error in recognizing the actual liver region; to understand the level of error one would get after segmentation, the above parameters were used. The average dice score found after testing for the segmentation of the liver was 96.18%. The average VOE and RVD for the first CNN model after testing was 10.2% and 8.4%, respectively. After getting satisfactory results, the liver was segmented from all the CT image dataset to train the second MDL-CNN model.
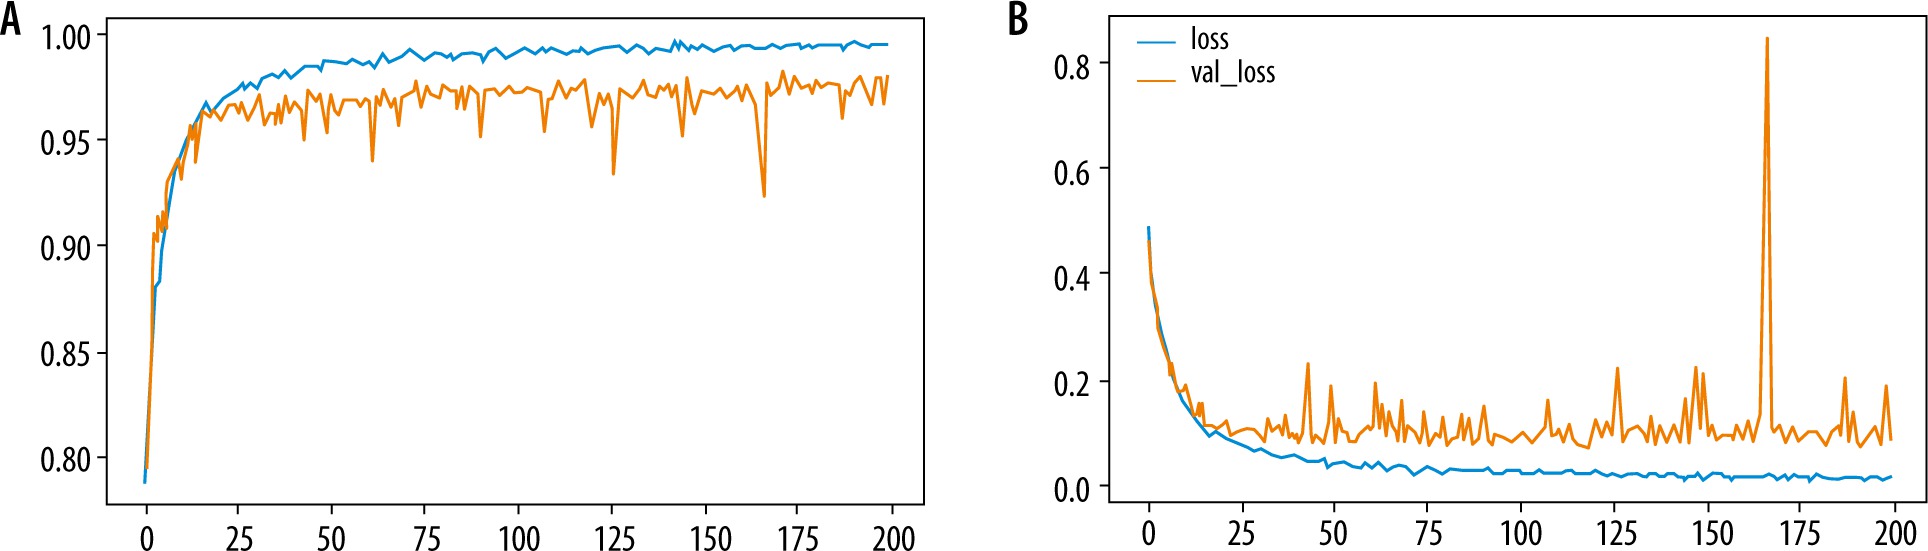
The performance of the MDL-CNN model was measured with different 2 sets of parameters, one for classification and another for the location of liver lesions. For performance analysis of classification part accuracy, sensitivity, and specificity from Equation 7, 8, and 9 were used. Liver lesion location performance analysis was done with similar parameters as those used in the first CNN model. After the training and testing of this model were completed, the accuracy was found to be 98.78% while sensitivity and specificity were found to be 98.67 % and 98.82%, respectively, for the training set. The loss found in the model after training was 0.02. Figure 6 shows the training and validation graph for accuracy and loss of this model.
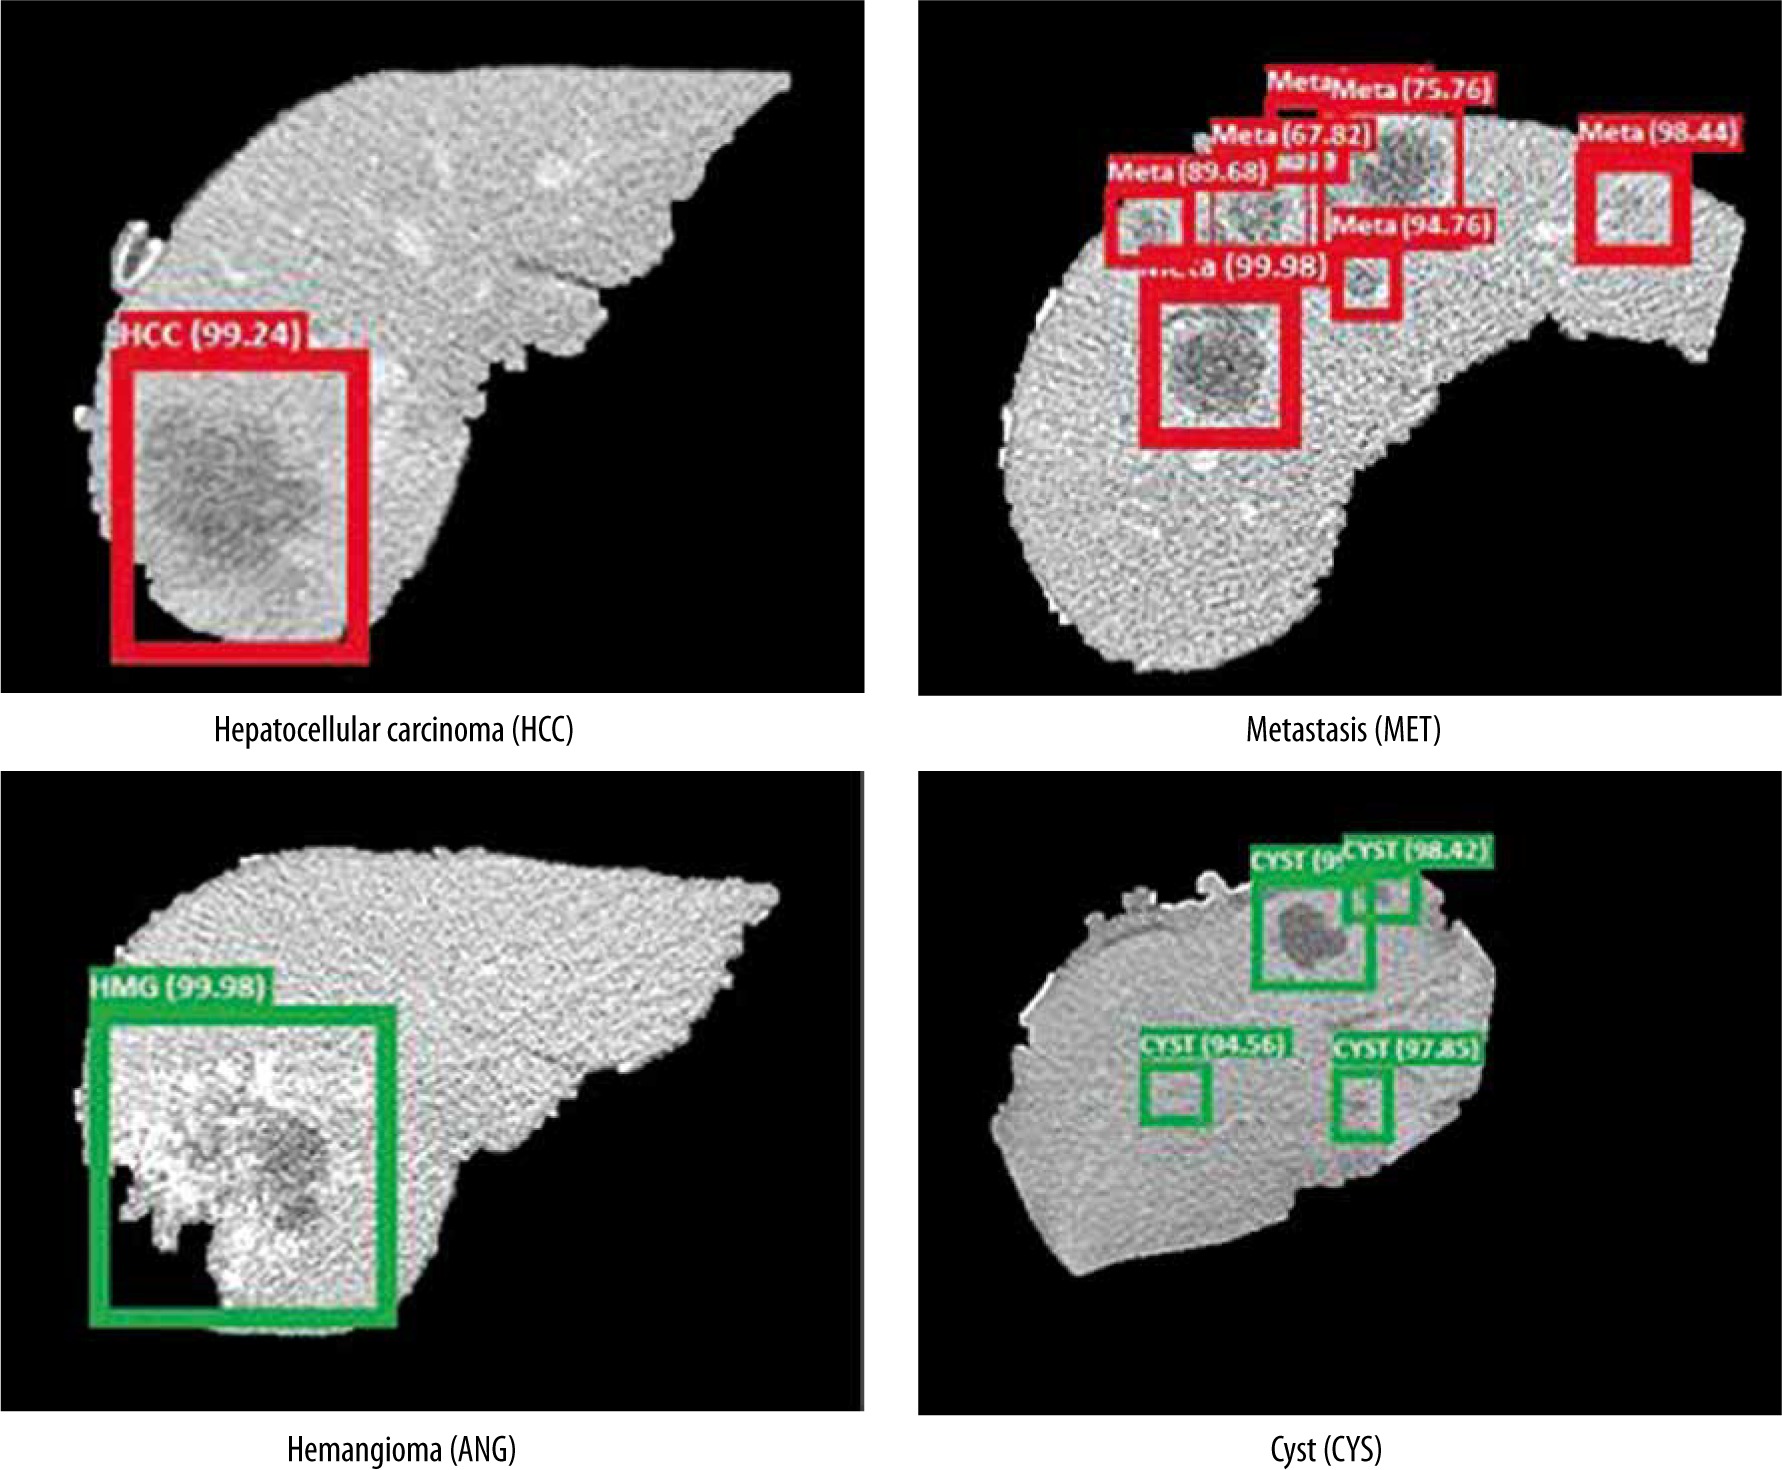
The dice score for liver lesion location was found to be 95.7%, while VOE and RVD were found to be 9.8% and 8.2%, respectively. Liver lesion and classification are shown in Figure 7. Green bounding boxes around the liver lesions show that it was a benign CYS or benign ANG, while red boxes show that the lesion was a malignant HCC or malignant MET. The probability of prediction was also shown above the bounding box locating the liver lesions.
Discussion
In this study, the CNN architecture used for segmenting the liver from CT images was found to be very effective. Training for liver segmentation was done using the area between the border pixel coordinates as the target and the general location of the liver. Similarly, this same architecture can be applied to segment various other organs such as gallbladder, and left and right kidneys, using the specific training dataset. The importance of segmentation comes into play when the classification of certain types of lesions into their respective classes from CT images needs to be done. Machine learning algorithms might easily mistake other organs with similar HU to those of lesions and misclassify them.
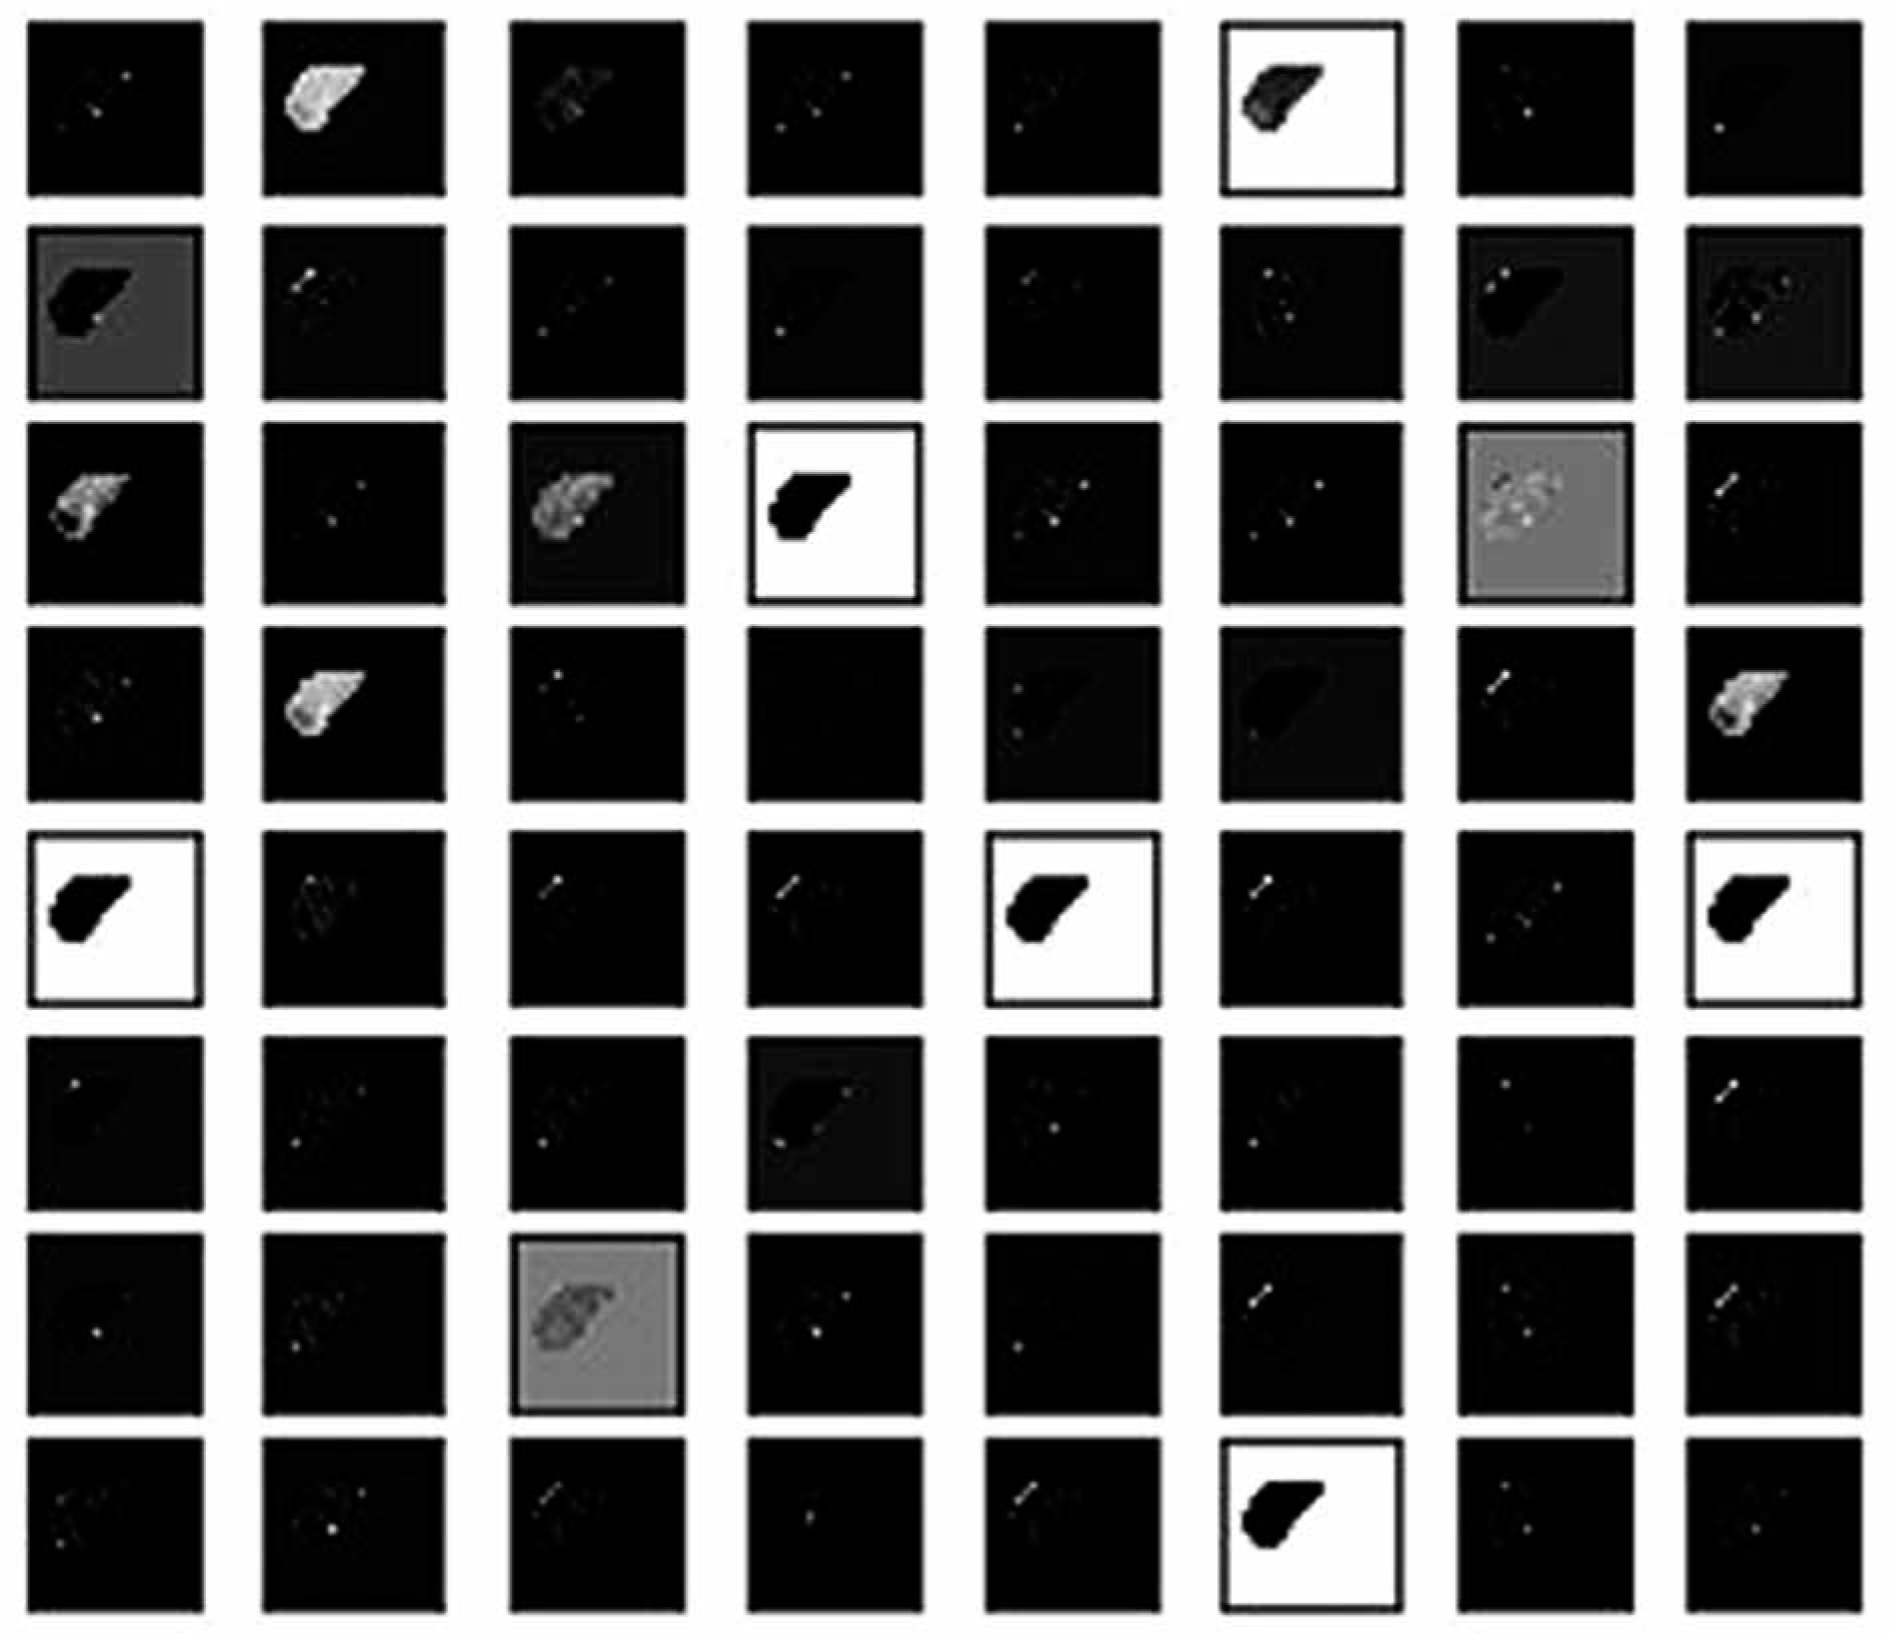
The classification was done based on various filters that detect the shape, size, signal intensity, texture, kinetic curve, contrast, shadows, etc. These filters work like the primary visual cortex in the human brain perceives an optical signal to recognize various patterns. Various filters can be seen in Figure 8 used in the classification of liver lesions into 4 types of disease. Figure 8 shows how the model ResNet 101 perceives a segmented CT image of a liver. These filters were essentially matrices that were multiplied over the original image to identify specific features like shape size, shadow, curves, etc. to classify them into their respective class.
Figure 8
Demonstration of how the proposed model perceives a computed tomography image for classification
Initial testing and validation results showed that the model could recognize multiple lesions present in the liver. Bounding boxes show the location of the lesion and the probability of the classification. The architecture is also capable of recognizing lesions at the border of the liver image. Scan parameters play an important role in the variation of the HU in CT scan images. These images are converted in greyscale for this machine learning algorithm; hence, a slight variation in HU due to varying CT parameters like slice thickness and CT units does not affect the performance. But enhancement phase parameters like contrast and non-contrast images will affect the confidence of the prediction. The pixel value of a non-contrast liver CT image is very low as compared to that of a contrast-enhanced phase. This particular machine learning architecture is trained with a contrast-enhanced image. Hence, a non-contrast image induces confusion, and there is a high probability of obtaining FP results because the pixel value of lesions is also lower.
The proposed segmentation and classification method results for the liver were compared with various previously published methods. According to the dice scores and accuracy, the proposed method was on par with and even outperformed the other methods. The dice score for the model proposed in this study for segmenting the liver was 1.88%, 1.68%, and 0.96% better than the dice scores of Li et al. [25], Christ et al. [21], and Ümit Budak et al. [24], respectively. This signifies that the segmentation of the liver area using the architecture mentioned in this research was more accurate than the ones mentioned above. The VOE signifies the amount of error in the overlap between the segmented image and the reference image. When the overlap is accurate the VOE will be 0%. This architecture showed 10.2% of error in overlap as compared to Christ et al. [21], where the VOE was 10.7 %, while the VOE for Li et al. [25] and Ümit Budak et al. [24] was 9.2% and 9.05%, respectively. These 2 models showed slightly better accuracy in recognizing the location of the liver. Accurate border recognition of the segmented image as compared to the reference image is quantified by RVD. If the segmented image covers more area than the reference image, the RVD is negative, otherwise it is positive. The RVD was found to be 8.4% using the proposed architecture. While the RVD of Christ et al. [21] and Ümit Budak et al. [24] was –1.4% and 7.03%, respectively, making their model more accurate in recognizing borders, the RVD of Li et al. [25] was –11.2%, which means that the proposed model is better at recognizing segmentation borders.
Limitations of the study
The artificial intelligence model requires training with a variety of CT images for it to be reliable. The labelled and accurate CT images required for training are not easily available and require a lot of manual labour. Currently, this model is only trained to segment liver, and to classify and localize 4 types of disease; in terms of medicine, it is limited. Lesions that are abnormally different from the training data, e.g. a tumour that has metastasized in more than one organ cannot be fully localized. If a patient has HCC and a cyst in the same scan image of the liver, it might confuse the algorithm, and the confidence in the prediction will be reduced. This classification model can only be implemented in the segmented liver rather than the entire abdomen CT image.
Conclusions
The CNN model was able to segment the liver from an abdomen CT image with good accuracy, which was comparable to or even better, in some cases, than other models. The segmented liver image with lesions was then trained with a novel MDL-CNN model. The MDL-CNN model performed successfully in localization and classification of 4 types of liver lesions, with high accuracy. It can be implemented as a computer-aided diagnostic system to help doctors and patients, especially in provincial areas.