


Introduction
Hepatocellular carcinoma (HCC) is one of the most prevalent tumours worldwide. The highest incidence rates of HCC (around 85% of cases) are present in East Asia, sub-Saharan Africa, and Melanesia [1].
Because proper staging comes from an accurate diagnosis of HCC, many systems have been developed for the characterization of different liver lesions, and one of these systems is the Liver Imaging Reporting and Data System (LI-RADS). It was developed to overcome difficulties in the characterization of different liver lesions, especially HCC, which was derived from a lack of standardization of liver imaging reporting leading to wide variability in interpretation and diagnosis of liver lesions [2].
Classical features of HCC, i.e., arterial enhancement, porto-venous washout, and the appearance of the delayed capsule, or the so-called criteria-free approach or Likert scale (LS), were used to diagnose HCC [3-5].
The LI-RADS is a reporting system that is designed to improve and reduces variability and difficulties in the elucidation of imaging findings leading to the most accurate diagnosis, proper staging, and hence, proper treatment [6,7].
Therefore, the purpose of our study was to compare the diagnostic performance of LI-RADS and the LS to optimize the diagnosis of HCC.
Material and methods
Patients
This retrospective study was approved by the Institutional Review Board, and informed written consent was obtained for the use of the data of the enrolled individuals.
The study included high-risk patients for HCC (i.e., with history of long-term hepatitis or cirrhosis) with the presence of imaging studies (triphasic computed tomography [CT] and dynamic magnetic resonance imaging [MRI]) and availability of either diagnosis proven by surgical interventions or biopsy or the presence of follow-up studies.
Patients who had previous loco-regional treatment (transarterial chemoembolization [TACE] or radiofrequency [RF] ablation) before the imaging study or previous surgery/biopsy revealing hepatic malignancy other than HCC were excluded from the study.
According to the Child-Pugh scoring system, of these 103 patients, 53 were Child-Pugh score A, 39 were Child-Pugh score B, and 11 were Child-Pugh score C precluding the possibility of surgical or radiological intervention. The performance status (PS) of scores A and B ranged from 0 to 2 while the PS of those with score C was above 2.
CT examinations were performed on a 64-row scanner (GE Light Speed). First, non-enhanced scanning was performed at a tube voltage of 120 kVp (180 milli-ampere seconds, 0.8 pitch, 0.5 s/rotation, DFOV 42 cm2, matrix 512 ´ 512, and 32 ´ 1.2 mm collimation). Patients were then injected with nonionic contrast material (Ultravist 370; Bayer Schering Pharma, Berlin, Germany) using a CT-compatible power injector. Scans were acquired during the late hepatic arterial phase, portal venous phase, and the delayed phase.
MRI examination was performed with a 1.5 T scanner (Philips Achieva). First, a pre-contrast study was performed followed by a dynamic study performed after a manual bolus injection of 0.1 mmol/kg body weight of Gd-DTPA and flushed with 20 ml of sterile saline solution. It comprised 4 successive post-contrast series including early arterial, late arterial, and portal phases with 19-21-second intervals (17 s for image acquisition with breath-holding and 2-4 s for re-breathing). This was followed by 3-min delayed phase imaging. All patients were imaged in end-expiration to limit the risk of image misregistration. Functional diffusion-weighted imaging (DWI) was performed using single-shot spin-echo-planar imaging during one or more breath holds.
Image evaluation
Analysis of the CT and MRI studies was accomplished by independent double reading by 2 different imaging radiologists with at least 10 years’ experience. The readers independently reviewed each hepatic focal lesion, the 1st reader using LI-RADS and the 2nd reader using the LS. Readers were blinded to each other’s analysis.
The first reader, using LI-RADS, evaluated each lesion in the liver for 6 imaging features: tumour diameter, arterial phase hyper-enhancement, washout appearance, capsule, tumour embolus within a vein, and the tumour growth rate if possible within 6 months, then the reader assigned a final LI-RADS score in the range 1-5.
The second reader used the LS. He measured the largest diameter of the liver observation in the axial plane on the sequence, where the observation was best depicted, then he assessed each lesion for the enhancement pattern, washout appearance, capsule appearance, presence of a tumour within a vein, T2 signal as compared to the liver parenchyma, and lesion signal on DWIs and apparent diffusion coefficient (ADC) map. Finally, he assigned a likelihood score for HCC on a 5-point LS, on which LS-1 was defined as definitely benign, LS-2 probably benign, LS-3 indeterminate, LS-4 probably HCC, and LS-5 definitely HCC.
Statistical analysis
Data were analysed using IBM SPSS advanced statistics (Statistical Package for Social Sciences), version 22 (SPSS Inc., Chicago, IL). Qualitative data were described as numbers and percentages. McNemar’s test was used to examine the relationship between paired nominal data. The k statistic was used to assess inter-rater agreement between the 2 scales. The 95% confidence intervals, sensitivity, specificity, positive value of prediction, and negative value of prediction with their 95% confidence interval were calculated. A p-value less than or equal to 0.05 was considered statistically significant. All tests were 2-tailed.
Results
Sixty-two patients were males (60.25) and 41 were females (39.80%). Their mean age was 59.3 ± 12.3 (SD) years. A final cohort of a total of 103 examinations was done (53 triphasic CT study [51.45%] and 50 dynamic MRI study [48.50%]). Of the 103 included patients, a total of 110 hepatic focal lesions were determined by CT or MR imaging. This included 51 HCC lesions and 59 non-HCC lesions (Table 1).
Table 1
Analysis of non-hepatocellular carcinoma lesions
First, the inter-reader agreement for major diagnostic features of HCC (Table 2) was calculated. It was almost perfect for measured diameter (k = 0.981), good for determination of arterial phase enhancement (k = 0.705), porto-venous phase washout (k = 0.763), and capsule appearance (k = 0.771), and it was excellent for determination of tumour embolus within a vein (k = 0.927). The overall inter-reader agreement for the final score was also excellent (k = 0.898).
Table 2
Inter-reader agreement for major diagnostic features of hepatocellular carcinoma
The comparison between the frequency of major features detected by both the LI-RADS and the LS systems revealed similar results. Arterial phase enhancement was the most frequently observed major criterion, seen in 67/110 (60.9%) of lesions using the LR system and seen in 66/110 (60.0%) in LS. Washout appearance was the second most frequently detected major criterion, seen in 45/110 (40.9%) of lesions using the LR system and seen in 54/110 (49.10%) using the LS. Capsule appearance was seen only in 24/110 versus 27/110 (21.8% vs, 24.5%) of lesions seen in LR versus LS, respectively.
The distribution of integrated scores using both systems is illustrated in Figure 1, and the percentage of overscoring and underscoring of the LS over LI-RADS as well as the intraclass agreement of both systems are shown in Table 3.
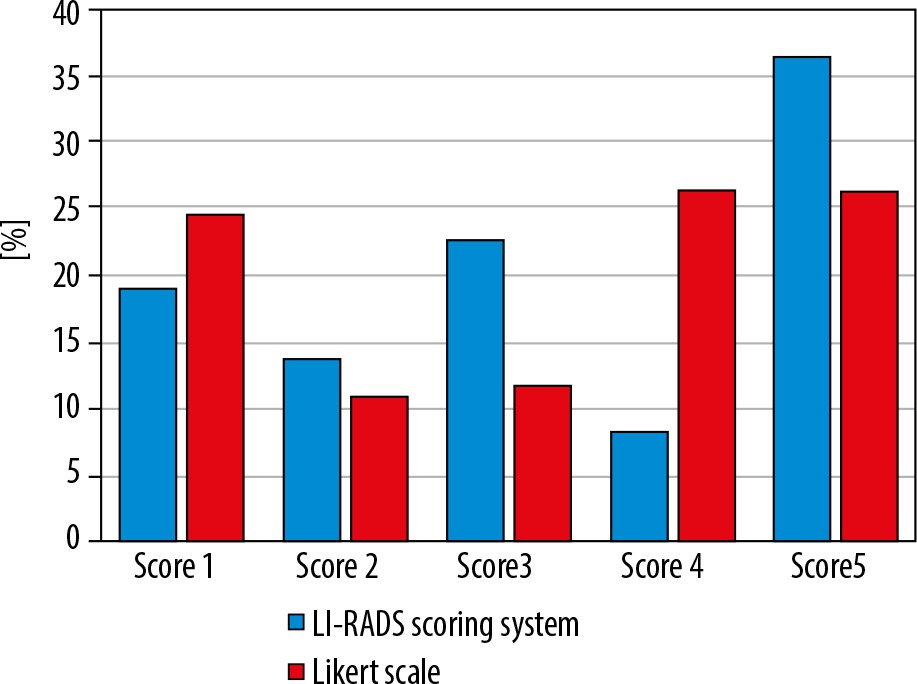
Table 3
Comparison of the scoring results and the intraclass agreement of Liver Imaging Reporting and Data System (LI-RADS) and Likert scale (LS) approach
The total k agreement between the 2 methods for stratifying 110 hepatic lesions in this study was 0.32. (fair agreement). Both scoring methods show good agreement at score 1 (k = 0.682), fair agreement at score 2 (k = 0.36), and moderate agreement at score 5 (k = 0.52). There was no agreement between the 2 scoring methods at score 3 (k = –0.059) and score 4 (k = -0.002).
As compared with LI-RADS, the LS approach produced 36% (9/25) overscoring and 16% (4/25) underscoring of the lesions with LR-3 and resulting in 44.4% (4/9) overscoring and 33% (3/9) underscoring of the lesions with LR-4.
The diagnostic performance of each scale for determination of HCCs is shown in Figure 2. LI-RADS produced higher accuracy (87.3% vs. 80%), lower sensitivity (84.3% vs. 98%), and significantly higher specificity (89.83% vs. 64.4%) in correlation to the LS approach. LI-RADS had also a higher positive likelihood ratio (+LR: 8.29 vs. 2.75) and higher positive predictive value (Ppv = 87.80% vs. 70.42%) than did the LS approach.
Figure 2
Performance for determination of hepatocellular carcinoma stratified by Liver Imaging Reporting and Data System (LI-RADS) and Likert scale (LS)

Figure 3
Triphasic computed tomography in a 63-year-old patient revealed a 34-mm hepatic observation (E) which is hypo-enhancing relative to liver parenchyma in the arterial phase (B). It does not appear to be definitely or probably benign and does not exhibit features of non-hepatocellular carcinoma (HCC) malignancy or tumour within a vein; also, there is no “capsule” or “washout” in the delayed phase (D). Using the Liver Imaging Reporting and Data System (LI-RADS) table, it was categorized LR-3: intermediate probability for HCC. Using the Likert scale, the lesion shows no appreciable contrast enhancement in the arterial phase (B) and is most conspicuous in the delayed phase (D), which could be hypovascular HCC. This lesion was assigned LS-4. Biopsy and histopathological results confirmed stage 4 cirrhosis with associated marked steatosis and no evidence of malignancy (non-HCC group)
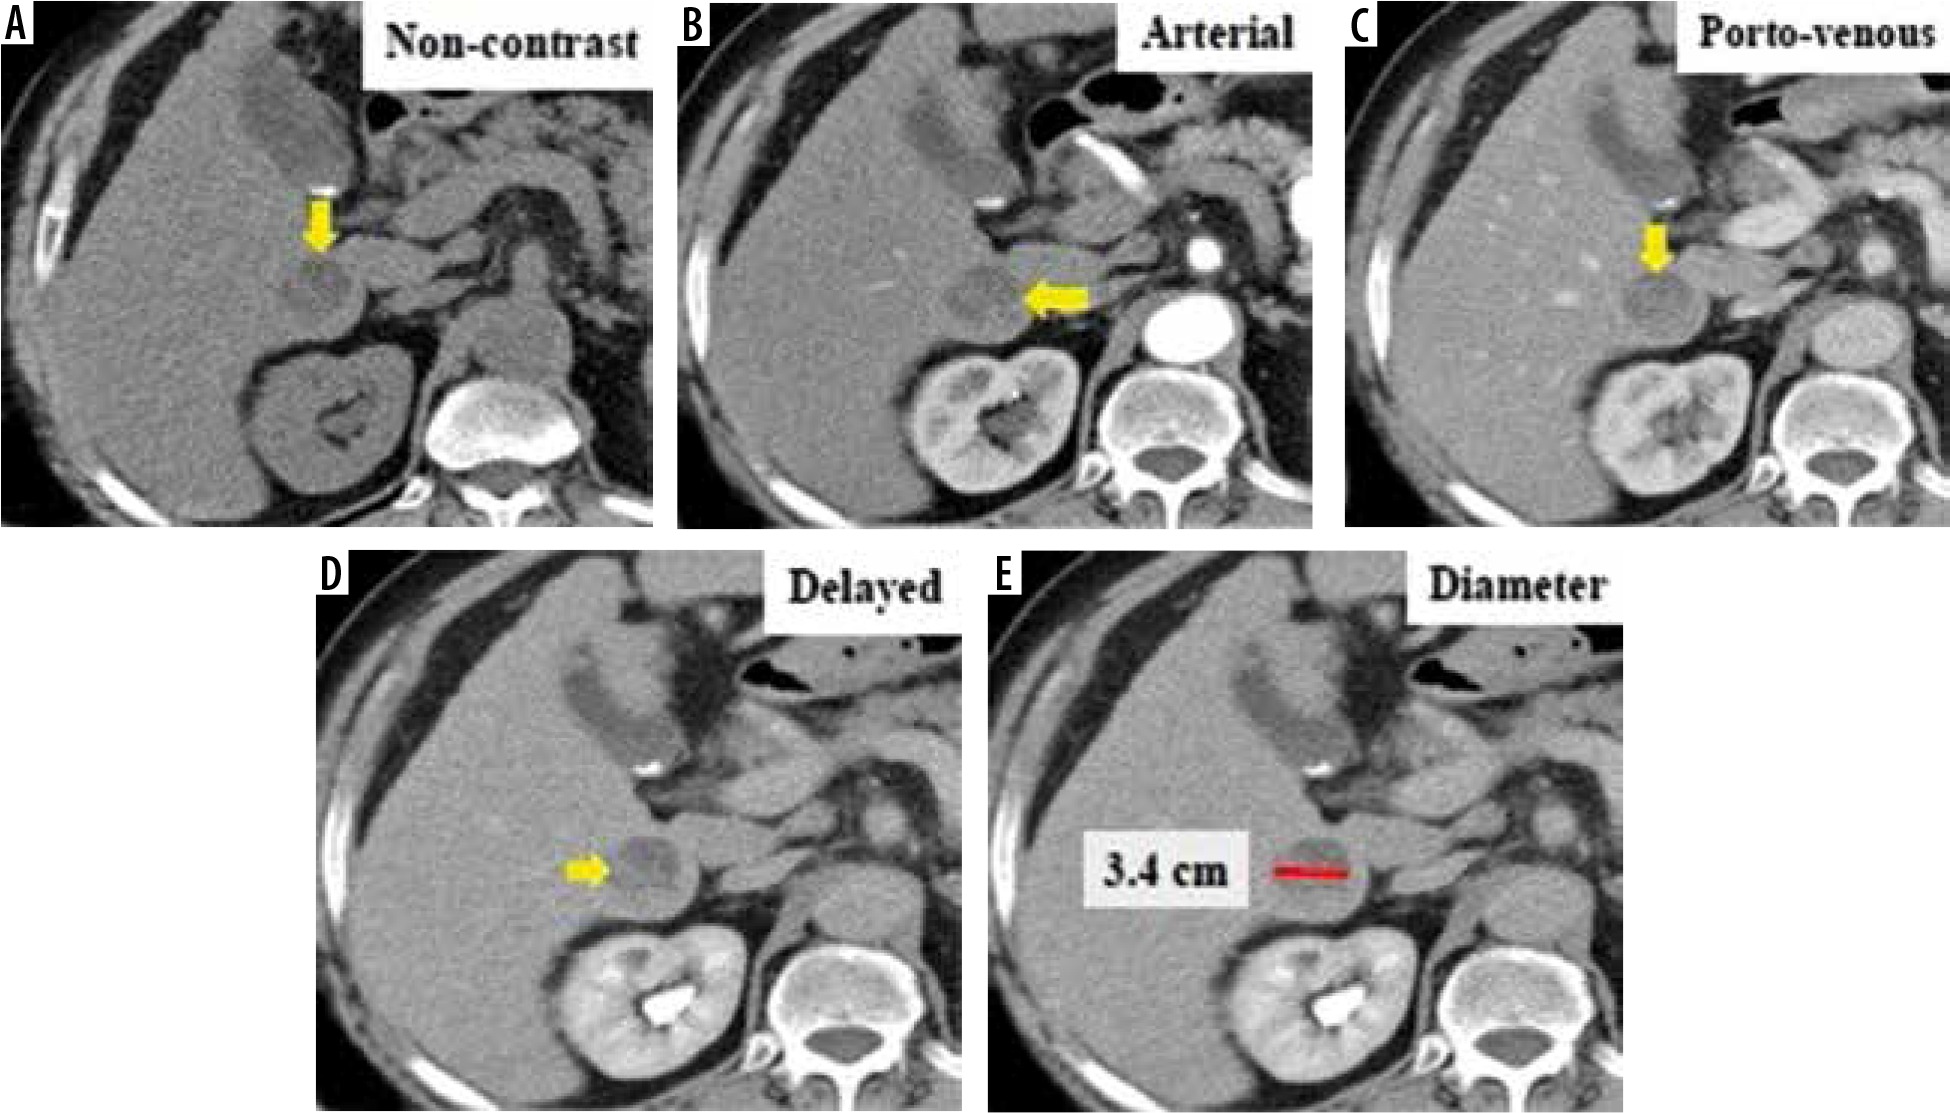
Figure 4
Dynamic magnetic resonance imaging depicts multiple hepatic observations, the largest measuring 22 mm in diameter (A). They are showing arterial phase peripheral rim of enhancement (A, B). The rim of arterial-phase enhancement progressively expands inwardly in the later phases (C, D) to fill most of the observation. The intensity of enhancement approximately parallels that of the blood pool. These observations were thought to be typical haemangiomas and considered probably benign. Using the Liver Imaging Reporting and Data System (LI-RADS) table, they were categorized LR-1: definitely benign. Using the Likert scale, the largest is seen at segment IV measuring 22 mm in diameter (A) eliciting high signal intensity in T2WIs (E) and heavy T2 (F) with peripheral nodular enhancement in the arterial phase (A, B) and progressive centripetal filling of contrast in the following phases (C, D), probably multiple hepatic haemangiomata. These lesions were assigned LS-1. Biopsy and histopathological results confirmed benign hepatic haemangioma (non-hepatocellular carcinoma group)
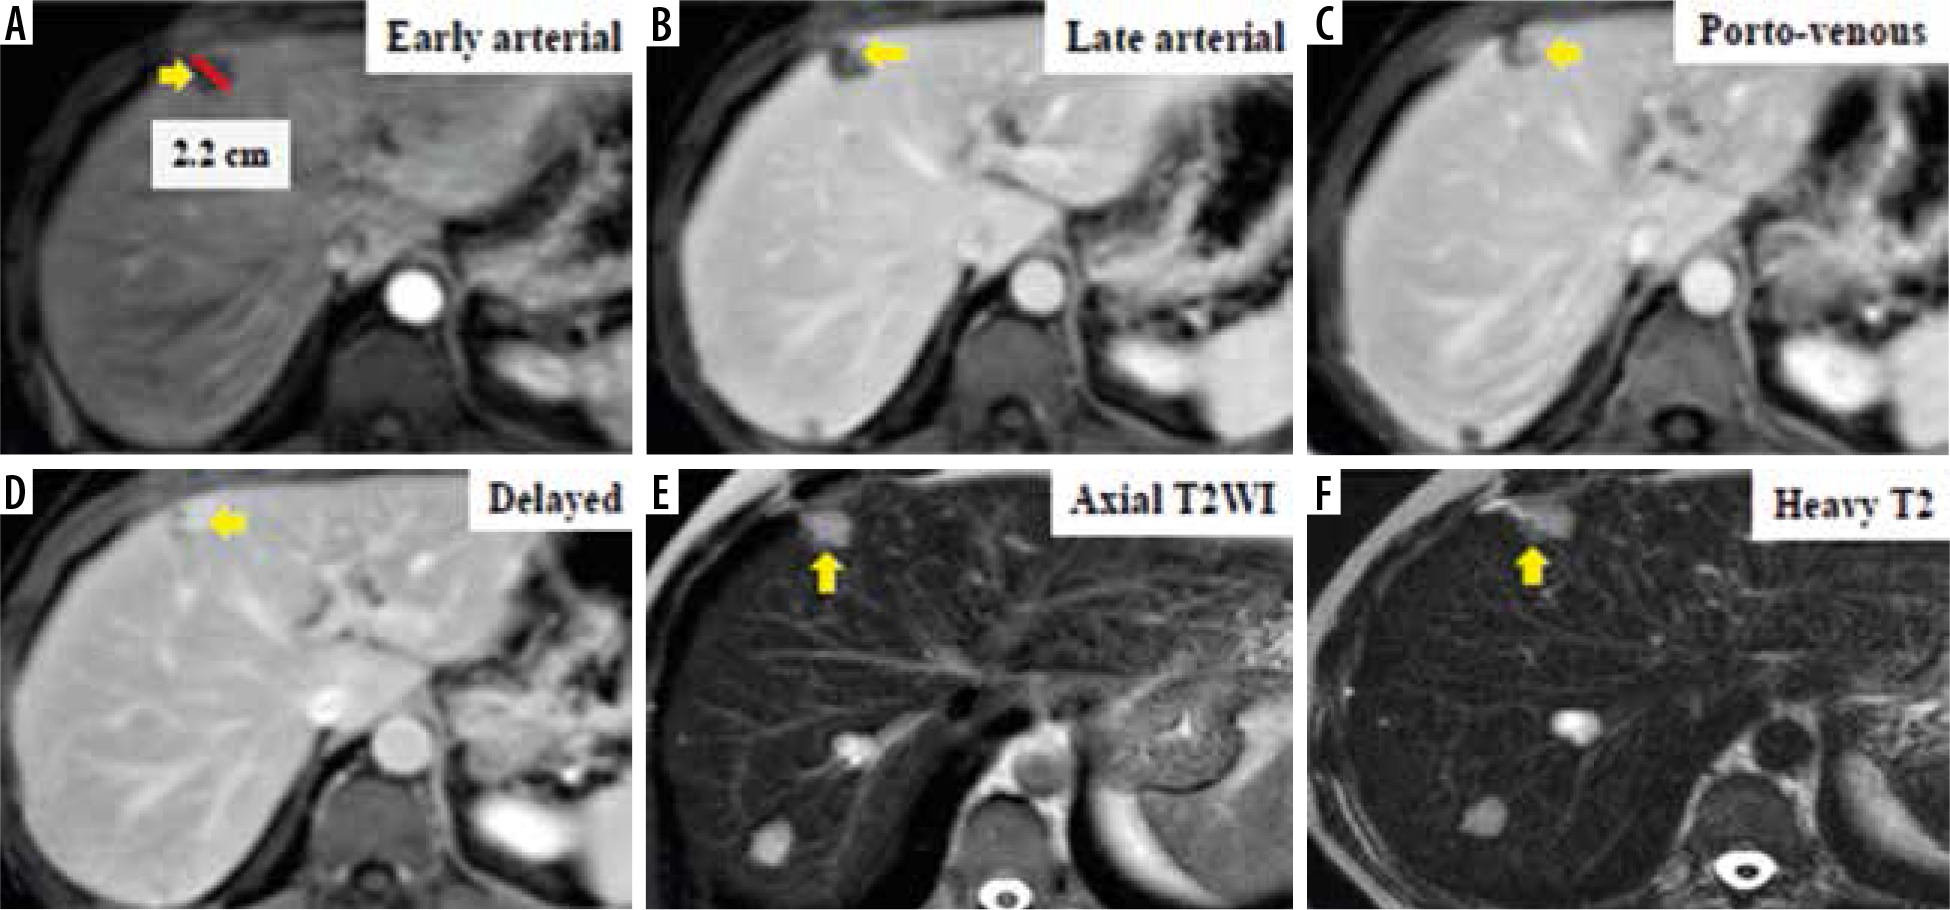
Figure 5
Dynamic magnetic resonance imaging shows a 41-mm heterogeneous mass (D) that is hypo-enhancing to the liver parenchyma in the arterial phase (A). It does not appear to be definitely or probably benign and does not exhibit features of non-hepatocellular carcinoma (HCC) malignancy or tumour within a vein. “Capsule” is visible on delayed phase imaging (C). There is no washout appearance in the delayed phase, which could be atypical HCC (C). Using the Liver Imaging Reporting and Data System (LI-RADS) table, it was categorized as LR-4: probably HCC. Using the Likert scale, it was assigned LS-4. This lesion was biopsied, and the histopathological results confirmed HCC (HCC group)

Figure 6
Triphasic computed tomography revealed a 50 mm hepatic observation (C) which is hypo-enhancing relative to liver parenchyma in the arterial phase (B). It does not appear to be definitely or probably benign and does not exhibit features of non-hepatocellular carcinoma (HCC) malignancy or tumour within a vein; also, there is no “capsule” or “washout” in the delayed phase (D). Using the Liver Imaging Reporting and Data System (LI-RADS) table, it was categorized LR-3: intermediate probability for HCC. Using the Likert scale, the possibility of hypovascular/atypical HCC could not be excluded, so it was assigned LS-4. Biopsy and histopathological results confirmed benign hepatic haemangioma (non-HCC group)

Discussion
In this study, we investigated the diagnostic performance of both the LI-RADS system and the LS for the diagnosis of HCC. We found that both LI-RADS and LS delivered high diagnostic accuracy, being higher in the LI-RADS system (87.3% vs. 80%, respectively).
The LI-RADS produced lower sensitivity as compared to the LS scale (84.3% vs. 98%, respectively). The LS approach delivered significantly lower specificity than LI-RADS (64.41% vs. 89.83%). Also, LI-RADS had a higher positive likelihood ratio (+LR) than did the LS.
This was very similar to the results revealed in a comparable study by Zhang et al. except they revealed lower accuracy of LIRADs as compared to the LS scale, which may be related to the strict criteria of LI-RADS for the definition of each scale to deliver very high specificity for HCC at the expense of reducing its accuracy [2].
Another study by Esposito et al. revealed the following results using the LI-RADS: accuracy = 80%, sensitivity = 72%, and specificity = 93%. As for the LS, the results were as follows: accuracy = 79%, sensitivity = 73%, and specificity = 87% [8]. Although their study delivered high accuracy and sensitivity of both LI-RADS and LS (and this may be because of the higher accuracy of MRI studies over using both CT and MRI as in our study), their results were consistent with our current study results regarding higher accuracy and specificity and lower sensitivity of LI-RADS as compared to the LS.
Studies by Davenport et al. and Wolfgang et al. showed a high inter-reader agreement for arterial enhancement and a moderate agreement for washout appearance and pseudo-capsule [9,10]. This is comparable to our study results revealing that the inter-reader agreement was good for the determination of arterial phase enhancement, portovenous phase washout, and capsule, indicating some difficulties in the definition of some specific imaging features between the different readers.
This study revealed obvious variations in liver lesions reported by the LI-RADS and LS approaches. The lesions with definitely benign, probably benign, and malignant were well classified by both methods. There were inconsistencies, particularly a lack of agreement between the 2 methods for the classification of intermediate and probable HCC. We noted that the differences mainly appeared in the characterization of lesions with score 3 and score 4 (intermediate and probable HCC), and this was consistent with the study by Zhang et al. that also showed obvious variations in liver lesions reporting between the LI-RADS and LS methods [2]. Both of them were consistent in the determination of the lesions with the definitely benign and probably benign, moderate agreement in stratifying intermediate and definite malignancies, but showed poor agreement in the determination of probable malignancy and revealed that variations between both scoring systems were mostly found in the determination of intermediate and probable HCC lesions.
This study had some limitations. First, it was a single-centre retrospective study, which may have led to some bias in the patient selection. Second, we used different imaging modalities that might introduce some heterogeneity, but it can be also seen as a point of strength because this heterogeneity is our everyday clinical practice.
Finally, we used follow-up and histopathology as our reference standard, and the imaging follow-up is not as pertinent as the histopathology because not all liver lesions undergo histopathological correlation giving the fact there is a trend towards replacing pathology with accurate diagnostic imaging.
Conclusions
Hepatocellular carcinoma can be diagnosed and properly staged using different imaging modalities aimed at achieving high specificity. The LI-RADS and LS systems represent basic approaches for the diagnosis of HCC. Many differences were found in liver lesions reporting by the LI-RADS and LS methods. In our work, the LI-RADS revealed higher diagnostic accuracy as compared to LS, with statistical proof of higher specificity and positive likelihood ratio indicating its ability to foretell malignancy in the high-risk patients. We recommend the practical application of the LI-RADS system in the detection and treatment response monitoring of patients with HCC.