


Introduction
An outbreak of the novel coronavirus (nCov-19), responsible for the coronavirus disease 19 (COVID-19), was reported for the first time in December 2019, in China. This disease has a presentation ranging from lack of clinical signs to severe interstitial pneumonia, acute lung injury (ALI), and acute respiratory distress syndrome (ARDS) [1].
The usual radiological features during the COVID-19 disease process include multiple extensive or patchy predominantly peripheral areas of subpleural and peri-bronchovascular ground glass opacities with interlobular septal thickening and consolidation in bilateral lungs predominantly with apicobasal gradient and posterior predominance.
Previous studies have reported that advanced age, male sex, smoking and chronic alcoholism, comorbidities like coronary artery disease, diabetes, and hypertension, prolonged ICU stay, and mechanical ventilation are risk factors for lung involvement in COVID-19 [2,3].
There is evidence that post-viral lung fibrosis can develop after other respiratory coronaviral infections. It has been hypothesized that COVID-19 also leads to fibrotic complications in the lungs [3]. Various mechanisms, including viral- and immune-mediated mechanisms, have been implicated in the development of fibrosis [3].
Material and methods
A retrospective analysis of high-resolution computed tomography (HRCT) thorax of all cases who were COVID-19 positive during and post disease from 1 June 2020 to 31 September 2021.
Study area: Department of Radio-diagnosis, Wenlock District Hospital, Mangalore; Department of Radio-diagnosis, KMC Hospital, Attavar, Mangalore; Department of Radiodiagnosis, KMC Hospital, Ambedkar Circle, Mangalore.
Study population: HRCT thorax of COVID-positive cases done during the disease process and in the recovery/post-recovery phase were included in the study.
Study design: a retrospective cross-sectional study.
Sample Size: 75.
Inclusion criteria: HRCT thorax of all COVID-19-positive cases done during the disease process and post recovery.
Exclusion criteria: 1) HRCT thorax of cases in whom post recovery computed tomography (CT) was not done; 2) HRCT thorax of cases who did not undergo CT scanning during the disease; 3) HRCT thorax of cases who are k/c/o pulmonary fibrosis.
Statistical analysis
Data were entered into a Microsoft Excel data sheet and was analysed using SPSS 22 software. Categorical data are represented in the form of frequencies and proportions. The c2 test was used as a test of significance for qualitative data. Continuous data are represented as mean and standard deviation.
Graphical representation of data: MS Excel and MS Word were used to obtain various types of graphs such as bar diagrams.
A p-value (probability that the result is true) of < 0.05 was considered as statistically significant after assuming all the rules of statistical tests.
Statistical software: MS Excel and SPSS version 22 (IBM SPSS Statistics, Somers NY, USA) were used to analyse the data.
Data collection tool
All the imaging was obtained as described per standard imaging protocol.
CT imaging: A high-resolution CT of the thorax was usually obtained volumetrically and reformatted in 3 planes (sagittal, axial, and coronal). CT equipment included the following: Somatom GO now 32-slice (Dist. Wenlock Hospital); BRIGHT SPEED Elite 16-slice MDCT GE medical systems (KMC Ambedkar); CT BRIVO 385-EXCITE 16-slice – GE (KMC Attavar).
All CT imaging was interpreted by the institutions’ own radiologists. Furthermore, all the images with the patients’ clinical details after anonymization were collected and reviewed for data analysis purposes.
Discussion
This was a short-term study in which CT scans of all casesthat met the inclusion criteria from 1 June 2020 to 31 September 2021 were taken and analysed. A total of 75 cases that completed both CT scans were evaluated. The main limitation of this study was that the analysis was performed on a small sample size.
The mean age of cases was 55.52 years, as shown in Table 1 and Figure 1. In this study, younger patients showed a better outcome in the convalescence period. Older patients seemed to have a higher incidence of post-COVID pulmonary sequelae.
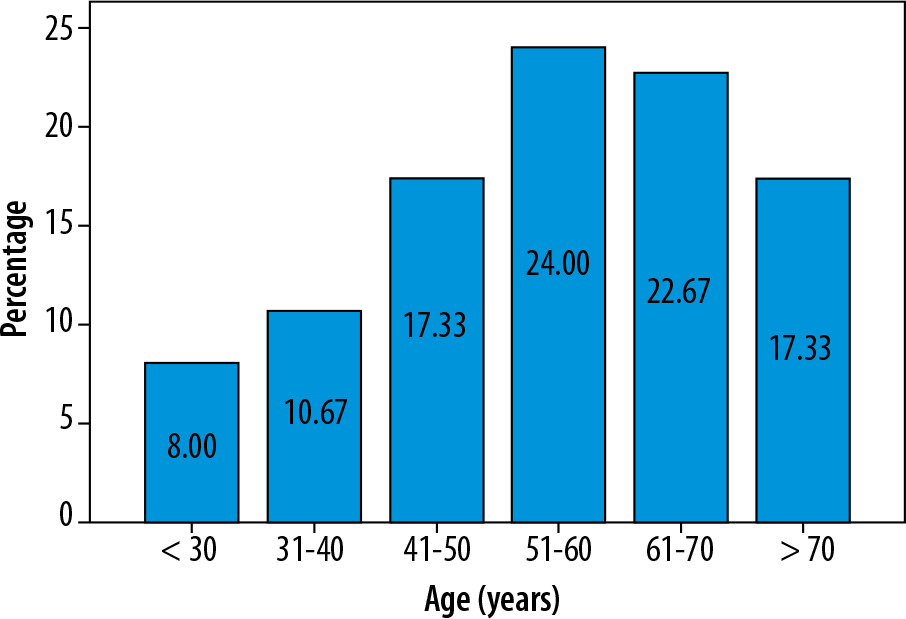
Table 1
Age distribution of subjects (N = 75)
| Age (years) | n (%) |
|---|---|
| < 30 | 6 (8.0) |
| 31-40 | 8 (10.7) |
| 41-50 | 13 (17.3) |
| 51-60 | 18 (24.0) |
| 61-70 | 17 (22.7) |
| > 70 | 13 (17.3) |
Initial CT findings mainly included ground glass opacity (GGO) (93.3%), interlobular septal thickening (66.7%), consolidation (52%), and fibrotic bands (8.0%) (Table 2, Figure 2).
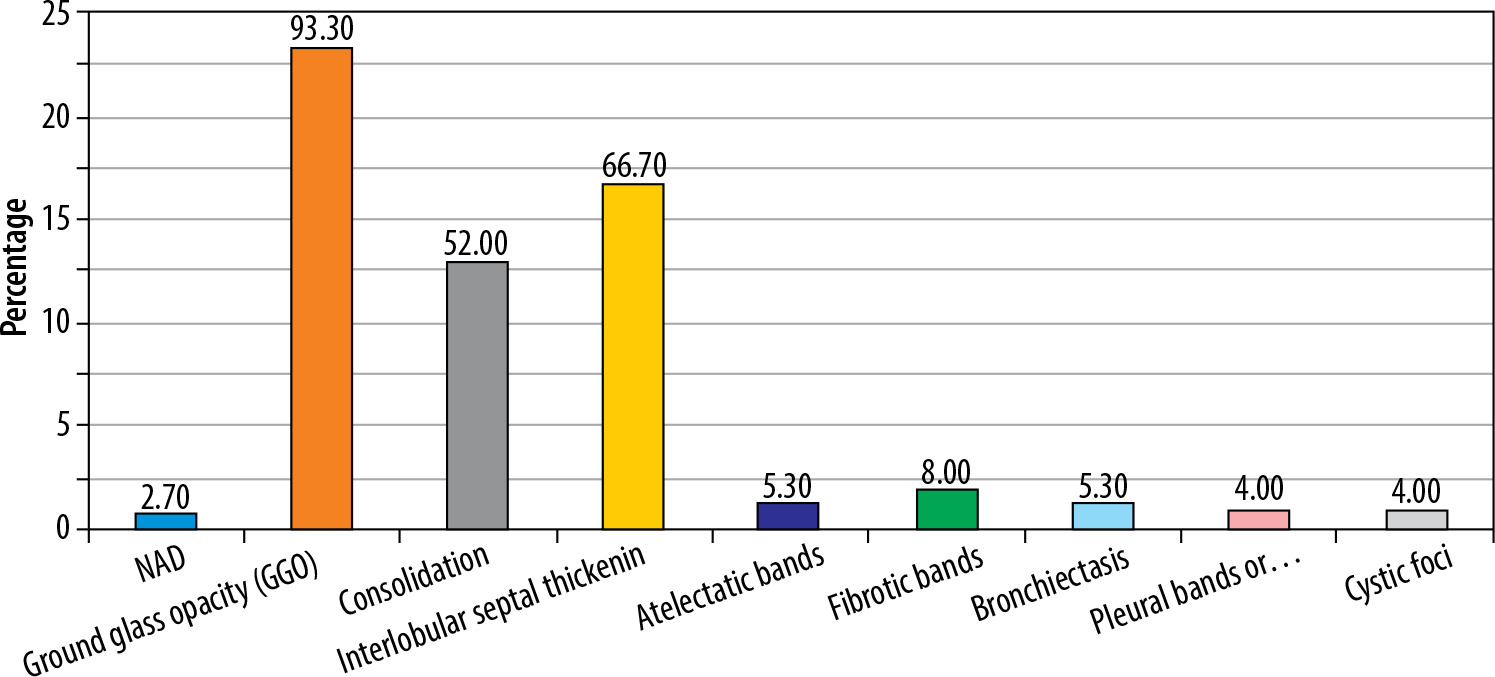
Table 2
Initial computed tomography (CT) findings distribution
Liu et al. [2] documented the CT findings on a follow-up CT at 3 weeks. They found that complete disease resolution was seen in approximately 50% of patients, and 40% of the patients showed residual abnormalities, mostly in the form of GGO and fibrous stripes. In our study, pulmonary lesions were found to completely resolve in 8% of patients on follow-up CT (Figure 4, Table 3). This was mostly seen in younger patients. 92% of the CT scans, however, demonstrated some pulmonary change in the follow-up CT (Figures 5-7, Table 3). This was mostly in the form of GGO (58%). Other changes included consolidation (45.3%), interlobular septal thickening (41.3%), fibrosis (17.3%), bronchiectasis (14.7%), atelectasis (10.7%), and emphysema (5.3%), as seen in Table 3 and Figure 3. This difference could be attributed to the fact that our study included critically ill patients whereas the study done by Liu et al. did not.
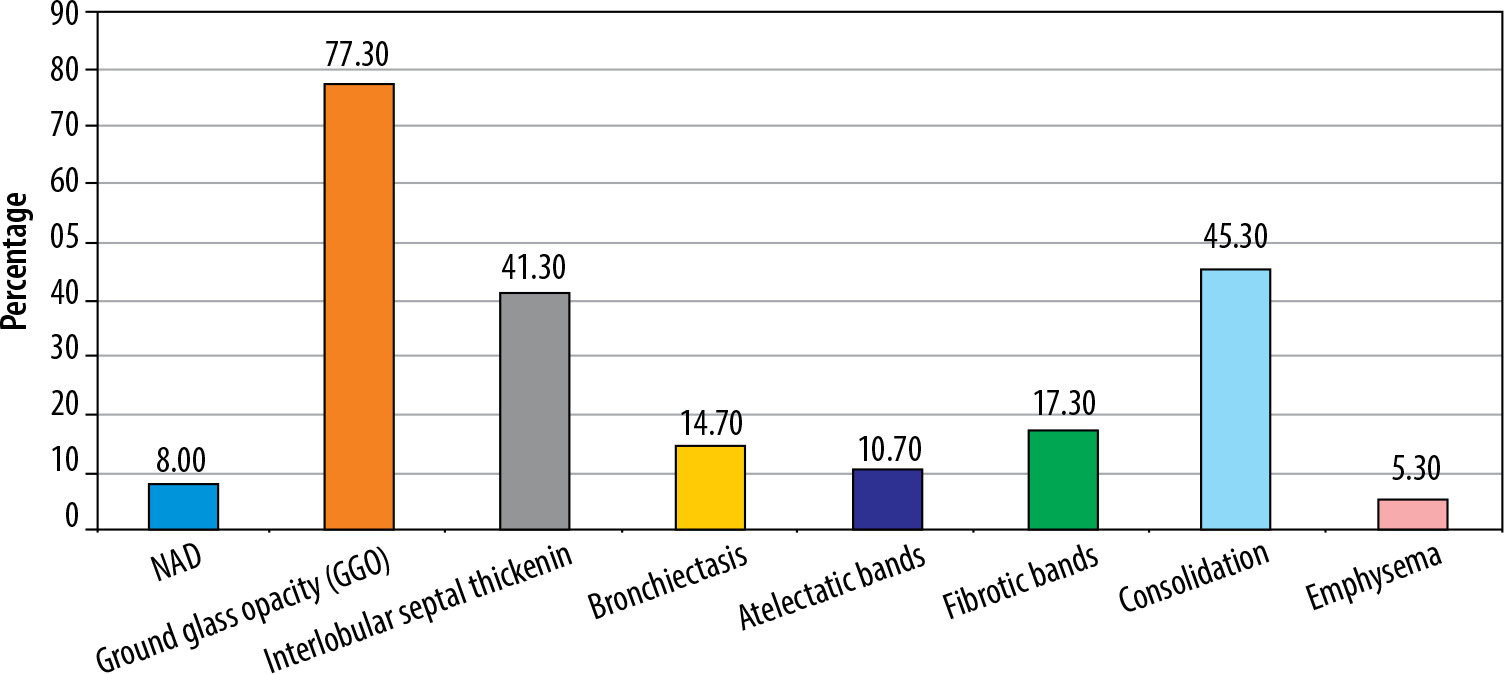
Figure 4
Comparative computed tomography images taken 15 days apart. A) Ground glass opacities. B) Resolution of the same ground glass opacities
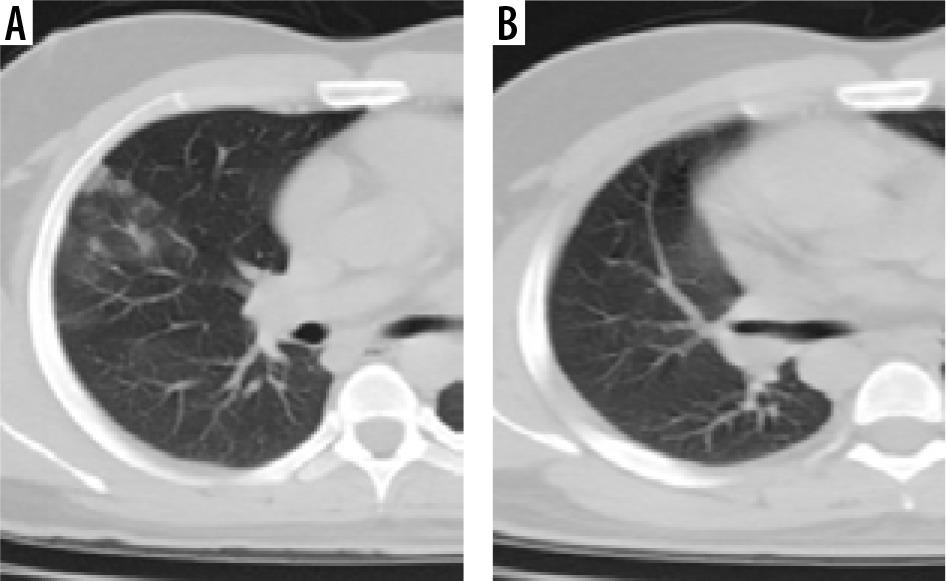
Figure 5
Comparative computed tomography images taken 18 days apart. A) Multifocal bilateral peripheral and peribronchovascular areas of ground glass opacities; B) shows that involved areas of bilateral lung fields have progressed to consolidation and show fibrotic changes
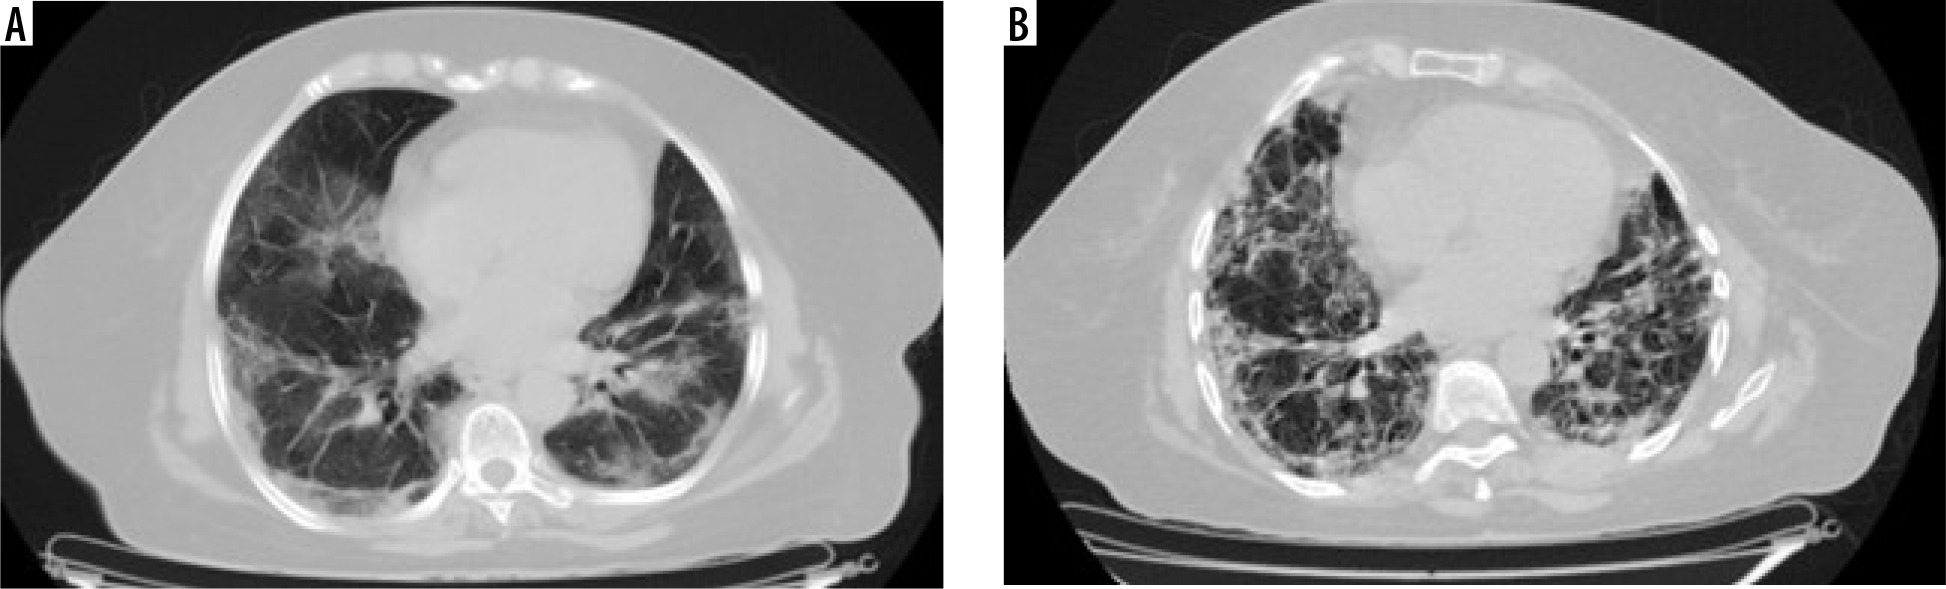
Figure 6
Comparative computed tomography images taken 67 days apart. A) Predominantly peripheral subpleural ground glass opacities with interstitial septal thickening and minimal bronchiectasis; B) shows subpleural areas of fibrotic changes, adjoining minimal ground glass attenuation, and bronchiectatic changes
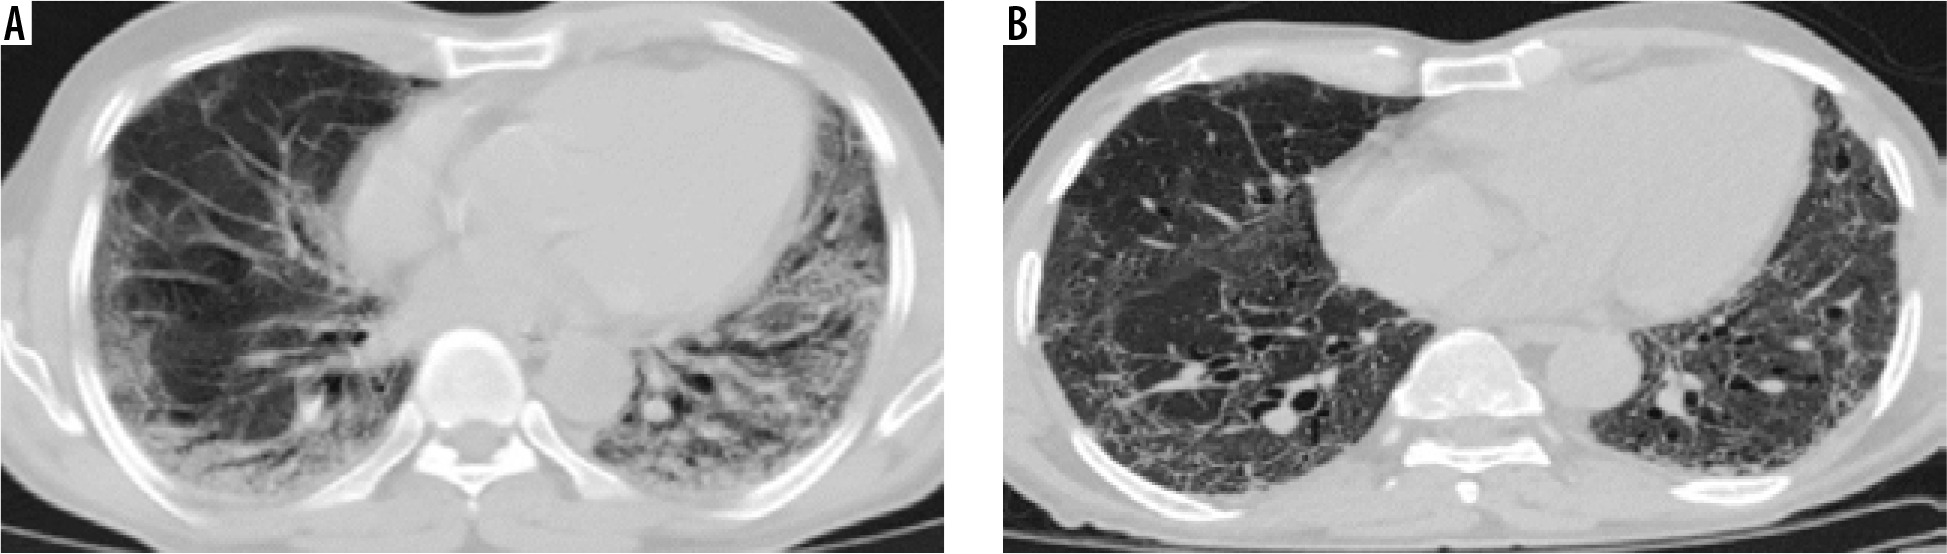
Figure 7
Comparative computed tomography images taken 18 days apart: (A) shows patchy predominantly peripheral areas of subpleural and peribronchovascular ground glass opacities and consolidation with interlobular septal thickening; (B) shows multiple linear fibrotic strands scattered in bilateral lungs with residual ground glass attenuation
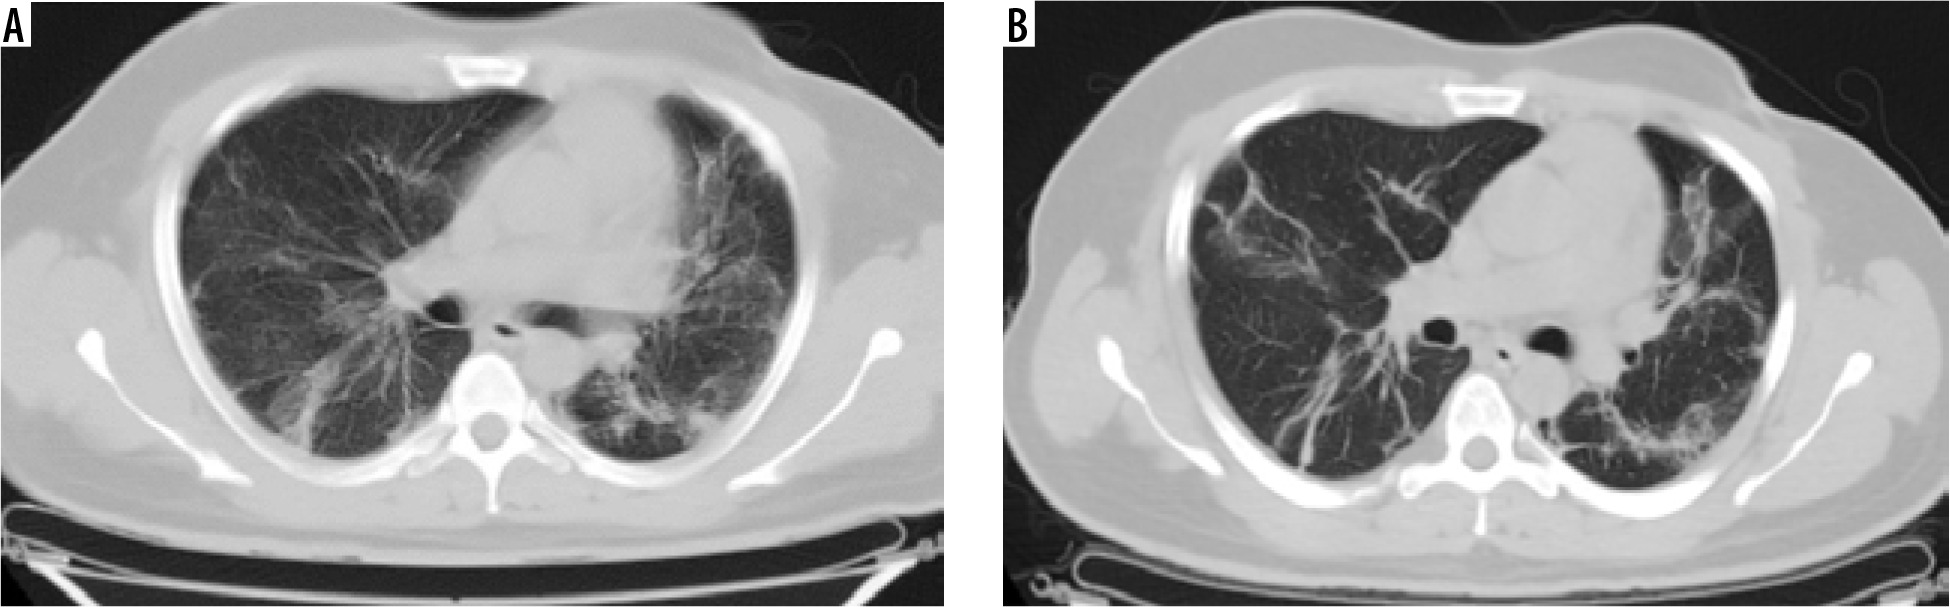
Table 3
Follow-up computed tomography (CT) findings distribution
Liu et al. [2] further showed that patients with a higher initial CT severity score developed fibrotic changes in the lungs at 6 months. In this study, it was seen that patients who initially had severe disease showed more changes in the follow-up CT as compared to those who had mild to moderate disease. This further indicates that in patients with severe disease, GGO persisted for a relatively long time and were absorbed slowly.
Zhao et al. [4] conducted a study to determine the imaging findings and physiological features/clinical charac-teristics after a follow-up of 3 months. They found that about 70% of patients had persistent HRCT abnormalities, of which interstitial thickening, crazy paving, and ground glass opacities were the common findings. These findings are consistent with our study, with 92% of the cases showing HRCT abnormalities in follow-up CT (Table 3 and Figure 3).
In a study done by Han et al. [5] fibrotic changes were documented in about 35% of patients at 6-month follow-up, and these included traction bronchiectasis, parenchymal bands, and/or honeycombing. Our study shows similar findings, with ~17% of cases showing fibrotic changes in the follow-up CT (Table 3 and Figure 3).
Early probable fibrotic bands were seen to develop as soon as 4 days in one case. In maximum cases, fibrotic changes on follow-up CT were associated with GGO or consolidation. In 3 cases (4%), fibrotic changes were seen even without GGO or consolidatory changes.
Kumar et al. [6] in their study showed that in patients who presented one month or more after discharge, CT findings of traction bronchiectasis and cystic changes were seen, whereas those who presented within a month showed CT findings such as consolidations and subpleural fibrous stripes. In our study 53 out 75 cases (70.66%) had a follow-up CT done within a month of the initial CT, out of which 44% of cases had a follow-up CT within 14 days (Table 5). Most of these showed HRCT findings of consolidation, GGO, and interlobular septal thickening. Hence, these findings are consistent in both the studies.
Table 4
Comparison of initial computed tomography (CT) and follow-up CT findings
Conclusions
Post-COVID lung sequelae can be present in a significant number of patients. This is most commonly seen in patients with severe initial disease. Older patients are at higher risk of developing post-COVID pulmonary sequelae. Lung changes may resolve completely post COVID infection in younger patients or patients who initially had mild to moderate disease. Statistically significant post-COVID sequelae changes include GGO, fibrotic bands, and bronchiectasis (Table 4). Early probable fibrotic bands may develop within one week of disease. However, future studies are warranted to further assess the progression of these changes after a longer duration post recovery.