


Introduction
Chronic obstructive pulmonary disease (COPD) is a significant contributor to morbidity and mortality worldwide. It is estimated that COPD will become the fourth leading cause of death by the year 2030 [1]. COPD is typified by the occurrence of an airway obstruction, which is non-reversible on bronchodilator administration and occurs secondarily to airway narrowing, emphysema, or a combination of both [2]. Previous studies have focused either on quantification of pulmonary emphysema or on airway wall assessment using CT-based indices [3,4]. In the actual scenario, however, the majority of cases encountered in clinical practice have varying components of both phenotypes. This study was done with the aim of prospectively quantifying both the components in patients of COPD in the North Indian population subgroup.
Material and methods
This is a prospective study conducted during a span of one year in our institution, after approval from the institutional Ethical Committee, and after informed consent was gained from patients for their voluntary participation. A total of 52 consecutive patients diagnosed clinically with COPD using American Thoracic Society criteria and fulfilling the inclusion and exclusion criteria were included in the study. The patients were first examined clinically in the Department of Pulmonary Medicine and diagnosed as COPD. Following this, spirometry and MDCT imaging of the chest was done on the same day. Prior to CT examination, data were collected with regard to anthropometric parameters, smoking index, and body mass index (BMI).
Imaging procedure
Helical non-contrast CT scan was performed on a 16-slice MDCT scanner (Philips Brilliance) in suspended full inspiration using the following parameters: kVp – 120; mAs – 200; slice thickness – 3 mm; gantry tilt – 0 degrees; Matrix – 512 × 512. Post processing was done using the inbuilt software application “Lung Emphysema”. A colour-coded display of emphysematous areas in both lungs was obtained, and calculation results table and histograms were generated. The percentage LAA obtained was used to determine the grade of emphysema severity, and patients were grouped as mild (0-5%), moderate (5-30%), and severe (> 30%).
Multiplanar reconstruction was done to align the image of the airway along its true longitudinal axis and one bronchial branch from each lobe (RUL, RML, RLL, LUL, lingular segments, and LLL) was selected for assessment in the true transverse plane. Various airway dimensions were then measured separately by two radiologists with twenty and nine years of experience in chest CT imaging, and the averages of the readings were given. A minimum of six segmental bronchi having external diameters more than 2 mm were evaluated manually on Lung Window using the previously-described CT indices [4]. The outer wall diameter (D) and inner wall/luminal diameter (L) were determined, and then the BWT and PWA were calculated using the following formulas: PWA = π (D/2)2 – π (L/2)2/ π (D/2)2 × 100; π (D/2)2 for the total area, where π (L/2)2 is the endoluminal area. BWT was used to grade the severity of the airway disease into mild (1-2 mm), moderate (2-3 mm), and severe (> 3 mm).
Statistical analysis
Statistical analysis was done using IBM SPSS software (Version 23). The continuous variables were expressed as mean ± SD. The Mann-Whitney test was used to compare the airway measurements, MAA values, and PFT results between the various disease groups. Results were considered significant at p value < 0.05
Results
The mean age of patients in our study was 64 years with maximum number of patients in the age group of 61-70 years. Out of 52 patients, there were 47 males and five female patients with a male: female ratio of 9.3:1. The mean BMI in the study was 18.42 (SD ± 2.95) with a range of 13.04-27.0. All male subjects were smokers, and all female patients had a history of exposure to biomass fuel. The smoking index, calculated for males according to formula used by Jindal et al. [5] (SI = No. of cigarettes/bidis per day × total duration), showed mean SI of 562.89 S.D ± 369.66 with the maximum number of patients (61.53%) having SI > 300 (Table 1). Comparison between BMI and SI values yielded a p value of 0.01, establishing a statistically significant correlation.
Table 1
Anthropometric and spirometric data distribution in the study population
| Parameter | Mean ± SD | Range |
|---|---|---|
| Age (years) | 64.17 ± 10.51 | 35-83 |
| Height (cm) | 160.15 ± 7.74 | 146-177 |
| Weight (kg) | 47.26 ± 8.36 | 33-78 |
| BMI | 18.42 ± 2.95 | 13.05-27.96 |
| Smoking Index (Jindal) | 562.89 ± 369.66 | 50-1440* |
| FEV1 (% predicted) | 40.55 ± 19.24 | 12-88 |
| FVC (% predicted) | 59.94 ± 22.21 | 23-133 |
| FEV1/FVC (%) | 64.61 ± 13.39 | 34-95 |
Spirometric examination yielded a mean FEV1 (% predicted) of 40.55 SD ± 19.24, mean FVC (% predicted) of 59.94 SD ± 22.21, and mean FEV1/FVC ratio of 64.61 ± 13.39% (Table 1). Correlation of FEV1/FVC ratio with CT severity grading of emphysema was statistically significant, with a p value of 0.034. A similar correlation between FEV1/FVC and BWT was, however, not observed.
The emphysema software post processed data yielded a mean %LAA of 11.78 ± SD 11.81. There was also more severe involvement of the left lung, which showed a mean emphysematous volume of 294.63 cc as compared to a volume of 228.11 cc in the right lung (Table 2).
Table 2
Distribution and quantification of emphysema
In our study, the airway CT morphometric parameters of BWT and PWA were found to be increased (overall mean of 1.89 SD ± 0.42 mm for BWT and 80.83 SD ± 6.22% for PWA) (Table 3). BWT was observed to be higher in the airway-predominant group (mean thickness 1.94 ± 0.28 mm) and lower in the emphysema-predominant subgroup (mean thickness of 1.79 ± 0.23 mm). The difference in two groups was statistically significant with p value of 0.005.
Table 3
Morphometric indices of airway disease
Using the obtained CT based parameters of %LAA and BWT; we subcategorised our patients into emphysema-predominant, bronchitis-predominant, and mixed phenotypes, depending on the severity of their predominant findings (Table 4). The maximum number of patients (N = 16) were seen in the subcategory of emphysema predominant moderate, followed by mixed mild (N = 14), mixed moderate (N = 8), and emphysema predominant severe (N = 7).
Table 4
Classification of COPD into subcategories
Discussion
Chronic obstructive pulmonary disease is an obstructive disorder of peripheral airways, which occurs as a result of inflammatory response that causes remodelling of small airways or destruction of lung parenchyma.
Smoking is a common risk factor, which incites these slowly progressive inflammatory changes. In our study, which included 52 consecutive patients of clinically diagnosed COPD; all males patients (N = 47) had a history of smoking (N = 47), while all female patients had a history of biofuel gas exposure (N = 5). Mean smoking index for male patients was 562.89 ± 369.66. Expectedly, the patients with high SI values had frail build with lower BMI values especially in patients with emphysema-predominant phenotype, and the correlation between the two variables was found to be statistically significant. This observation is in corroboration with previous studies, which showed similar correlation between BMI and emphysema [6,7].
In addition to smoking, advancing age has also been considered as a significant factor in the prediction of clinically significant COPD. This was also corroborated in our study because the majority of patients were elderly, falling in age range of 61-70 years, and with a mean age of 64 years (SD ± 10.51).
Gender-specific differences in clinical expression of COPD are known, and females have been considered more likely to develop airway-predominant disease in comparison to males, who commonly have emphysema-predominant subtype [8]. Gender-based variations were also witnessed in our study, and the male patients (constituting 90.38% of the study group) showed an emphysema pattern in the majority (N = 22; 46.80%), followed by mixed (N = 23; 27.65%) and bronchitis patterns (N = 12; 25.53%). Females constituted only a small number of patients in the study group (9.62%), and interestingly the majority of them showed a mixed pattern (60.0%) instead of the expected airway pattern. The reason for this variation could be a history of exposure to biomass fuel smoke in the female patients in our study, which led to the coexistence of emphysema with airway disease.
Spirometry has traditionally been used to diagnose the COPD, and GOLD has defined COPD as FEV1/VC < 0.7 after bronchodilator administration. Its utility is, however, limited because it provides functional information only and cannot reliably distinguish the airway-predominant COPD from the emphysema-predominant subtypes.
With the advent of newer-generation multislice CT, it has become possible to categorise COPD into its subtypes, as done in previous studies [9-11]. In our study helical CT was carried out on the same day as the spirometric examination using standard parameters and protocols, and all the COPD patients were subcategorised into various phenotypes, and their further grading based on severity of findings was done.
In patients with emphysema, CT provides information on the various subcategories of emphysema and their regional distribution. Quantification of emphysema can be done using threshold techniques expressed as low attenuation area (LAA%). Automatic segmentation using software tools can then express the results on lobar basis. We used the inbuilt emphysema software tool with the result expressed as the percentage of LAA, for emphysema quantification (Figure 1). LAA is believed to be the CT correlate of loss of lung recoil representing emphysema at macroscopic or microscopic level. We observed that centrilobular emphysema was the most common subtype, seen either alone (N = 19, 36.5%) or in combination with paraseptal emphysema (N = 18, 34.6%). This type of emphysema is most commonly associated with cigarette smoking. In our study all the 37 patients showing centrilobular emphysema were smokers. Among the rest of patients, 17.3% (N = 9) showed panacinar pattern, while 11.5% (N = 6) showed isolated paraseptal emphysema. The severity of emphysema was stratified on the percentage of lung LAA and categorised into mild (0-5%), moderate (5-30%), and severe (> 30%). The majority of patients showed moderate severity disease (N = 24, 46.2%) followed by mild severity (N = 16, 30.8%). Severe cases were relatively uncommon in our study (N = 7, 13.5%). A statistically significant association was observed between spirometry (FEV1/FVC) and the CT correlate of emphysema (%LAA), suggesting that patients with more severe obstruction had a greater degree of emphysematous changes. Similar observations were made also for the bronchitis-predominant group, but the correlation was not statistically significant.
Figure 1
Multi detector computed tomography (MDCT) coronal MPR image (A), coronal density mask images in coronal (B), sagittal (C), and axial planes (D) show a predominantly left-sided emphysematous disease with bullae formation

CT-based quantitative assessment of airway-predominant disease relies on indices like BWT and PWA. It is believed that these indices reflect the remodelling of small airways, which is typified by increased wall thickness and narrowing of the luminal diameter. Histological examination suggests that the morphological changes in peripheral fifth- to sixth-generation airways have a stronger correlation with the lung function test [12,13]. However, since the small airways are not visible on helical CT, it is practical to measure instead the more amenable larger airways. The underlying pathophysiological processes causing airway disease affects both small and large airways, and so measurement of CT indices in large bronchi can reflect the small airway changes too. Previous studies have also observed that cartilaginous airway wall thickening correlated with small airway changes and hence can be used as an alternative for airway inflammatory quantification [2,14]. Because the majority of airways run tangentially to the axial planes and the measurement of airway indices can be attempted only on the perpendicularly sectioned airways with circular configuration, various techniques have been devised to avoid this limitation. These include correcting the error by measuring the angle of deviation [15] or fitting an ellipse in the lumen [16]. Automatic 3D segmentation of bronchial tree airway reconstruction is another popular tool.
We used multiplanar reconstructions from the volumetric data set to align the tangential third and fourth generation bronchi to a perpendicular plane and then took the airway measurements in six different levels in each patient (Figures 2, 3). The overall mean PWA was 81.39 ± 8.53% and mean BWT was 1.89 ± 0.42 mm. Mean bronchial wall thickness in the emphysema-predominant subgroup was 1.79 ±0.23 mm and in airway predominant group it was 1.94 ± 0.28 mm. The difference between the two groups was statistically significant with a p value of 0.005. Expectedly, the mean PWA in the airway-predominant phenotype (80.50 ± 9.33) was also greater than in the emphysema-predominant subtype (77.84 ± 3.88); however, this difference was not statistically significant. These results indicate that wall thickening is reflective of airway remodelling and is more pronounced in the airway-predominant subgroup. This is also supported by previous studies done to calculate bronchial wall thickening in larger as well as distal airways [17,18]. Subjects with emphysema-predominant disease have relatively less severe wall thickness and wall area in comparison to the airway-predominant group, presumably because the nature of pathophysiological changes in smokers preferentially occur at a parenchymal level in emphysema as opposed to airways in the airway (bronchitis) subgroup [19].
Figure 2
Representative MinIP images showing the various level of sectioning of segmental and subsegmental bronchi (Boyden 3rd and 4th generation) for CT morphometric measurements. At least six bronchi (three in each lung) having circular configuration, diameter more than 2 mm, and vessel contact of < 50% of circumference were chosen
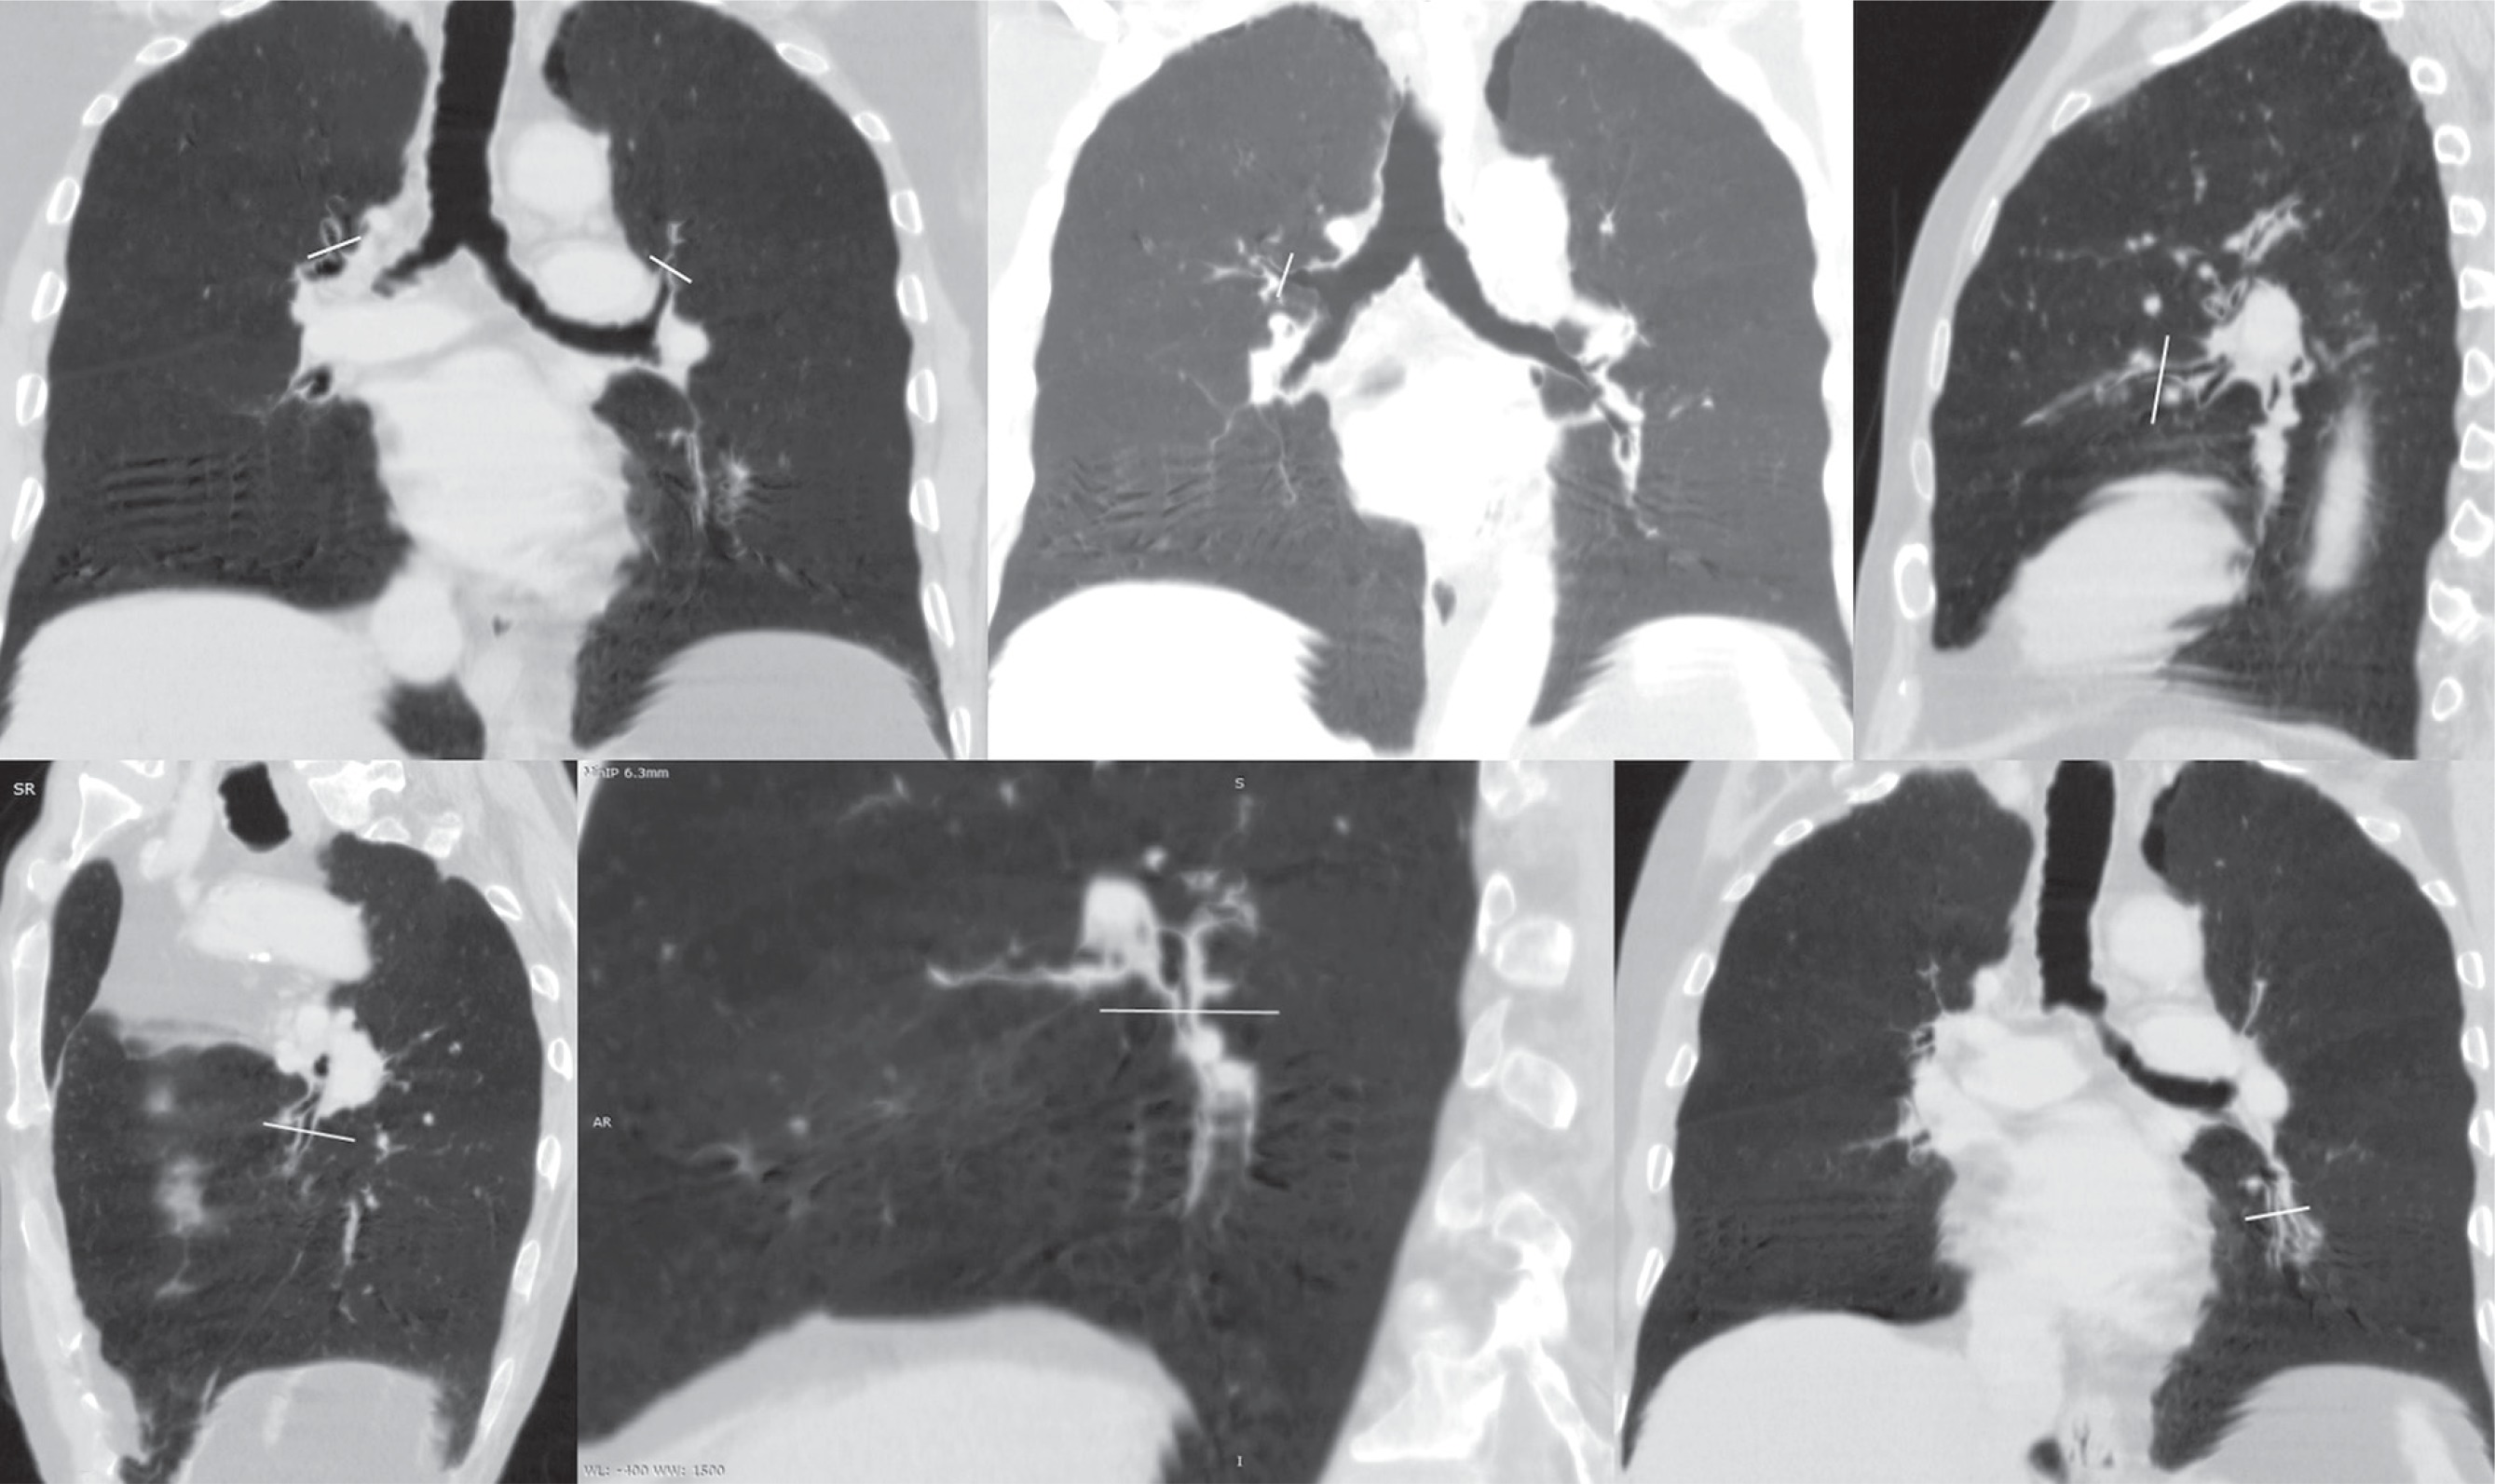
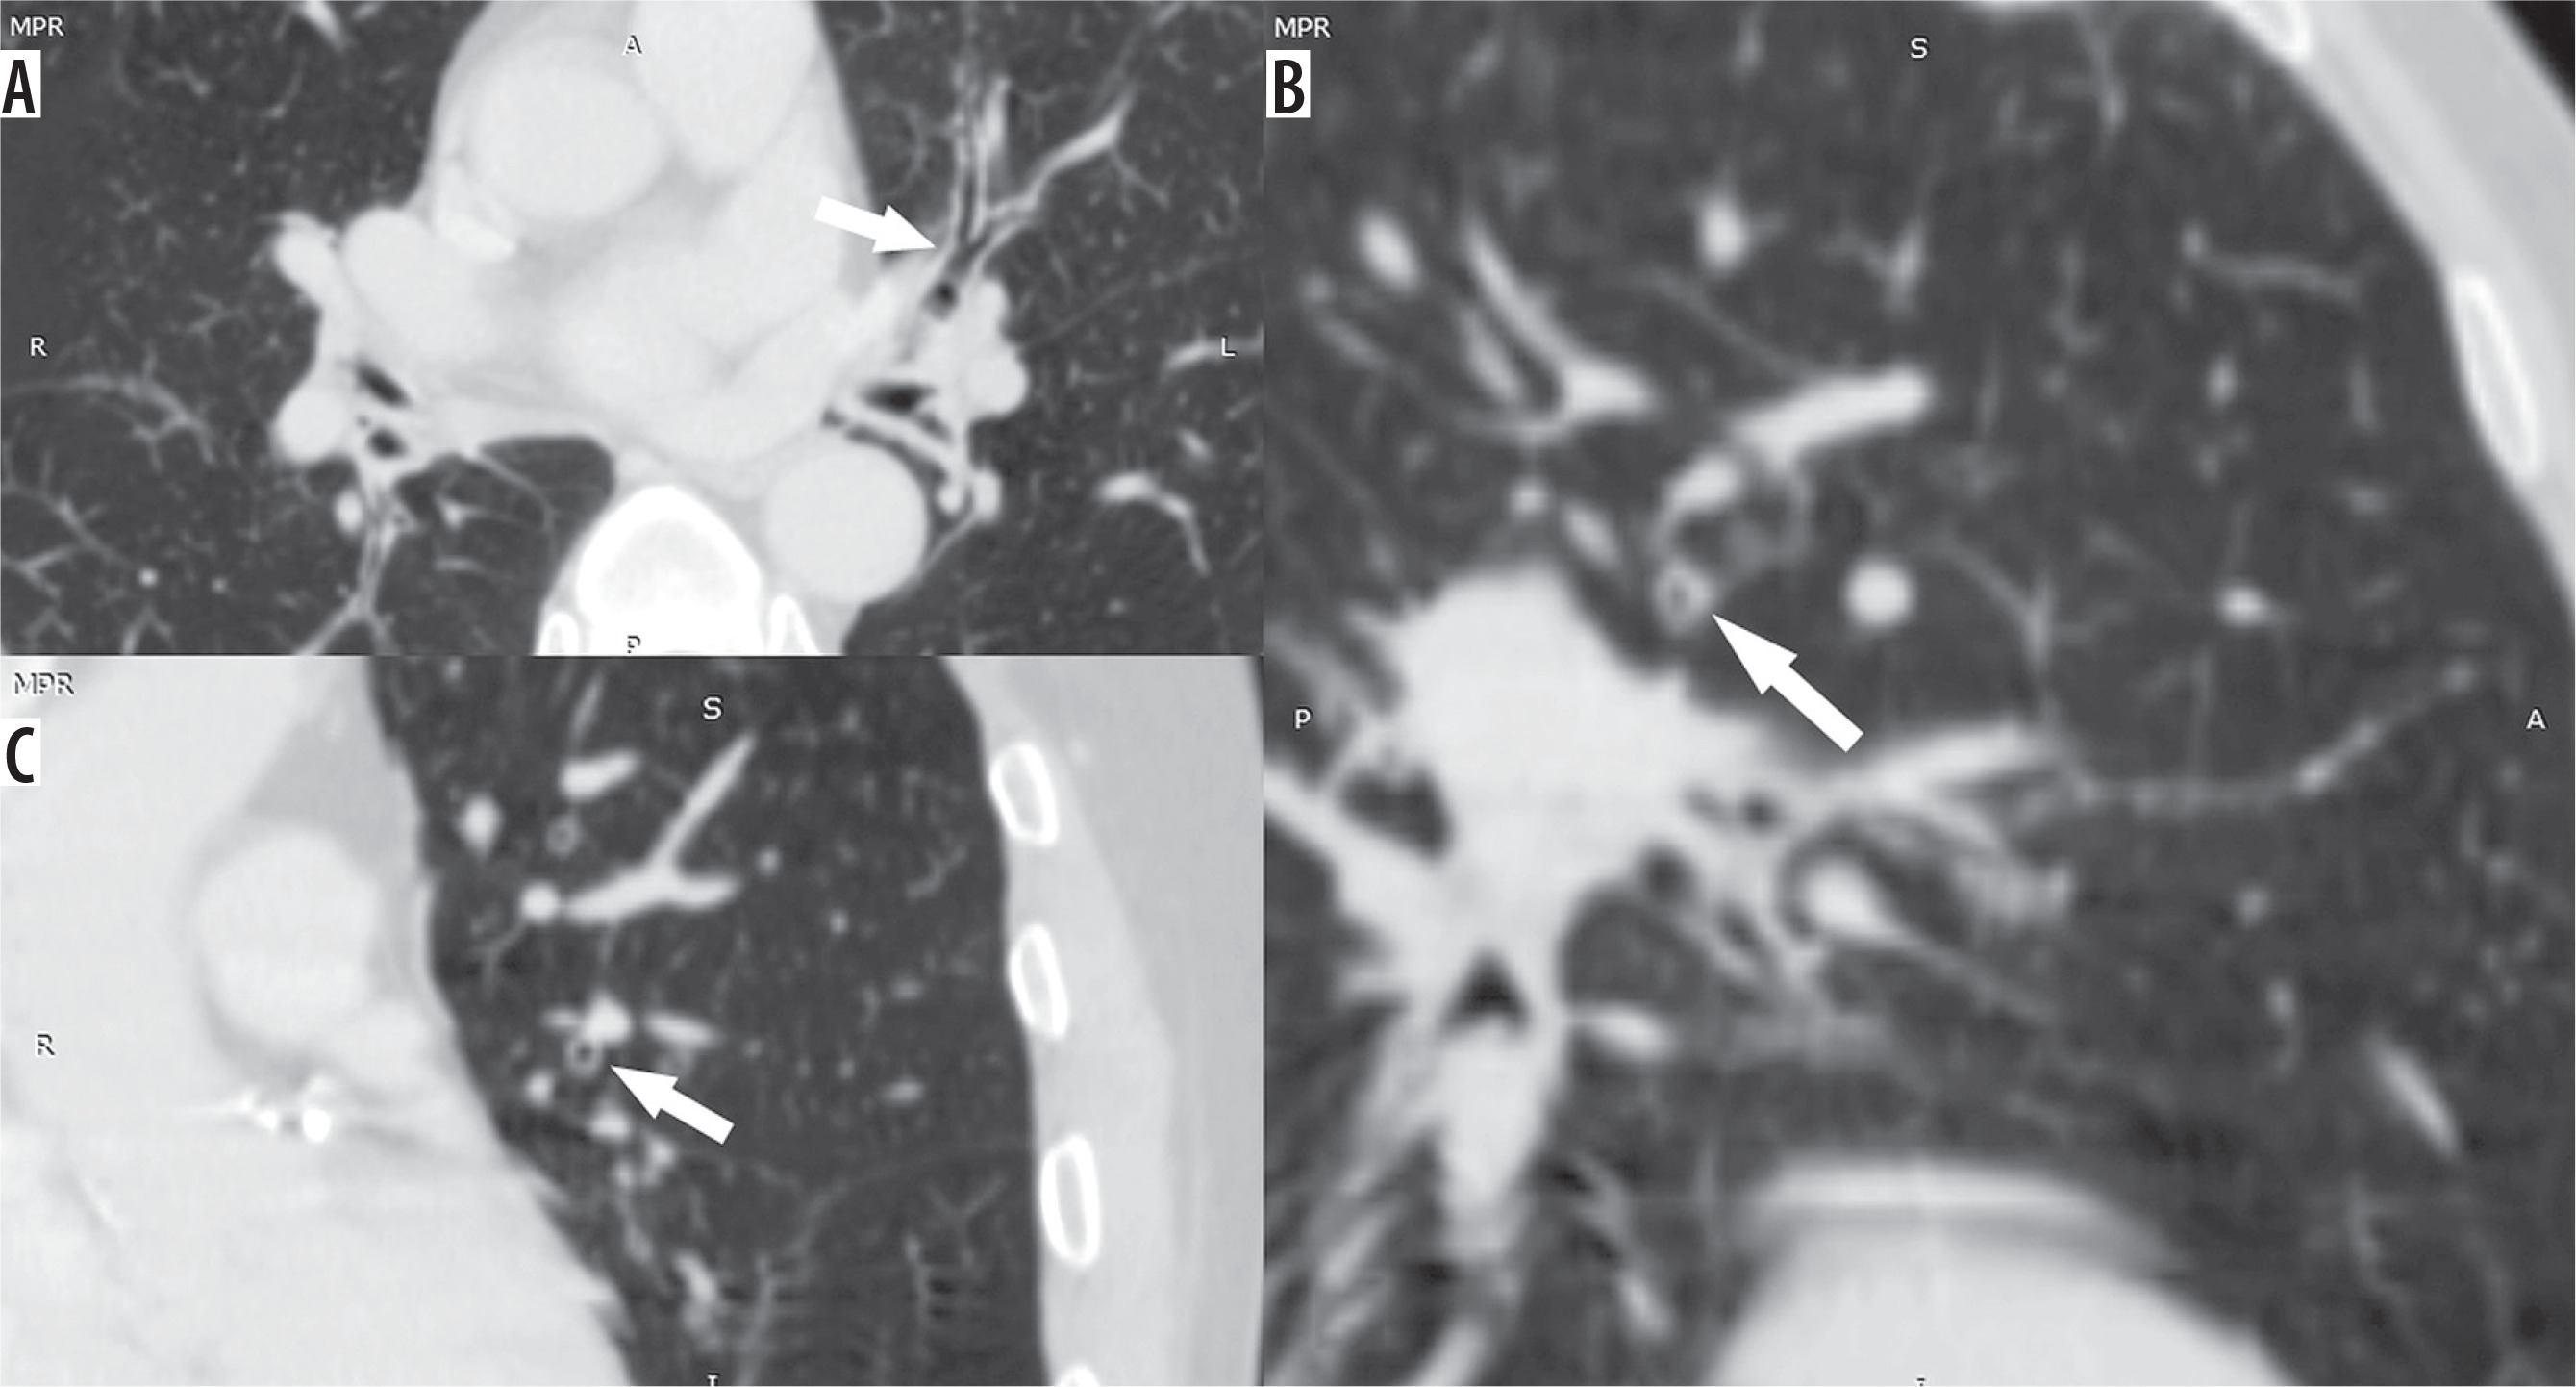
Figure 3
Axial (A), coronal (B), and sagittal (C) images in lung window showing the circumferential wall thickening with luminal narrowing (arrows) in a patient with bronchitis predominant disease
The mechanisms underlying the airflow limitation in COPD are different in the bronchitis and emphysema subgroups, but a substantial overlap occurs. In the former, airflow limitation is mainly because of the intrinsic changes in bronchial wall resulting in luminal narrowing, while in the latter it is because of alteration in the elastic recoil of lung and radial tractional forces on the bronchial wall. It is difficult to quantify the relative contributions of the two mechanisms because patients often show both of these changes to varying degrees. Using the obtained CT based parameters (%LAA and bronchial wall thickness), we subcategorised our patients into emphysema predominant, bronchitis predominant, and mixed phenotype, depending on the severity of their observed findings (mild, moderate, or severe). Patients showing both the components in equal measure were include in the mixed category. We believe that this concept can be utilised in future studies because it conveys the overlapping and continual nature of findings rather than the past concept of categorising patients into two distinct groups of bronchitis or emphysema alone, which ignores the overlapping minor component on either side.
Our study has some limitations, one of which is the lack of confirmation on histopathological examination. Therefore, the conclusions of our study are observational in nature. Another limitation could be the anatomical heterogeneity, which is believed to occur during the remodelling process in patients with airway disease, resulting in non-uniform changes in the airways.
Conclusions
Multi detector computed tomography can play a pivotal role in complete evaluation of COPD through assessment of various morphometric and software-generated parameters. Measurement of airway parameters like BWT and PWA should routinely be calculated in all emphysema patients in addition to the LAA percentage, in order to assess the coexisting airway component, grade the disease severity, and accurately categorise COPD into its various phenotypes like emphysema predominant, airway predominant, and mixed type. This simple change of protocol can serve as a valuable tool in initiating appropriate and individualised management strategies for these patients.